Trading Sessions in Forex | Free Market Sessions Indicator
Hey traders,
In this post, we will discuss trading sessions in Forex .
Let's start with the definition:
Trading session is daytime trading hours in a certain location.
The opening and closing hours match with business hours.
For that reason, trading hours are varying in different countries because of contrasting timezones.
❗️Please, note that different markets may have different trading hours.
Also, some markets have pre-market and after-hours trading sessions.
In this post, we are discussing only forex trading hours.
The forex market opens on Sunday at 21:00 GMT
and closes on Friday at 21:00 pm GMT.
There are 4 main trading sessions in Forex:
🇦🇺 Australian (Sydney) Session Opens at 21:00 GMT and closes at 06:00 GMT
🇯🇵 Asian (Tokyo) Session Opens at 12:00 GMT and closes at 9:00 GMT.
🇬🇧 UK (London) Session Opens at 7:00 GMT and closes at 16:00 GMT.
🇺🇸 US (New York) Session Opens at 12:00 GMT and closes at 21:00 GMT.
Asian trading session is usually categorized by low trading volumes
while UK and US sessions are categorized by high trading volumes.
Personally, I trade the entire UK session and US opening and usually skip Australian and Asian sessions.
There is a free technical indicator on TradingView that allows to underline trading sessions on a price chart. It is called "Market Sessions".
Being added, it displays the market trading sessions.
What trading sessions do you trade?
Learning

Understanding the ICT BREAKAWAY GAPIn this video I go through the ICT Breakaway Gap and how YOU can use it to your advantage. I include some tips and tricks with a real trade setup demonstration.
The Breakaway Gap may have been an elusive concept to understand, but I present a simple way you can spot them on the chart and frame your trades around them. It is a powerful weapon that can be used to snag some awesome trades.
Simple put, the Breakaway Gap is a gap that does not get traded into with the NEXT FEW CANDLES. Emphasis on the last part because price is fractal, and the best way to frame a trade with ICT's Concepts is by taking a few candles on the higher timeframe for your bias, and going to a lower timeframe to form your narrative, and either entering on that timeframe or even going to a lower timeframe for your entry.
Hopefully this gives you some insight into one of the many concepts that ICT has bestowed upon the public.
If you need clarification about the content, or you are still struggling with finding your groove as a trader and need personal guidance or mentorship, feel free to reach out to me via TradingView’s private message or on X.
Happy trading and happy studying!
- R2F

Understanding LIQUIDITYIn this video I try to explain liquidity as it pertains to training in a simple manner.
Liquidity are basically orders in the marketplace. Since trading is a zero-sum game, without liquidity, there is no trading. Simply put, If you wanted to BUY, then you would need someone to SELL to you, and vice versa.
Smart Money has deep pockets and needs a large amount of liquidity to facilitate their positions. They want to be able to get in and our of their trades, as well as to be able to trade with capital that would be worth the reward.
The largest pools of liquidity usually reside above swing highs and lows, and equal highs and lows (double/triple tops and bottoms). Support and Resistance ideologies dominate the market, and besides that, psychologically it makes sense to put stoplosses at such areas rather than at some random area within a range. There are also breakout traders who see price breaking out of an area as a sign of strength (or weakness if bearish) and they set their entries above/below these levels. This is how liquidity is "engineered" in the market and sentiment manipulated. These pools of liquidity can be seen as a magnet, drawing price to these levels, either to grab liquidity before reversing or continuing in its current direction.
- R2F

2U (Is e-education the future?) I stand before you to discuss the transformative power of e-education and its pivotal role in shaping the future of learning. As we navigate the dynamic landscape of education, e-learning emerges as a beacon of innovation, offering unprecedented opportunities for learners across the globe.
In this digital era, e-education transcends geographical boundaries, providing accessibility to knowledge regardless of one's location. The future of learning lies in the integration of technology into education, fostering a culture of continuous and personalized learning experiences.
Consider the vast potential of e-learning in reaching the global youth population. With an estimated 2.2 billion children worldwide, the digital realm offers a scalable solution to meet the diverse educational needs of this burgeoning demographic. E-education becomes a catalyst for inclusivity, breaking down barriers and ensuring that every child has the chance to access quality education.
The e-tech era has ushered in a wave of innovation, offering interactive and engaging platforms that cater to varied learning styles. Virtual classrooms, online resources, and collaborative tools redefine the educational landscape, preparing students for the demands of the digital future.
As we embrace the e-tech revolution, let us recognize the power it holds to democratize education. It empowers learners to chart their unique educational journeys, fostering a sense of ownership and curiosity. The future of e-learning promises a world where education is not confined to the classroom but extends beyond, seamlessly integrating into our daily lives.
In conclusion, let us champion e-education as the harbinger of a brighter, more accessible future of learning. Together, let us strive to harness the potential of technology to shape a world where every child, regardless of their circumstances, can embark on a journey of discovery and knowledge. Thank you.

Learn What is FOREX Market. Trading Volumes & Market Participant
Forex - foreign exchange market, is a location where international currencies are bought and sold by economic participants at various exchange rates.
Forex market is the biggest market in the world, reaching on average 6 trillion dollars trading volumes daily.
Forex market is a vital element for a global economy because it provides capital exchanges between the countries.
The main market participants of forex market are central banks, commercial banks, commercial companies, hedge funds and investors.
🕰In order to grasp how big is that market, take a look what is happening on that just in 60 seconds:
📎Total transactions value reaches 3.52 billion US dollars.
📎 1.15 billion dollars of spot transactions.
📎 1.65 billion dollar of exchange swaps.
📎 Total transactions value involving USD reaches 3 billion US dollars.
📎 Total transactions value involving EURO reaches 1.1 billion US dollars.
📎 Just one single EUR/USD pair accumulates 812 million US dollars transactions value.
It is hard to imagine how such big amounts are rolling with such a frequency and how insignificant are the orders of individual traders.

Range Bar Chart, Line Chart & Candlestick Chart - Everything You
Hey traders,
In this post, we will discuss 3 most popular types of charts.
We will discuss the advantages and disadvantages of each one, and you will decide what type is the most appropriate for you.
📈Line Chart.
Line chart is the most common chart applied by analysts. Reading financial articles in different news outlets, I noticed that most of the time the authors apply line chart for the data representation.
On a price chart, the only parameter that the one can set is a time period.
Time period will define a time of a security closing price. The security closing prices overtime will serve as data points.
These points will be connected with a continuous line.
Line charts are applied for displaying an asset's price history, reducing the noise from less volatile times.
Being simplistic, they can provide a general picture and market sentiment. However, they are considered to be insufficient for pattern recognition and in depth analysis.
Above, a line chart is applied for analysis of a long-term trend on Gold.
📏Range Bar Chart.
In contrast to a line chart, a range bar chart does not consider time horizon. The only parameter that the one can set is a price range.
By the range, I mean a price interval where the price moves. A new bar will be formed only once the prices passes the desired range.
Such a chart allows to completely ignore time variable, focusing only on price movement and hence reducing the market noise.
The chart will plot new bars only when the market is volatile, and it will stagnate while the market is weak and consolidating.
Accurately setting a desired price range, one can get multiple insights analyzing a range bar chart.
In the example above, one range bar represents 10 pips price range on EURUSD.
🕯Candlestick Chart.
The most popular chart among technicians and my personal favorite.
ith just one single parameter - time period, the chart plots candlesticks.
Each candlestick is formed as a desired time period passes.
It contains an information about the opening price level, closing price, high and low of a selected time period.
Candlestick chart is applied for pattern recognition and in-depth analysis. Its study unveils the behavior of the market participants and their actions at a desired time period.
Each candle stick represents a price action within 4 hours on AUDUSD chart above. (time frame is 4H)
Of course, each chart has its own pluses and minuses. Choosing its type, you should know exactly what information do you want to derive from the chart.
What chart type do you prefer?

OTK up 5000% and Still going Bounced off .5 Fib Perfectly!OTK came to our attention months ago and has not dissappointed yet.
It's up over 5000% and is obviously still climbing. We ran a fib extention on it to give some appropriate price targets
Current Price
0.12
0.19
0.27
0.31

🧿How to be a Trader, not a Gambler⛔Hi.
✅Using technical analysis and fundamental analysis at the same time:
By combining technical and fundamental analysis, you pay attention not only to the patterns and behavior of price action traders in the past, but also to the fundamental and economic factors that act as the driving engine of market movements (macroeconomics). Together, these two approaches provide greater ability to understand market fluctuations and also create a harmonious relationship between charts and economic factors active in the market, allowing you to determine more effective entry and exit points and make your decisions using Take a more comprehensive and principled view.
✅Mastery of a strategy
A strategy for a trader is like a guide to a lost traveler. A trading style helps you stay on track and achieve your long-term goals.
With the strategy in sensitive market conditions, you will not get confused and incur irreparable losses. You also analyze your transactions more accurately.
There are different strategies in forex, but it is better to have a strategy that you completely trust and that is very efficient and profitable.
✅Accuracy of transactions with risk to reward greater than 1 :
A gambler doesn't care when it's the right time to enter a trade. Sometimes the markets do not have the conditions to enter into the transaction and they do not give you a good reward for the risk. Once you have analyzed the market as a professional trader and your entry triggers are activated, you actually have to wait until you can implement the rules of capital management.
In these cases, you should watch until the market gives you a risk to reward of 1 to 2 or 3 and the entry is allowed.
✅Capital management
As a trader, it is necessary for you to have risk management in trading to preserve your capital. Not using capital management may empty your entire financial account. Gamblers do not care about capital management and they may invest their entire assets in one trade. Therefore, it is better to determine the amount of your loss in each trade and exit when the trade does not go according to your expectations. Of course, loss is an inseparable part of the trading system; If the loss is small, a lesson will be learned from it and it will be helpful in the future.
🔔In the end, regardless of the above, like a gambler, your percentage of success versus loss is 50-50 in each trade, but if you follow the above, you can increase your win-to-loss percentage.
__ _______ _____ _________ _______ ______ ______ ______ ______ _____ _________ ________
❤️If this text was useful for you, please like it and share it with your friends

Happy New Year 2024| Learn Our Methods | Read Description|Happy New Year Everyone 2024:
Let's first talk about CHFJPY then we will talk about how you can improve and learn some tips.
CHFJPY in last six or seven months price overbought heavily due to JPY poor performance and government's zero intention to interfere in the market. However, many reports suggests that JPY will likely to be rebound in first quarter of 2024 in this case we can see a strong shift in price characteristics. Our first entry indicates, that we should expect price to continue the bearish momentum and drop from current area of the price. However, as we will having NFP in the first week of the month, it is likely to see some unexpected movement in the market. Second entry, is when price fill the gaps in the market and then drop smoothly, we will keep you updated.
We want all of you to succeed in the forex or commodities trading.
Here how you can improve:
Firstly find one or two pairs that suits you: meaning if you focus on every single instruments available to trade in the market, you will never succeed instead focus on one or two pairs and master them, know how and when these pairs move, what factors influence them in the market and trade swing highs and lows.
Secondly, use longer time frames to have a better vision, have a longer vision which will help you catch the big moves, yes, it is time consuming but if you are beginner then focus first in this and then along the way you will learn intraday trading.
Lastly, learn more about consolidation, accumulation and distribution: before the big reversal, price first will consolidate then accumulate and distribute, you should be looking to enter in phase of accumulation and take every enter when price consolidate which leads to a breakout.
If you learn above information in details and practice, your chances of becoming a successful trade increase. There is no overnight success, it is all hard work, if you believe in your self and focus on above things you will one day be proud of yourself.
Happy New Year and Trade Safe 2024.
We wish all of you all the best.
Team Setupsfx_

CROMPTON ZOOOOOOOOM !!NSE:CROMPTON Shared in perfect timing and zoomed with 3%
Almost 9k/Lot bagged to all our friends.
Happy LEarning !!

The Good the Bad and the Neutral scenarioLet's all wish a happy new year!
Let's all see the ads for the super products
don't worry if you don't .. the company knows how to do it!
* Let's remember those in our local area who need to sell their products (or online) and buy some (good scenario)
* Let's see more ads without buying nothing (Bad scenario for now)
* Let's see what our favourite people do with smoke signals until the market gives us the up or down signal
If you liked this idea or if you have your own opinion about it, write in the comments.
Thanks for reading!

What is the ( Flag pattern) ?A flag pattern is a technical analysis chart pattern that can be observed in the price charts of financial assets, such as stocks, currencies, or commodities. It is considered a continuation pattern, indicating that the prevailing trend is likely to continue after a brief consolidation or pause.
The flag pattern is formed by two main components:
Flagpole : The first part of the pattern is a strong and sharp price movement, either upward (bullish flag) or downward (bearish flag). This initial move is known as the flagpole and represents a strong surge in buying or selling activity.
Flag : Following the flagpole, there is a period of consolidation where prices move in a rectangular or parallelogram-shaped pattern. This consolidation phase is referred to as the flag. The flag is characterized by decreasing volatility and typically forms a channel or a rectangle.
There are two types of flag patterns:
Bullish Flag: The flagpole is an upward price movement, and the flag is a downward-sloping consolidation. This pattern suggests a temporary pause in the upward trend before a potential continuation.
Bearish Flag: The flagpole is a downward price movement, and the flag is an upward-sloping consolidation. This pattern indicates a temporary pause in the downward trend before a potential continuation.
Traders often look for flag patterns as they may provide insights into the market sentiment and offer potential trading opportunities. The breakout direction (up or down) from the flag pattern is considered a signal for the potential future price movement. However, it's important to note that not all flags result in a continuation of the previous trend, and traders often use other technical indicators and analysis to confirm signals and manage risk.

TSLA - trade ideaBeen a while since I posted an idea here, it doesnt matter what Ideas I post, it is more important to learn trade psychology and understand your risk reward, you can enter 1,000 trades with bad risk reward and never win. Or you can step into the arena, get beaten up enough times to finally snap out of it and find your way. Why risk it to make the biscuit?!
TESLA Support resistance trades, no trader has the golden ticket, find your way!
Funded 1.7m with APEX and TakeProfit trader, after blood sweat and tears, it may not be much to many but to me its lifechanging. Lets get it!!!!

Essential Tips for Newbie Day Traders: Forex and Gold Trading
Entering the world of day trading can be both exciting and daunting, especially for those who are new to the game. This article aims to provide simple yet valuable recommendations for beginner day traders specifically focusing on forex and gold trading. 💼💰🚀
1. Educate Yourself:
Before diving into day trading, it is crucial to understand the intricacies of the forex and gold markets. Take the time to learn about the basic terminology, technical analysis, fundamental analysis, and different trading strategies. Knowledge is your best weapon in this realm. 📚✍️📈
Start by reading books, attending webinars or courses, or even joining online trading communities to gain insight into successful day trading techniques.
2. Practice with a Demo Account:
To avoid unnecessary losses, it is highly recommended to practice trading using a demo account. This allows you to gain hands-on experience without the risk of losing real money. Take the time to experiment with different strategies and understand how the market works. 📊📝💡
Tradingview paper trading offers demo accounts where you can simulate real trading scenarios and test your skills.
3. Develop a Trading Plan:
A well-defined trading plan is essential for any day trader. Specify your goals, risk tolerance, and trading style. Determine the maximum amount you are willing to risk per trade and set realistic profit targets. Stick to your plan and avoid impulsive decisions. 📝🎯💼
Example: Decide on a risk-to-reward ratio, such as 1:2, which means you are willing to risk $1 to potentially earn $2, and only take trades that meet this criteria.
4. Manage Your Risks:
Risk management is a crucial aspect of day trading. Never risk more than you can afford to lose and always set stop-loss orders to limit potential losses. It is important to maintain a disciplined approach to preserve your capital. 💪💸📉
Example: Let's say you have $10,000 as your trading capital. Set a maximum loss limit per trade, such as $200, and ensure your stop-loss order reflects this limit.
5. Keep Up with Market News:
Stay informed about global events, economic indicators, and market news that can impact the forex and gold markets. Develop a routine of reading relevant financial news and reports to stay ahead of market trends. 🌍📰💼
Important events like central bank announcements, political developments, or changes in commodity prices can significantly affect currency and gold prices.
Tradingview nicely displays the coming news on the horizontal scale of a price shart. Just click on a circle and you will see the coming related events.
In conclusion, starting out as a newbie day trader in the forex and gold markets requires a combination of knowledge, practice, discipline, and risk management. By following these simple recommendations, you will be better equipped to navigate the markets and enhance your chances of success in day trading. 💪📊✨

BITCOIN SHORTER TIME FRAME UPDATE Bitcoin (BTC) is currently operating within a bullish channel and has recently experienced a bounce off the support provided by the ascending trendline and the 100-day moving average (MA). The cryptocurrency is presently trading within the Ichimoku cloud, accompanied by the Relative Strength Index (RSI), signaling a bearish divergence move.
For bullish trend confirmation, it is imperative for the bulls to regain momentum and achieve a decisive breakout above the horizontal resistance level, approximately around 38,000. Conversely, a sustained breakdown of the ascending trendline would suggest the potential for a short-term correction.
In simpler terms, Bitcoin is following an upward trend, finding support at the ascending trendline and the 100-day moving average. However, caution is advised as the RSI is signaling a potential bearish divergence. A clear breakthrough above the resistance at 38,000 would be a positive indicator for a bullish continuation, while a sustained break below the ascending trendline could indicate a short-term correction in the market.
This chart is likely to help you make better trade decisions if you consider upvoting it.
I would also love to know your charts and views in the comment section.
Thank you

"Bitcoin Halving: Your Complete Guide""Hello everyone, I hope you are all doing well. Without further delay, let's proceed to the chart."
"The Bitcoin halving is a significant event in the cryptocurrency market, happening approximately every four years. It involves cutting the block reward for miners in half, reducing the new BTC supply by 50%. The next halving is expected in early 2024, occurring after 840,000 blocks, and will decrease the mining reward from 6.25 BTC to 3.125 BTC per block."
"The hard-coded technical mechanism forms the foundation of scarcity, providing Bitcoin with its value proposition as verifiably finite digital gold. This comprehensive guide will delve into Bitcoin halving dates, their impact on price and mining, and why they hold significant importance."
What is Bitcoin Halving?
The Bitcoin halving refers to the periodic reduction by half of the block reward granted to miners for solving the cryptographic puzzle to add new blocks to the Bitcoin blockchain. This action effectively cuts in half the quantity of new Bitcoin introduced into circulation with each discovered block. Given the consistent reduction in supply alongside ongoing demand growth, these anticipated halving events typically trigger an increase in Bitcoin's market price over the subsequent 12–18 months.
Bitcoin was ingeniously designed with a fixed and capped supply of 21 million coins, gradually released through mining rewards. The periodic halving events are crucial to gradually diminishing new issuance until the total supply cap is reached. This systematic reduction in inflation enhances scarcity in a predictable manner.
Historical Significance and Market Impact
Each Bitcoin halving event has historically brought about significant market dynamics. Previous halvings have resulted in increased demand and subsequent price appreciation for Bitcoin. The decrease in block rewards directly influences the available supply, frequently creating a supply-demand imbalance that propels the price upward. After past halvings, Bitcoin has undergone remarkable bull runs, culminating in new all-time highs.
Implications for the Cryptocurrency Industry:
The Bitcoin halving event carries several implications for the broader cryptocurrency industry. Firstly, it reinforces Bitcoin's scarcity and limited supply, positioning it as a store of value akin to precious metals like gold. The halving also serves as an incentive for miners to secure the network by contributing computational power, as reduced block rewards can potentially impact mining profitability. Furthermore, the event heightens investor and public awareness, drawing attention to the innovative nature of cryptocurrencies.
Historical Bitcoin Halving Dates:
November 28, 2012 — Block 210,000 mined (Reward decreased to 25 BTC)
July 9, 2016 — Block 420,000 mined (Reward decreased to 12.5 BTC)
May 11, 2020 — Block 630,000 mined (Reward decreased to 6.25 BTC)
March 2024 (Estimated) — Block 840,000 mined (Reward expected to decrease to 3.125 BTC)
Halving Price Impact Patterns:
While various complex macroeconomic and sentiment factors contribute to Bitcoin's well-known price volatility, halvings have consistently preceded significant bull runs.
Following the initial two halvings, BTC experienced substantial increases within 12–18 months. For instance, Bitcoin was valued at under $12 during the first halving in November 2012, soaring over 100x to approximately $1,150 by December 2013.
The 2016 halving foreshadowed Bitcoin's remarkable 2017 bull run, reaching nearly $20,000. Just nine months after the May 2020 halving, Bitcoin reached new all-time highs surpassing $64,000 before retracing to a lower trading range.
This recurring pattern supports the notion that halvings shape Bitcoin's boom-and-bust cycles by significantly limiting new supply issuance while user adoption and demand continue to grow exponentially.
However, accurately predicting the timing and magnitude of peak prices following halvings remains challenging due to the multitude of variables influencing market sentiment swings.

Fibonacci Retracement/Extensions- How & Why? | Live ExampleFibonacci retracements in technical analysis of various assets use a mathematical sequence discovered by Italian mathematician Leonardo Fibonacci. This sequence is a series of numbers where each number is the sum of the two preceding ones: 0, 1, 1, 2, 3, 5, 8, 13, 21, and so on. In stock trading, Fibonacci retracements are used to identify potential levels of support or resistance during price corrections.
Imagine you have a stock that has been rising in price for some time. Suddenly, it starts to decline. Traders who use Fibonacci retracements believe that during this downward movement, the stock price will likely retrace or bounce back to certain levels before continuing its downward trend.
These retracement levels are derived from the Fibonacci sequence. The most commonly used levels are 38.2%, 50%, and 61.8%. For example, if a stock's price drops from 100 to 80, traders would expect it to bounce back to around 88.20 (38.2% retracement), 90 (50% retracement), or 93.20 (61.8% retracement) before continuing its decline.
While their effectiveness is debated just like any other tool, many traders including myself believe that these levels act as psychological support or resistance points due to the large number of market participants who follow this approach.
Let us get back on the example above.
I drew a trendline which had helped me back in 2021 to predict the top in GOLD. This is the perfect example of how EVERY PRICE movement matters. The Fibonacci levels are derived from levels from 2008. In this example the Fibonacci extension level 3.618 held as a perfect resistance for the price of GOLD.
2008 to 2023, isn't this amazing? How long can a single price movement can have its affect!
How to draw a Fibonacci Retracement/Extension?
It's fairly simple. Just plot one end of the fib to the high of the price movement and the other to the low or vice versa.
I'll answering all your queries in the comments below. Please feel free to reach out!

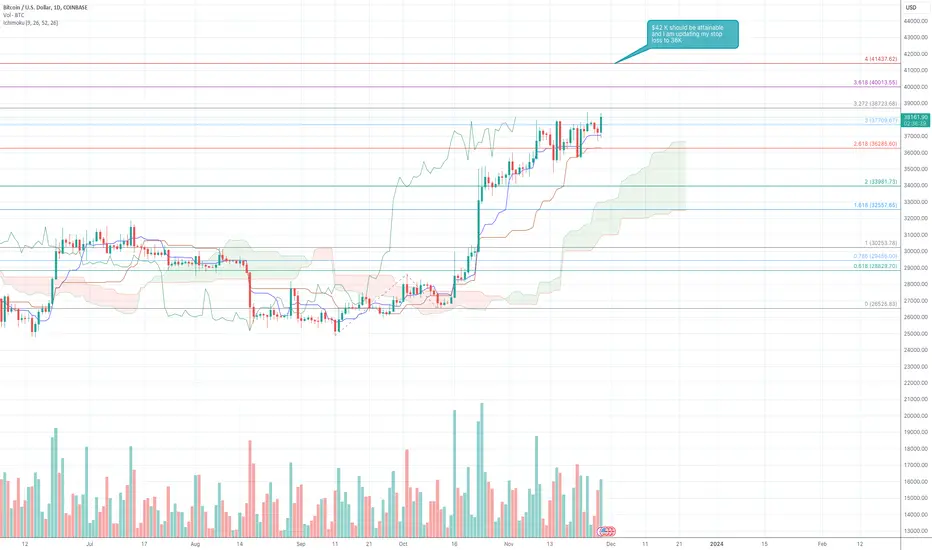
$BTC Daily $42K New Target and Stop loss $36k?This was my earlier analysis on BTCUSD and you can find it there
Based on my relearning of Ichimoku and Fib, looks like 38K is a big resistance on Daily. It has to break it and then 40s is next! Let me know what you think and how I can improve
My new target is FWB:42K and stop loss is 36K based on Fib and Kijun Sen
$STNE Fibonacci and Ichimoku Daily As always learning or going back to learning. A chart a day makes one happy every day!
Take Profit and Stop Loss
Used Fibonacci 4 Hour for Stop loss and for take profit used Daily Fibonacci. Now Ichimoku is the base chart for guidance
You always learn by doing it. I bought it on my long term plan and am also setting an alert for this on Trading View.

Stages of a Downtrend: Insights from AI AnalysisDear Respected Members of the TradingView Community,
I start with some straightforward insights. I've executed significant crypto sales this month. However, my decision was not because of any pre-established forecasts. The motivation behind my decision to part with cryptocurrencies like BTC was primarily due to liquidity challenges. I found it increasingly difficult to execute orders without impacting the market by moving prices, widening spreads, or settling for unfavorable market orders. Often, I had to exercise more patience than desired while waiting for the fulfillment of my limit orders. Eventually, when suitable over-the-counter (OTC) opportunities presented themselves, I decided to divest from these challenging assets. It's important to note that this decision was independent of price predictions.
Y ou can consider various factors beyond price movement for an investment choice. Factors such as trading volume, liquidity, spreads, and transaction fees can add value to your decision-making process. The focus points of this discussion are price forecasts, where trading volume is one of the influential variables.
F or those of you who have been tracking the trading volume candles from December 20, 2020, to the present, you may have observed a consistent decline in trading volume. Deep Neural Networks (DNN) tend to associate this declining volume with a waning interest in BTC-USD. While the overall trend for BTC has been bullish since November 14, 2022, DNN suggests that this rising trend could be a retracement within a broader bearish development that began on November 15, 2021. The significance of understanding the trend lies in assessing the risk-reward ratio. Generally, positions aligned with the prevailing trend offer a more favorable risk-reward ratio. An adaptive DNN model can add more than programmed indicators as it can adapt to changing market conditions and provide certainty metrics regarding potential trends.
A s per my adaptive DNN analysis, there is a 70% probability that the bearish trend will persist, compared to a 30% probability for a bullish trend. However, market dynamics are influenced by multiple trends, each exerting varying degrees of impact at different times. Fuzzy Logic Trading (FLT) reveals that factors associated with the bearish trend currently hold a 60% influence on BTC-USD, with bullish parameters contributing 40%. Probabilities offer insights into potential future scenarios, while membership degrees provide a more nuanced perspective on the actual forces at play within a given scenario.
A t present, the price of Bitcoin is approaching a juncture defined by multiple trendlines that may serve as resistance levels. One of these resistance lines previously served as a support level for local bottoms on January 2, 2023, March 13, 2023, and June 12, 2023. However, since Bitcoin breached this support line, it may have transitioned into a resistance line. It is just one example of a trendline that could act as a barrier, given the broader horizontal resistance zone extending between $38,000 and $32,000.
A nother notable resistance line within this zone is the trendline connecting the peaks of the bullish retracement tail on April 10, 2023, July 3, 2023, and the present. These examples illustrate the potential resistance trendlines, with the entire zone representing a supply margin where additional barriers may exist. It's worth noting that bullish trends can possess the strength to break through resistance trendlines or zones, transforming them into support trendlines and demand zones.
W hile an AI-driven analysis suggests a 30% probability of a continuing bullish trend, the market exhibits a 40% bullish influence from external factors such as news and prominent opinions, as determined by my Natural Language Processing (NLP) algorithm and mathematical tools from FLT. Should the BTC price establish a demand zone and initiate an upward trajectory from the support trendlines, the market could witness new local highs, potentially surmounting at least one of the aforementioned resistance trendlines within the supply zone. While this scenario does not guarantee a parabolic surge, it remains a possibility.
O n one hand, optimistic investor sentiment could potentially transform even the sharply rising resistance trendline into a support level, as indicated by the blue forecast in the chart. On the other hand, a 70% probability of a continuing bearish trend, as suggested by dynamic DNN, and a 60% bearish influence per FLT, even in the presence of a bullish trend, implies a degree of caution.
I n Finance, the path to profit is often a winding road, with ups and downs that can confound even the most seasoned investors. While many market participants tend to focus on bullish scenarios, it's essential to understand the various stages of a downtrend. Let's explore these phases and gain some insights from artificial intelligence. Every significant downtrend begins with a subtle sign – a warning of what's to come. Unfortunately, this early signal is soft while the bullish sentiment prevails. This initial warning is crucial for astute investors who pay attention to the nuances of the market. As the uptrend falters and inevitably fails, it becomes evident that the market is in a state of decline. This point often lures individuals into considering an all-in strategy, driven by the conviction that "It always goes back up." This misguided belief can lead to significant losses. Following the decline, there's typically a rally, which sometimes recovers a significant percentage from the previous drop. This rally can be deceptive, luring investors believing that a new bullish trend is underway. However, it's crucial to exercise caution and not be swayed solely by short-term gains. Tragically, the anticipated bullish trend often turns out to be a trap, leading to a prolonged and persistent downtrend. This phase can be particularly challenging for investors who have been misled by the allure of the initial rally.
M oreover, artificial intelligence has made significant strides in the field of market analysis. By employing Dimensionality Reduction (DR) techniques, AI can detect potential bearish butterfly patterns on full-timeframe BTC charts available through pricing engines. Additionally, AI has identified the presence of a bearish Head and Shoulders pattern in the yearly timeframe of 2023. It's important to bear in mind that patterns are essentially estimations of probabilities and potential volatility structures. Any pattern can break in either an upward or downward direction, signaling either a bullish or bearish scenario, respectively.
E xamining the Relative Strength Index (RSI) and the spread between the price and Exponential Moving Average (EMA) 20 reveals that they currently fall within a historically and statistically oversold range. Additionally, there is a lack of confirmation for breaching any of the aforementioned resistance lines, let alone the supply zone itself.
I n summary, a scalping strategy within the supply zone from the upper trendline to the lower boundary, as depicted in the short position on the chart, could be considered. If the bearish trend persists, other strategies may extend this short position beyond the resistance zone, potentially reaching the EMA 200 at around $25,000, where Bitcoin could encounter an underlying demand zone and various support trendlines.
I t's essential to remember that trading decisions should not be solely based on price forecasts. The cryptocurrency market is influenced by various factors, and price is just one of them. This is not intended as investment advice. I encourage you to conduct your research and take full responsibility for your funds. Past performance does not guarantee future results.
I n conclusion, understanding the stages of a downtrend is vital for any investor seeking to navigate the complexities of financial markets. Additionally, the integration of AI analysis can provide valuable insights, enhancing our ability to make informed decisions in the ever-evolving world of finance. Remember that no prediction is foolproof, and prudent risk management remains essential in the world of investment.
Warm regards,
Ely

Combining technical analysis at BNBUSD There are a lot of technical analysis methods to use, my favorite method is to combine several technical analysis and look for the same point as strong support to buy and strong resistance to take profit.
In this example, I use chart pattern, fibonacci ABCD pattern and classic support and resistance.
Chart pattern
channel up with medium line perform strongly, yesterday this medium line broke down and tried to reach channel up support.
channel up support can be a good entry point with target at medium line or maximum target at channel up resistance
Classic support and resistance
Resistance become support or support become resistance also a strong technical analysis method.
in this chart, we have 23 October resistance at $238.6, and now it has become new support.
ABCD Fibonacci Pattern
Fibonacci are the best pattern to combine with channel up, especially if we have symmetrical channel up.
In many cases, 0.618 touch channel up support and 1.618 touch channel up resistance as bullish target.
I am a naked trade analyst, so in every analysis I do not use technical indicators, but sometimes people used to combine technical indicator, ie. moving average, EMA, MacD, Bollinger band, and many others. As long as it is accurate and profitable, use it.
Let me know in comment below what kind of combination you like most.

"Stop Loss Essentials: Preventing Losses in Uptrends"Hi guys, This is CryptoMojo, One of the most active trading view authors and fastest-growing communities.
Consider following me for the latest updates and Long /Short calls on almost every exchange.
I post short mid and long-term trade setups too.
Let’s get to the chart!
I have tried my best to bring the best possible outcome to this chart, Do not consider financial advice.
Common Reasons Why Traders Lose Money Even in an Uptrend
#Not Setting Stop-Loss:
#Not Conducting Technical Analysis:
#Going against the Trends:
#Following the Herd:
#Being Impatient:
#Not doing Homework or Research:
#Averaging on Losing Position:
Buy low sell high' is the motto. As simple as it sounds, why do most people lose money trading or investing?
There are four major mistakes that most beginners make:
1. Excessive Confidence
This stems from the idea that people think of themselves as special. They think they can 'crack the code' in the stock market that 99.9% of people fail to, and eventually make a living trading and investing. However, taking into consideration the fact that more people lose money in the market, this form of wishful thinking is the same mentality as going into a casino feeling lucky. You may actually get lucky and win big the first few times, but in the end, the house always wins.
2. Distorted Judgements
While simplicity is key, the approach most beginners make in trading and investing are too simplistic, to the extend where it's hard to even call it a trading logic or reason to invest. They spot a few reoccurring patterns within the market, and this is almost as if they discovered fire. It doesn't take long to realize that the "pattern" they spotted was never based on any solid reasoning, or worse, wasn't even a pattern at all in the first place.
3. Herding Behavior
The fundamentals of this is also deeply rooted in a gambling mindset. Beginners are attracted to the idea of a single trade or investment that will make them a millionaire. However, they fail to realize that there is no such thing. Trading and investing is nothing like winning the lottery. It's about making consistent profits that compound throughout time. While people should definitely look for assets that have high liquidity and some volatility , the get-rich-quick mentality drags irrational beginners into overextended/overbought stocks that eventually drop drastically.
4. Risk Aversion
Risk aversion is a psychological trait embedded within all of mankind's DNA. Winning is fun, but we can't tolerate losing. We tend to avoid risk, even when the potential reward is worth pursuing. As such, many beginners take extremely small amounts of profits, in fear that they might close their position at a loss, trading with a terrible risk reward ratio. In the long run, their willingness to not take any risks leads to losses.
Depending on the price action, they also go through seven phases of psychological stages:
- Anxiety
- Interest
- Confidence
- Greed
- Doubt
- Concern
- Regret
------------------------------------------------------------------
Lack of Discipline
An intraday trader must stick to a proper plan. A full-fledged intraday plan includes profit targets, factors to consider, methods to put a stop loss, and ways to select the right trading hours. The trading plan provides a comprehensive overview of how trading should be executed. Also, you can keep a record of trades executed during the day with the performance analysis of each stock at the end of the day. Such records help you identify the weak areas in your trading strategy and correct them. It is very important to be disciplined as a trader, the proper discipline will help you minimize the losses and maintain your capital.
Not Setting Proper Trading Limits
In intraday trading, the success lies in managing the risk. You should pre-define a stop loss and profit target when entering intraday trading. This strategy itself is an important part of trading discipline and this is where most people fail. For instance, if you incur a loss in the first hour itself, you should shut down the trading terminal for the rest of the day. You should also have an overall capital loss limit in place, it will safeguard you against trading losses.
Compensating for a Rapid Loss
This is one of the common mistakes in the trading community. When a trader incurs a loss, he/she either tries to average a position or overtrades excessively to recover the loss. This further leads to a greater loss and put them into more trouble. Losses are a part of intraday trading, instead of overtrading, it is wise to accept the loss, analyze the strategy and make improvements from the next day.
Heavy Dependency on Tips
Nowadays, there are ample of intraday tips flowing everywhere on the digital media. It is a common phenomenon for a trader to rely on these external tips, however, this needs to be avoided. The best way to learn intraday trading is by gradually learning how to read charts, understanding structures, and interpreting results on your own. Many traders refrain from taking these efforts and because of this, they end up on the losing side. The Beyond App by Nirmal Bang provides deeper insights into the market, the technical research offered by Nirmal Bang is spot on. You can use that research for reference, however, nothing can beat practical experience.
Not Keeping Track of Current Affairs
The external news, events, and tragedies do have an impact on the stock market. Hence, it is important for an intraday trader to keep a track of the Indian as well as global markets. Even the performance of global markets has an impact on the movement of Indian markets. Make your trade after the news or event has been announced, do not try to speculate the market based on the news.
There are even instances when traders do not have any sound trading strategy, they just make decisions based on gut feelings or emotions. One needs to remember that intraday trading in itself is a skill, it is not a gamble, it takes time to develop proficiency, you cannot expect rapid results. The above are some of the major reasons why intraday traders lose money, ensure that you are disciplined enough, stick to a proper strategy, analyze your strategy at regular intervals, and things will fall in place.
we will discuss 3 classic trading strategies and stop placement rules.
1) The first trading strategy is a trend line strategy.
The technique implies buying/selling the touch of strong trend lines, expecting a strong bullish/bearish reaction from that.
If you are buying a trend line, you should identify the previous low.
Your stop loss should lie strictly below that.
If you are selling a trend line, you should identify the previous high.
Your stop loss should lie strictly above that.
2) The second trading strategy is a breakout trading strategy.
The technique implies buying/selling the breakout of a structure,
expecting a further bullish/bearish continuation.
If you are buying a breakout of resistance, you should identify the previous low. Your stop loss should lie strictly below that.
If you are selling a breakout of support, you should identify the previous high. Your stop loss should lie strictly above that.
3) The third trading strategy is a range trading strategy.
The technique implies buying/selling the boundaries of horizontal ranges, expecting a bullish/bearish reaction from them.
If you are buying the support of the range, your stop loss should strictly lie below the lowest point of support.
If you are selling the resistance of the range, your stop loss should strictly lie above the highest point of resistance.
As you can see, these stop-placement techniques are very simple. Following them, you will avoid a lot of stop hunts and manipulations.
What Is a Stop-Loss Order?
A stop-loss order is an order placed with a broker to buy or sell a specific stock once the stock reaches a certain price. A stop-loss is designed to limit an investor's loss on a security position. For example, setting a stop-loss order for 10% below the price at which you bought the stock will limit your loss to 10%. Suppose you just purchased Microsoft (MSFT) at $20 per share. Right after buying the stock, you enter a stop-loss order for $18. If the stock falls below $18, your shares will then be sold at the prevailing market price.
Stop-limit orders are similar to stop-loss orders. However, as their name states, there is a limit on the price at which they will execute. There are then two prices specified in a stop-limit order: the stop price, which will convert the order to a sell order, and the limit price. Instead of the order becoming a market order to sell, the sell order becomes a limit order that will only execute at the limit price (or better).
Advantages of the Stop-Loss Order
The most important benefit of a stop-loss order is that it costs nothing to implement. Your regular commission is charged only once the stop-loss price has been reached and the stock must be sold.
3
One way to think of a stop-loss order is as a free insurance policy.
Additionally, when it comes to stop-loss orders, you don't have to monitor how a stock is performing daily. This convenience is especially handy when you are on vacation or in a situation that prevents you from watching your stocks for an extended period.
4
Stop-loss orders also help insulate your decision-making from emotional influences. People tend to "fall in love" with stocks. For example, they may maintain the false belief that if they give a stock another chance, it will come around. In actuality, this delay may only cause losses to mount.
5
No matter what type of investor you are, you should be able to easily identify why you own a stock. A value investor's criteria will be different from the criteria of a growth investor, which will be different from the criteria of an active trader. No matter what the strategy is, the strategy will only work if you stick to it. So, if you are a hardcore buy-and-hold investor, your stop-loss orders are next to useless.
At the end of the day, if you are going to be a successful investor, you have to be confident in your strategy. This means carrying through with your plan. The advantage of stop-loss orders is that they can help you stay on track and prevent your judgment from getting clouded with emotion.
2
Finally, it's important to realize that stop-loss orders do not guarantee you'll make money in the stock market; you still have to make intelligent investment decisions. If you don't, you'll lose just as much money as you would without a stop-loss (only at a much slower rate.)
Types of Stop-Loss orders
Fixed Stop Loss
The fixed stop is a stop loss order triggered when a particular pre-determined price is hit. Fixed stops can also be timed-based and are most commonly used as soon as the trade is placed.
Time-bound fixed stops are useful for investors who want to provide the position with a pre-set amount of time to profit prior to moving on to the next trade.
Only utilize time-based stops when positioned sized properly to permit major adverse swings in share price.
Trailing Stop-Loss Order
Trailing order caters to the capital gains protection of an investor, while simultaneously providing a hedge against any unexpected price downturns. It is set as a percentage of the total asset price, and the order to sell is triggered in case market prices fall below the stipulated level. However, in the case of a price rise, the trailing order adjusts automatically in tune with an overall increase in market valuation.
Suppose, in a trailing stop-loss market, an order for execution is set if the price of a security falls below 10% of the market value. Assuming the purchase price is 100 an order to sell the security is executed automatically by an authorised broker if the price falls below 90.
In case the share prices rise to 120, the trailing order stands at 10% of the current market price, which is 108. Hence, if prices consequently start falling after peaking at. 120, a stop-loss order will be executed at 108. It allows an individual to enjoy a capital gain of 8 (108 – 100) on his/her investment corpus.
Stop-Loss Order Vs Market Order
While a stop-loss order performs a sale of underlying securities provided the price falls below a prescribed limit, a market order is issued to a broker to conduct trade (both buying and selling) at the prevailing market price. Stop-loss orders are designed to reduce the risk factor, while market orders aim to increase liquidity in the stock market by eradicating the bid-ask spread difference. A market order is the most basic form of trade order placed in a stock market.
Stop-Loss Order and Limit Order
Limit orders execute a trade of stipulated securities if the price reaches a pre-set value. While a buy limit order facilitates the purchase of any securities if the price falls below the given limit, a sell limit order is executed if the price rises above the value. Limit orders are designed to maximise the profitability of an investment venture by maximising the bid-ask spread. It is in contrast to stop-loss orders, which are implemented only if the price is equal to the limit stated by investors, as a method of minimising losses in a bear market.
If you like our content, please feel free to support our page with a like, comment & follow for future educational ideas and trading setups.

Learning from Warren Buffett's 7 Major Investment ErrorsWarren Buffett's name resonates with success, particularly through investments in renowned companies such as Coca-Cola, American Express, Apple, Bank of America, Moody’s, Kraft Heinz, and more. He stands as a global icon, amassing a wealth exceeding USD 100 billion. Beyond his investment prowess, Buffett generously imparts his wisdom to millions worldwide. Among his many famous quotes, one emphasizes the importance of learning from others' mistakes.
Warren Buffett's 7 Major Investment Errors
I) Dexter Shoe Company
- In 1993, Warren Buffet's Berkshire Hathaway acquired Dexter Shoe Company, a decision he later regretted as his worst deal. Buffet made multiple significant mistakes in this acquisition.
- The first error was misjudging Dexter's potential. Berkshire bought Dexter due to its high return on capital employed but failed to consider the competitive threat posed by cheap shoes from countries like China. Buffet acknowledged this oversight in 1999, highlighting the increasing challenge for domestic producers in the face of a market flooded with 93% of 1.3 billion pairs of shoes purchased in the United States coming from abroad.
- The primary lesson here is the necessity of assessing a company's durable competitive advantage before investing. Durable competitiveness has transitioned from a good-to-have factor to a must-have for any business.
- Buffet's second mistake was financing the Dexter Shoe Company purchase with Berkshire Hathaway stock valued at 433 million dollars, rather than using cash. A single share of Berkshire's Class A stock was approximately USD 15,000 in 1993. Today, it is valued at USD 517,000.
- This decision didn't just cost Berkshire shareholders USD 433 million for a company that eventually became worthless; it resulted in a staggering loss of 15 billion dollars for Berkshire's shareholders.
- The crucial lesson derived from this experience is never to sacrifice successful investments to make risky bets.
II) Tesco
- Tesco, a British grocery chain, became a concern for Berkshire Hathaway when the company's ownership stake exceeded 5% by 2012. By 2013, signs of trouble at Tesco became evident, leading Berkshire to reduce its stake to 3.7%, amounting to an investment of nearly 1.7 billion dollars.
- In the subsequent months, Tesco's stock plummeted by nearly 50% due to declining sales, heightened competition from discount retailers, and an accounting scandal that attracted scrutiny from the UK's financial regulators.
- Buffett's mistake lay in hesitating to sell Tesco stocks despite recognizing these troubling signs. This delay resulted in a loss of approximately USD 444 million for Berkshire.
- The crucial lesson from this situation is the importance of conviction when making selling decisions. Just as one should invest with conviction, it is equally vital not to hold onto a stock if confidence in its performance wavers .
III) Energy Future Holdings
- Warren Buffett, known for seeking advice from Charlie Munger in his investment decisions, openly admitted a significant mistake in his 2013 letter. He invested USD 2.1 billion in bonds of Energy Future Holdings Corporation, banking on rising natural gas prices to boost the competitiveness of the coal-based business and yield profits.
- Unfortunately, natural gas prices plummeted from their 2007 levels, leading to substantial losses for Energy Future Holdings. The company declared bankruptcy in 2014, and Berkshire Hathaway sold the bonds at a loss of USD 873 million in 2013.
- Buffett acknowledged his error in assessing the transaction's gain-loss probabilities, emphasizing the importance of seeking a second opinion from trusted advisors or partners when making significant decisions.
- This incident highlights two essential lessons. Firstly, it underscores the risks associated with predicting market trends, whether in natural gas, oil, gold, or individual stocks. Secondly, it emphasizes the perilous nature of investing in high-yield "junk" bonds. While conglomerates like Berkshire Hathaway can absorb losses from such high-risk endeavors, retail investors face financial disaster in the event of a default. Hence, it is crucial to avoid instruments with questionable return on capital, especially in a retail investor's context.
IV) Lubrizol & David Sokol
In 2011, Warren Buffett and Berkshire Hathaway faced severe scrutiny.
- David Sokol, chairman of several Berkshire subsidiaries, recommended Lubrizol Corporation as a potential acquisition to Buffett while he himself owned stocks in the company. Sokol's failure to disclose his stock ownership violated Berkshire's insider trading rules. Despite this, Berkshire acquired Lubrizol for approximately USD 9 billion, and Sokol profited around USD 3 million from the transaction.
- Upon investigation, it became clear that Sokol had been ambiguous about how he acquired Lubrizol stock, neglecting to mention that he purchased shares after meeting with the bankers proposing the acquisition. Buffett emphasized the issue as a matter of ethics, although he initially acknowledged that no one was at fault.
- This situation highlighted the importance of not being excessively trusting in the business world. The lesson here is to maintain a checklist, follow a rigorous process, and be unafraid to ask numerous questions, especially when your reputation is at stake. Taking extra precautions becomes essential in preserving one's integrity and credibility.
V) Amazon
- Up until now, the mistakes we've discussed were all instances of active decisions leading to losses. However, there's a different kind of mistake made by Buffett that falls more under the category of missed opportunities.
- In 2017, Buffett openly admitted that he had been observing Amazon.com for an extended period but never invested in it. In his own words, he confessed, “I was too dumb to realize. I did not think Jeff Bezos could succeed on the scale he has.”
- Buffett had underestimated Amazon's brilliance in two key areas: its dominance in e-commerce and its success in cloud services through Amazon Web Services.
- Buffett's traditional approach didn't align with investing in stocks with high price-earning ratios like Amazon's in 2019. Moreover, he tended to overlook technology companies, considering them beyond his expertise.
- In this context, the significant cost of this missed opportunity becomes apparent. It underscores the necessity of having a well-defined area of expertise. However, it's even more crucial to continuously expand and evolve that expertise over time to seize valuable opportunities.
VI) Google
- The Berkshire Hathaway portfolio notably lacks any shares from Alphabet or Google, a fact that Warren Buffett deeply laments.
- Google initially piqued Buffett's interest due to a Berkshire-owned subsidiary, GEICO, operating in the auto insurance sector. GEICO heavily depends on Google's advertising platform to attract customers.
- Buffett acknowledges that he should have delved deeper into Google's business and long-term prospects. His limited technical understanding might have played a role in missing this opportunity, despite it being right within his immediate purview.
VII) Berkshire Hathaway
- It might surprise you, but Warren Buffett's most significant investment blunder occurred when he bought Berkshire Hathaway in 1962. Back then, Berkshire Hathaway was a struggling textile business, meeting the criteria of Benjamin Graham's cigar-butt investing model.
- Buffett became intrigued by the favorable financial assessment and started purchasing the stock in installments. In 1964, the company's owner, Seabury Stanton, proposed buying Buffett's shares at $11.50 per share. However, the actual offer received was $11.32, which angered Buffett. In retaliation, he acquired a controlling stake in Berkshire Hathaway and ousted Stanton from the company.
- Despite taking revenge, Buffett found himself stuck with a significant investment in a failing business. To this day, he considers it his most regrettable investment. He endured the burden of this failing textile business for an additional 20 years. Buffett admits that had he redirected the cashflows into other ventures like insurance companies, Berkshire would have been worth twice as much as it is now.
- By his estimations, Buffett's decision to invest in Berkshire Hathaway amounted to a $200 billion mistake. The lesson here is clear: emotional decisions have no place in successful investing.
Thank you
@Money_Dictators
