Reading institutional intentions through Volume ProfileReading institutional intentions through Volume Profile
Price moves where money flows. Simple truth that most traders overlook the most obvious source of money information: volume.
Volume Profile shows where trading happened. Not when, but where. The histogram on the side reveals which levels attracted buyers and sellers. While beginners draw support lines by candle wicks, money flows elsewhere.
Value zones versus noise zones
Point of Control (POC) marks the price level with maximum trading volume for the period. Price spent most time here. Buyers and sellers agreed on this price. Fair value at this moment.
Value Area covers 70% of traded volume. Boundaries of this zone show where the market considers the asset undervalued or overvalued. Price gravitates back to Value Area like a magnet.
Look at the practice. Price broke the high, everyone expects growth. Check Volume Profile—volume on the breakout is tiny. Big players didn't participate. Fake breakout. Price will return.
High Volume Node and Low Volume Node
HVN appears as thick sections on the profile. Many transactions, lots of liquidity. Price slows down at HVN, reverses, consolidates. These are market anchors.
LVN shows as thin sections. Few transactions, little liquidity. Price flies through LVN like a hot knife through butter. Nothing to grab onto there.
Traders often place stops behind HVN. Big players know this. Sometimes price deliberately hits those stops to accumulate positions. Called stop hunt .
Profile types and their meaning
P-shaped profile: one wide POC in the middle, volume distributed evenly. Market in balance. Breaking boundaries of such profile produces strong moves.
b-shaped profile: volume shifted to the bottom. Buyers active at low levels. Accumulation before growth.
D-profile: volume at the top. Distribution before decline. Big players exit positions.
Using profile in trading
Find areas with low volume between zones of high volume. LVN between two HVNs creates a corridor for fast price movement. Enter at HVN boundary, target the next HVN.
When price moves outside Value Area boundaries and volume appears there—trend gains strength. New value zone forms. Old levels stop working.
If price returns to old Value Area after strong movement—look for reversal. Market rejects new prices.
Session profiles versus weekly ones
Daily profile shows where trading happened today. Weekly shows where positions accumulated all week. Monthly gives the picture of big money distribution.
Profiles of different periods overlay each other. Daily profile POC can match weekly Value Area boundary. Strong zone. Price will react here.
On futures, account for session times:
Asian session forms its profile
European forms its own
American forms its own, with heavier volume weight
Profile rotation
Price migrates between value zones. Old Value Area becomes support or resistance for the new one. Last week's POC works as a magnet on current week.
When profiles connect—market consolidates. When they separate—trend begins.
Volume and volatility
Low volume at some level means price didn't linger there. Passed quickly. On return to this level, reaction will be weak.
Volume grows at range boundaries. Battle of buyers and sellers happens there. Winner determines breakout direction.
Composite profile
Built from several trading days. Shows where main battle happened over the period. Removes noise of individual days. Picture becomes clearer.
Composite profile helps find long-term support and resistance zones. Monthly composite shows levels institutional traders will work from all next month.
Many traders build Volume Profile directly on Trading View charts. Adjust the period, watch volume distribution, plan trades.
Learningcurrencytrading

Trading Seasonality: When the Calendar Matters More Than NewsTrading Seasonality: When the Calendar Matters More Than News
Markets move not just on news and macroeconomics. There are patterns that repeat year after year at the same time. Traders call this seasonality, and ignoring it is like trading blindfolded.
Seasonality works across all markets. Stocks, commodities, currencies, and even cryptocurrencies. The reasons vary: tax cycles, weather conditions, financial reporting, mass psychology. But the result is the same — predictable price movements in specific months.
January Effect: New Year, New Money
January often brings growth to stock markets. Especially for small-cap stocks.
The mechanics are simple. In December, investors lock in losses for tax optimization. They sell losing positions to write off losses. Selling pressure pushes prices down. In January, these same stocks get bought back. Money returns to the market, prices rise.
Statistics confirm the pattern. Since the 1950s, January shows positive returns more often than other months. The Russell 2000 index outperforms the S&P 500 by an average of 0.8% in January. Not a huge difference, but consistent.
There's a catch. The January effect is weakening. Too many people know about it. The market prices in the pattern early, spreading the movement across December and January. But it doesn't disappear completely.
Sell in May and Go Away
An old market saying. Sell in May, come back in September. Or October, depending on the version.
Summer months are traditionally weaker for stocks. From May to October, the average return of the US market is around 2%. From November to April — over 7%. Nearly four times higher.
There are several reasons. Trading volumes drop in summer. Traders take vacations, institutional investors reduce activity. Low liquidity amplifies volatility. The market gets nervous.
Plus psychology. Summer brings a relaxed mood. Less attention to portfolios, fewer purchases. Autumn brings business activity. Companies publish reports, investors return, money flows back.
The pattern doesn't work every year. There are exceptions. But over the past 70 years, the statistics are stubborn — winter months are more profitable than summer.
Santa Claus Rally
The last week of December often pleases the bulls. Prices rise without obvious reasons.
The effect is called the Santa Claus Rally. The US market shows growth during these days in 79% of cases since 1950. The average gain is small, about 1.3%, but stable.
There are many explanations. Pre-holiday optimism, low trading volumes, purchases from year-end bonuses. Institutional investors go on vacation, retail traders take the initiative. The mood is festive, no one wants to sell.
There's interesting statistics. If there's no Santa Claus rally, the next year often starts poorly. Traders perceive the absence of growth as a warning signal.
Commodities and Weather
Here seasonality works harder. Nature dictates the rules.
Grain crops depend on planting and harvest. Corn prices usually rise in spring, before planting. Uncertainty is high — what will the weather be like, how much will be planted. In summer, volatility peaks, any drought or flood moves prices. In autumn, after harvest, supply increases, prices fall.
Natural gas follows the temperature cycle. In winter, heating demand drives prices up. In summer, demand falls, gas storage fills, prices decline. August-September often give a local minimum. October-November — growth before the heating season.
Oil is more complex. But patterns exist here too. In summer, gasoline demand rises during vacation season and road trips. Oil prices usually strengthen in the second quarter. In autumn, after the summer peak, correction often follows.
Currency Market and Quarter-End
Forex is less seasonal than commodities or stocks. But patterns exist.
Quarter-end brings volatility. Companies repatriate profits, hedge funds close positions for reporting. Currency conversion volumes surge. The dollar often strengthens in the last days of March, June, September, and December.
January is interesting for the yen. Japanese companies start their new fiscal year, repatriate profits. Demand for yen grows, USD/JPY often declines.
Australian and New Zealand dollars are tied to commodities. Their seasonality mirrors commodity market patterns.
Cryptocurrencies: New Market, Old Patterns
The crypto market is young, but seasonality is already emerging.
November and December are often bullish for Bitcoin. Since 2013, these months show growth in 73% of cases. Average return is about 40% over two months.
September is traditionally weak. Over the past 10 years, Bitcoin fell in September 8 times. Average loss is about 6%.
Explanations vary. Tax cycles, quarterly closings of institutional funds, psychological anchors. The market is young, patterns may change. But statistics work for now.
Why Seasonality Works
Three main reasons.
First — institutional cycles. Reporting, taxes, bonuses, portfolio rebalancing. Everything is tied to the calendar. When billions move on schedule, prices follow the money.
Second — psychology. People think in cycles. New year, new goals. Summer, time to rest. Winter, time to take stock. These patterns influence trading decisions.
Third — self-fulfilling prophecy. When enough traders believe in seasonality, it starts working on its own. Everyone buys in December expecting a rally — the rally happens.
How to Use Seasonality
Seasonality is not a strategy, it's a filter.
You don't need to buy stocks just because January arrives. But if you have a long position, seasonal tailwind adds confidence. If you plan to open a short in December, seasonal statistics are against you — worth waiting or looking for another idea.
Seasonality works better on broad indices. ETFs on the S&P 500 or Russell 2000 follow patterns more reliably than individual stocks. A single company can shoot up or crash in any month. An index is more predictable.
Combine with technical analysis. If January is historically bullish but the chart shows a breakdown — trust the chart. Seasonality gives probability, not guarantee.
Account for changes. Patterns weaken when everyone knows about them. The January effect today isn't as bright as 30 years ago. Markets adapt, arbitrage narrows.
Seasonality Traps
The main mistake is relying only on the calendar.
2020 broke all seasonal patterns. The pandemic turned markets upside down, past statistics didn't work. Extreme events are stronger than seasonality.
Don't average. "On average, January grows by 2%" sounds good. But if 6 out of 10 years saw 8% growth and 4 years saw 10% decline, the average is useless. Look at median and frequency, not just average.
Commissions eat up the advantage. If a seasonal effect gives 1-2% profit and you pay 0.5% for entry and exit, little remains. Seasonal strategies work better for long-term investors.
Tools for Work
Historical data is the foundation. Without it, seasonality is just rumors.
Backtests show whether a pattern worked in the past. But past doesn't guarantee future. Markets change, structure changes.
Economic event calendars help understand the causes of seasonality. When quarterly reports are published, when dividends are paid, when tax periods close.
Many traders use indicators to track seasonal patterns or simply find it convenient to have historical data visualization right on the chart.

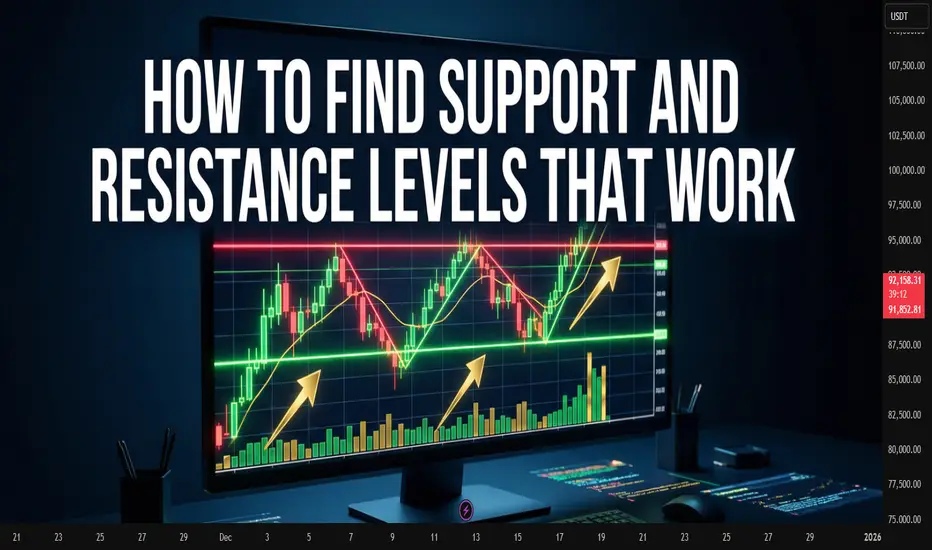
How to Find Support and Resistance Levels That Actually WorkHow to Find Support and Resistance Levels That Actually Work
Price never moves in a straight line. It bounces off invisible barriers, pauses, reverses. These barriers are called support and resistance levels.
Sounds simple. But traders often draw lines where they don't exist. Or miss truly strong zones. Let's figure out how to find levels where price reacts again and again.
What Support and Resistance Are
Imagine a ball thrown in a room. It hits the floor and ceiling. The floor is support, the ceiling is resistance.
Support works from below. When price falls to this zone, buyers activate. They consider the asset cheap and start buying. The decline slows or stops.
Resistance works from above. Price rises, reaches a certain height, and sellers wake up. Some lock in profits, others think the asset is overvalued. Growth slows down.
Why Levels Work at All
Thousands of traders look at the same chart. Many see the same reversal points in the past.
When price approaches this zone again, traders remember. Some place pending buy orders at support. Others prepare to sell at resistance. It becomes a self-fulfilling prophecy.
The more people noticed the level, the stronger it is.
Where to Look for Support and Resistance
Start with weekly or daily charts. Zoom out to see history for several months or years.
Look for places where price reversed multiple times. Not one bounce, but two-three-four. The more often price reacted to a level, the more reliable it is.
Look at round numbers. Trader psychology works so that levels like 100, 1000, 50 attract attention. Orders cluster around these marks.
Look for old highs and lows. A 2020 peak can become resistance in 2025. A crisis bottom turns into support a year later.
Drawing Levels Correctly
A level is not a thin line. It's a zone several points or percent wide.
Price rarely bounces from an exact mark. It can break through a level by a couple of points, collect stop-losses and return. Or stop a bit earlier.
Draw a horizontal line through candle bodies, not through wicks. Wicks show short-term emotional spikes. The candle body is where price closed. Where traders agreed on a compromise.
Don't clutter your chart with a hundred lines. Keep 3-5 most obvious levels. If you drew 20 lines, half of them don't work.
How to Check Level Strength
Count touches. Three bounces are more reliable than one. Five bounces - that's a powerful zone.
Look at volume. If there's lots of trading at a level, it confirms its significance. Large volume shows major players are active here.
Pay attention to time. A level that worked five years ago may lose strength. Fresh levels are usually stronger than old ones.
When a Level Breaks
A breakout happens when price closes beyond the level. Not just touched with a wick, but closed.
After a breakout, support becomes resistance. And vice versa. This is called polarity shift. Traders who bought at old support now sit in losses and wait for return to entry point to exit without losses.
A breakout must be confirmed. One candle beyond the level is not a breakout yet. Wait for the day to close, check volume, verify price didn't return.
False breakouts happen all the time. Major players deliberately knock out stops to collect liquidity.
Common Mistakes
Traders draw levels on small timeframes. A five-minute chart is full of noise. Levels from hourly or daily charts work better.
Traders ignore context. Support in an uptrend is stronger than in a downtrend. Resistance in a falling market breaks easier.
Traders enter exactly at the level. Better to wait for a bounce and confirmation. Price can break through a level by several points, knock out your stop, then reverse.
Diagonal Levels
Support and resistance aren't only horizontal. Trendlines work as dynamic levels.
In an uptrend, draw a line through lows. Price will bounce from this line upward.
In a downtrend, connect highs. The line becomes dynamic resistance.
Trendlines break just like horizontal levels. A trendline break often signals a trend reversal.
Combining with Other Tools
Levels don't work in isolation. Their strength grows when they coincide with other signals.
A level at a round number + cluster of past bounces + overbought zone on an oscillator - this is a powerful combination for finding reversals.
Traders often add technical indicators to their charts to help confirm price reaction at levels. This makes analysis more reliable and reduces false signals.
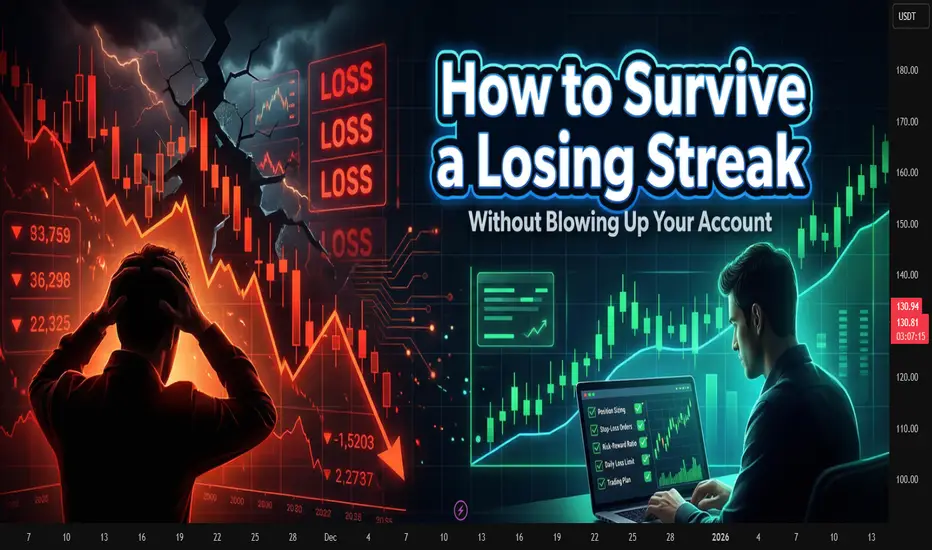
How to survive a losing streak without blowing up your accountHow to survive a losing streak without blowing up your account
Drawdown hits the account, but the real damage lands in your head.
A real trading career always includes stretches of pure red. Five, seven, even ten losses in a row can appear without anything "being wrong" with the setup. At that point the market stops looking like candles and levels, and starts looking like a personal enemy. Without a plan written in advance, the usual reaction is to increase size and "win it back."
The drawdown itself is not the main threat. The danger sits in what happens inside the drawdown: revenge trades, oversized positions, random entries just to feel in control again.
Turn the losing streak into numbers
The feeling "everything goes wrong" is vague and dangerous. Numbers are less emotional.
Simple tracking is enough:
Current drawdown in percent from the equity peak
Number of losing trades in a row
Total hit of the streak in R (risk units per trade)
Example: risk per trade is 1%, and you take five consecutive stops. That is -5%. With a personal limit of 10% drawdown, the account is still alive, but the mind is already tense. At that point the numbers matter more than mood. They show whether there is still room to act or time to stop and regroup.
Why losing streaks bend your thinking
The market does not change during a streak. The trader does.
Typical thoughts:
"The strategy is dead" after only a few stops
Desire to prove to the market that you were right
Sudden shift from clear setups to anything that "might move"
In reality it is normal distribution at work. Losses cluster. Most traders know that in theory, but very few accept it in advance and prepare a plan for that specific phase.
Build a risk frame for bad runs
Risk rules for streaks should live in writing, not in memory.
For example:
Define 1R as 0.5–1% of account size
Daily loss limit in R
Weekly loss limit in R
Conditions for a mandatory trading pause
A simple version:
1R = 1%
Stop trading for the day once -3R is reached
Stop trading for the week once -6R is reached
After a weekly stop, take at least two market sessions off from active trading
This does not make performance look pretty. It simply keeps one emotional spike from turning into a full account blow-up.
A protocol for losing streaks
Rules are easier to follow when they read like a checklist, not a philosophy.
Sample protocol:
After 3 consecutive losses: cut position size in half for the rest of the day
After 4 consecutive losses: stop trading for that day
After 5 or more consecutive losses: take at least one full day off and do only review and backtesting
Return to normal size only after a small series of well-executed trades where rules were respected
Printed rules next to the monitor work better than "mental promises." In stress the brain does not recall theory, it reads whatever sits in front of the eyes.
A drawdown journal
A regular trade log tracks entries and exits. During drawdowns you need an extra layer dedicated to the streak.
For each drawdown period, you can record:
Start date and equity at the beginning
Maximum drawdown in percent and in R
Main source of damage: risk, discipline, setup quality, or flat market conditions
Any mid-streak changes to the original plan
Outside factors such as sleep, stress, or heavy workload
After some months, the journal starts to show patterns. Many discover that the deepest drawdowns came not from the market, but from trading while tired, distracted, or under pressure outside the screen.
Coming back from a drawdown
The drawdown will end. The key part is the exit from it. Jumping straight back to full size is an easy way to start a new streak of losses.
You can describe the return process in stages:
Stage 1. One or two days off from live trading. Only review, markups, statistics.
Stage 2. Half-size positions, only the cleanest setups, strict cap on trade count.
Stage 3. Back to normal risk after a short series of trades where rules were followed, even if the profit is modest.
The drawdown is over not when the equity line prints a new high, but when decisions are again based on the plan instead of the urge to "get it all back."
Where tools and indicators help
A big part of the pressure in a streak comes from the mental load: levels, trend filters, volatility, news, open positions. That is why many traders rely on indicator sets that highlight key zones, measure risk to reward, send alerts when conditions line up, and reduce the need to stare at the screen all day. These tools do not replace discipline, but they take some of the routine off your plate and give more energy for the hard part: staying calm while the equity curve is under water.
A daily trading plan: stop trading your moodA daily trading plan: stop trading your mood and start trading your system
Most traders think they need a new strategy. In many cases they need a clear plan for the day.
Trading without a plan looks very similar across accounts. The platform opens, eyes lock onto a bright candle, the button gets pressed. Then another one. The mind explains everything with words like “intuition” or “feel for the market”, while the journal in the evening shows a pile of unrelated trades.
A daily plan does not turn trades into perfection. It removes chaos. The plan covers charts, risk, loss limits, number of trades and even the trader’s state. With that in place, the history starts to look like a series of experiments instead of casino slips.
Skeleton of a daily plan
A practical way is to split the day into five blocks:
market overview from higher timeframes
watchlist for the session
risk and limits
scenarios and entry checklist
post-session review
The exact form is flexible. The important part is to write it down instead of keeping it in memory.
Market overview: higher timeframe sets the background
The day starts on the higher chart, not on the one-minute screen. H4, D1 or even W1. That is where major swings, large reaction zones and clear impulses live.
A small template helps:
main asset of the day, for example BTC or an index
current phase: directional move or range
nearest areas where a larger player has strong reasons to act
Descriptions work best when they are concrete. Not “bullish market”, but “three higher lows in a row, shallow pullbacks, buyers defend local demand zones”. A month later these notes show how thinking about trend and risk evolved.
Watchlist: stop chasing every ticker
Next layer is a focused list of instruments. With less experience, a shorter list often works better. Two or three names are enough for the day.
Selection can rely on simple filters:
recent activity instead of a dead flat chart
structure that is readable rather than random noise
enough liquidity for clean entries and exits
Once the list is fixed, outside movement loses some emotional grip. Another coin can fly without you, yet the plan keeps attention on the few markets chosen for that day.
Risk and limits: protection from yourself
This block usually appears only after a painful streak. Until then the brain likes the story about “just this one time”.
Minimal set:
fixed percentage risk per trade
daily loss limit in R or percent
cap on number of trades
For example, 1% per trade, daily stop at minus 3R, maximum of 5 trades. When one of these lines is crossed, trading stops even if the chart shows a beautiful setup. That stop is not punishment. It is a guardrail.
Breaking such rules still happens. With written limits, each violation becomes visible in the journal instead of dissolving in memory.
Scenarios and entry checklist
After the bigger picture and limits are set, the plan moves to concrete scenarios. Clarity beats variety here.
For every instrument on the list, write one or two scenarios:
area where a decision on price is expected
direction of the planned trade
SEED_ALEXDRAYM_SHORTINTEREST2:TYPE of move: breakout, retest, bounce
[*stop and targets in R terms
Example: “ETHUSDT. H4 in an uptrend, H1 builds a range under resistance. Plan: long on breakout of the range, stop behind the opposite side, target 2–3R with partial exit on fresh high.”
An entry checklist keeps emotions in check.
$ trade goes with the higher-timeframe narrative
$ stop stands where the scenario breaks, not “somewhere safer”
$ position size matches the risk rules
$ trade is not revenge for a previous loss
If at least one line fails, entry is postponed. That small pause often saves the account from “just testing an idea”.
Post-session review: where real learning sits
The plan lives until the terminal closes. Then comes the review. Not a long essay, more like a short debrief.
Screenshots help a lot: entry, stop, exit marked on the chart, with a short note nearby.
was there a scenario beforehand
did the market behave close to the plan
which decisions looked strong
where emotions took over
Over several weeks, this archive turns into a mirror. Profitable setups repeat and form a core. Weak habits step into the light: size jumps after a loss, early exits on good trades, stop removal in the name of “room to breathe”.
Where indicators fit into this routine
None of this strictly requires complex tools. A clean chart and discipline already move the needle. Many traders still prefer to add indicators that highlight trend, zones, volatility and risk-to-reward, and ping them when price enters interesting regions. That kind of automation cuts down on routine work and makes it easier to follow the same checklist every day. The decision to trade still stays with the human, while indicators quietly handle part of the heavy lifting in the background.

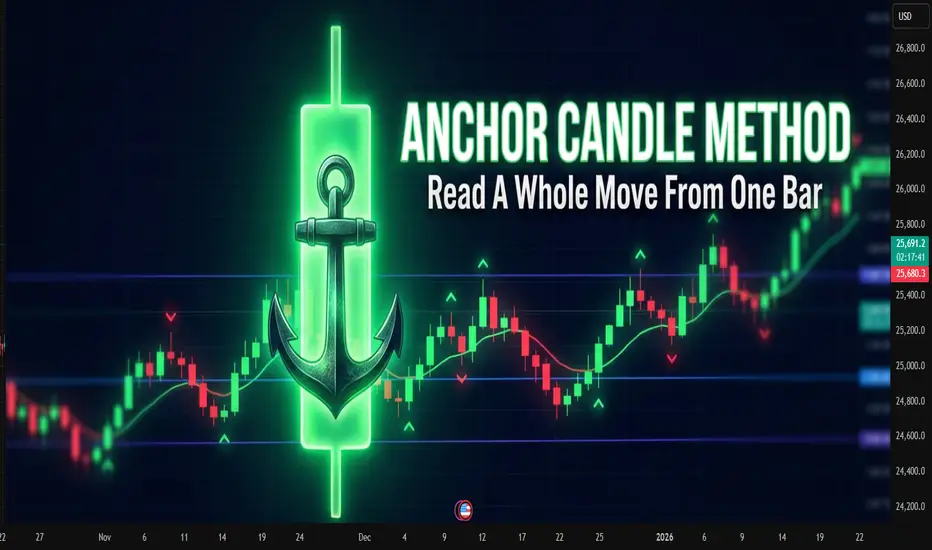
Anchor Candle MethodAnchor Candle Method: How To Read A Whole Move From One Bar
Many traders drown in lines, zones, patterns. One simple technique helps simplify the picture: working around a single “anchor candle", the reference candle of the pulse.
The idea is simple: the market often builds further movement around one dominant candle. If you mark up its levels correctly, a ready-made framework appears for reading the trend, pullbacks and false breakouts.
What is an anchor candle
Anchor candle is a wide range candle that starts or refreshes an impulse. It does at least one of these:
Breaks an important high or low
Starts a strong move after a tight range
Flips local structure from “choppy” to “trending”
Typical traits:
Range clearly larger than nearby candles
Close near one edge of the range (top in an up impulse, bottom in a down impulse)
Comes after compression, range or slow grind
You do not need a perfect definition in points or percent. Anchor candle is mostly a visual tool. The goal is to find the candle around which the rest of the move “organizes” itself.
How to find it on the chart
Step-by-step routine for one instrument and timeframe:
Mark the current short-term trend on higher timeframe (for example 1H if you trade 5–15M).
Drop to the working timeframe.
Find the last strong impulse in the direction of that trend.
Inside this impulse look for the widest candle that clearly stands out.
Check that it did something “important”: broke a range, cleared a local high/low, or started the leg.
If nothing stands out, skip. The method works best on clean impulses, not on flat, overlapping price.
Key levels inside one anchor candle
Once the candle is chosen, mark four levels:
High of the candle
Low of the candle
50% of the range (midline)
Close of the candle
Each level has a function.
High
For a bullish anchor, the high acts like a “ceiling” where late buyers often get trapped. When price trades above and then falls back inside, it often marks a failed breakout or liquidity grab.
Low
For a bullish anchor, the low works as structural invalidation. Deep close under the low tells that the original impulse was absorbed.
Midline (50%)
Midline splits “control”. For a bullish anchor:
Holding above 50% keeps control with buyers
Consistent closes below 50% shows that sellers start to dominate inside the same candle
Close
Close shows which side won the battle inside that bar. If later price keeps reacting near that close, it confirms that the market “remembers” this candle.
Basic trading scenarios around a bullish anchor
Assume an uptrend and a bullish anchor candle.
1. Trend continuation from the upper half
Pattern:
After the anchor candle, price pulls back into its upper half
Pullback holds above the midline
Volume or volatility dries up on the pullback, then fresh buying appears
Idea: buyers defend control above 50%. Entries often come:
On rejection from the midline
On break of a small local high inside the upper half
Stops usually go under the low of the anchor or under the last local swing inside it, depending on risk tolerance.
2. Failed breakout and reversal from the high
Pattern:
Price trades above the high of the anchor
Quickly falls back inside the range
Subsequent candles close inside or below the midline
This often reveals exhausted buyers. For counter-trend or early reversal trades, traders:
Wait for a clear close back inside the candle
Use the high of the anchor as invalidation for short setups
3. Full loss of control below the low
When price not only enters the lower half, but closes below the low and stays there, the market sends a clear message: the impulse is broken.
Traders use this in two ways:
Exit remaining longs that depended on this impulse
Start to plan shorts on retests of the low from below, now as resistance
Bearish anchor: same logic upside-down
For a bearish anchor candle in a downtrend:
Low becomes “trap” level for late sellers
High becomes invalidation
Upper half of the candle is “shorting zone”
Close and midline still help to judge who controls the bar
The structure is mirrored, the reading logic stays the same.
Practical routine you can repeat every day
A compact checklist many traders follow:
Define higher-timeframe bias
On working timeframe, find the latest clear impulse in that direction
Pick the anchor candle that represents this impulse
Mark high, low, midline, close
Note where price trades relative to these levels
Decide: trend continuation, failed breakout, or broken structure
This method does not remove uncertainty. It just compresses market noise into a small set of reference points.
Common mistakes with anchor candles
Choosing every bigger-than-average candle as anchor, even inside messy ranges
Ignoring higher timeframe bias and trading every signal both ways
Forcing trades on each touch of an anchor level without context
Keeping the same anchor for days when the market already formed a new impulse
Anchor candles age. Fresh impulses usually provide better structure than old ones.
A note about indicators
Many traders prefer to mark such candles and levels by hand, others rely on indicators that highlight wide range bars and draw levels automatically. Manual reading trains the eye, while automated tools often save time when many charts and timeframes are under review at once.
New Year rally: a seasonal move without the fairy taleNew Year rally: a seasonal move without the fairy tale
The “New Year rally” sounds like free money on holidays. In reality it is just a seasonal pattern that sometimes helps and sometimes only pushes traders into random entries.
The point is to understand what qualifies as a rally, when it usually appears, and how to plug it into an existing system instead of trading by calendar alone.
What traders call a New Year rally
A New Year rally is usually described as a sequence of trading sessions with a clear bullish bias in late December and in the first days of January.
Typical features:
several days in a row with closes near daily highs
local highs on indexes and leading names get taken out
stronger appetite for risk assets
sellers try to push back but fail to create real follow-through
On crypto the picture is less clean, but the logic is similar: toward year end, demand for risk often increases.
Why markets tend to rise into year end
The drivers are very down to earth.
Funds and year-end reports
Portfolio managers want their performance to look better on the final statement. They add strong names and trim clear losers.
Tax and position cleanup
In markets where taxes are tied to the calendar year, some players close losing trades earlier, then come back closer to the holidays with fresh positioning.
Holiday mood
With neutral or mildly positive news flow, participants are more willing to buy. Any positive surprise on rates, inflation, or earnings gets amplified by sentiment.
Lower liquidity
Many traders and funds are away. Order books are thinner and big buyers can move price more easily.
When it makes sense to look for it
On traditional stock markets, traders usually watch for the New Year rally:
during the last 5 trading days of December
during the first 2–5 trading days of January
On crypto there is no strict calendar rule. It helps to track:
behavior of major coins
dominance shifts
whether the trend is exhausted or still fresh
A practical trick: mark the transition from December to January for several past years on the chart and see what your market actually did in those windows.
How to avoid turning it into a lottery
A simple checklist before trading a “seasonal” move:
higher timeframes show an uptrend or at least a clear pause in the prior selloff
main indexes or key coins move in the same direction instead of diverging
no fresh, heavy supply zone sitting just above current price
risk per trade is fixed in advance: stop, position size, % of equity
exit plan exists: partial take-profit levels and a clear invalidation point
If one of these items fails, it is better to treat the move as market context, not an entry signal.
Common mistakes in New Year rallies
entering just because the calendar says “late December”
doubling position size “to catch the move before holidays”
buying right at the end of the impulse when distribution has already started
skipping the stop because “they will not dump the market into New Year”
Seasonal patterns never replace risk management. A setup that does not survive March will not magically improve in December.
A note on indicators and saving time
Many traders prefer not to redraw the whole market every December. It is convenient when an indicator highlights trend, key zones and momentum, and the trader only has to read the setup. In that case New Year rallies become just one more pattern inside a consistent framework, not a separate holiday legend.

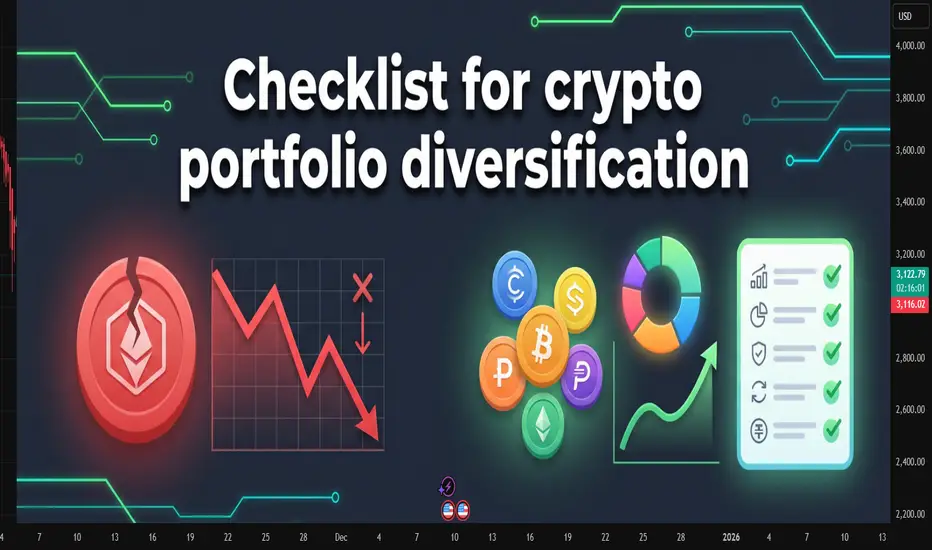
Crypto diversification checklist for your portfolioCrypto diversification checklist for your portfolio
When the market runs hot, it feels tempting to dump all capital into one coin that moves right now. The story usually ends the same way. Momentum fades, the chart cools down, and the whole account depends on one or two tickers. Diversification does not make every decision perfect. It simply keeps one mistake from breaking the account.
What a diversified crypto portfolio really means
Many traders call a mix of three alts and one stablecoin a diversified basket. For crypto it helps to think in a few clear dimensions:
asset type: BTC, large caps, mid and small caps, stablecoins
role in the portfolio: capital protection, growth, high risk
sector: L1, L2, DeFi, infrastructure, memecoins and niche themes
source of yield: spot only, staking, DeFi, derivatives
The more weight sits in one corner, the more the whole portfolio depends on a single story.
Checklist before adding a new coin
1. Position size
One coin takes no more than 5–15% of total capital
The total share of high risk positions stays at a level where a drawdown does not knock the trader out emotionally
2. Sector risk
The new coin does not fully copy risk you already have: same sector, same ecosystem, same news driver
If the portfolio already holds many DeFi names, another similar token rarely changes the picture
3. Liquidity
Average daily volume is high enough to exit without massive slippage
The coin trades on at least two or three major exchanges, not on a single illiquid venue
The spread stays reasonable during calm market hours
4. Price history
The coin has lived through at least one strong market correction
The chart shows clear phases of accumulation, pullbacks and reactions to news, not only one vertical candle
Price does not sit in a zone where any small dump is enough to hurt the whole account
5. Counterparty risk
Storage is clear: centralized exchange, self-custody wallet, DeFi protocol
Capital is not concentrated on one exchange, one jurisdiction or one stablecoin
There is a simple plan for delisting, withdrawal issues or technical outages
6. Holding horizon
The time frame is defined in advance: scalp, swing, mid term, long term build
Exit rules are written: by price, by time or by broken thesis, not only “I will hold until it goes back up”
Keeping the structure stable
Diversification helps only when the rules stay in place during noise and sharp moves. A simple base mix already gives a frame:
core: BTC and large caps, 50–70%
growth: mid caps and clear themes, 20–40%
experiments: small caps and new stories, 5–10%
cash and stablecoins for fresh entries
Then the main routine is to rebalance back to these ranges every month or quarter instead of rebuilding the whole portfolio after each spike.
A short note on tools
Some traders keep this checklist on paper or in a spreadsheet. Others rely on chart tools that group coins by liquidity, volatility or correlation and highlight weak spots in the structure. The exact format does not matter. The key is that the tool makes it easy to run through the same checks before each trade and saves time on charts instead of adding more noise. Many traders simply lean on indicators for this routine work because it feels faster and more convenient.
Chasing the last train: how late entries ruin good trendsChasing the last train: how late entries ruin good trends
The picture is familiar.
The asset has already made a strong move, candles line up in one direction, chats are full of profit screenshots.
Inside there is only one thought: "I am late".
The buy or sell button is pressed not from a plan, but from fear of missing out.
This is how a classic "last train" entry is born.
This text breaks down how to spot that moment and how to stop turning each impulse into an expensive ticket without a seat.
How the last train looks on a chart
This situation has clear signs.
Long sequence of candles in one direction with no healthy pullback.
Acceleration of price and volatility compared to previous swings.
Entry happens closer to a local high or low than to any level.
Stop is placed "somewhere below" or moved again and again.
The mind focuses on other people’s profit, not on the original plan.
In that state the trader reacts to what already happened instead of trading a prepared setup.
Why chasing the move hurts the account
The problem is not just "bad luck".
Poor risk-reward .
Entry sits near an extreme. Upside or downside left in the move is small, while a normal stop needs wide distance. In response there is a temptation to push the stop further just to stay in.
Large players often exit there .
For them the trend started earlier. Where retail opens first positions, they scale out or close a part of the move.
Strategy statistics get distorted .
A system can work well when entries come from levels and follow a plan. Once late emotional trades appear in the mix, the math changes even if the historical chart still looks nice.
How to notice that the hand reaches for the last train
Knowing your own triggers helps.
This symbol was not in the morning watchlist, attention appeared only after a sharp spike.
The decision comes from news or chat messages, not from calm chart work.
There is no clear invalidation level, the stop sits "somewhere here".
Many timeframes blink at once, the view jumps from 1 minute to 15 minutes and back.
Inner talk sounds like "everyone is already in, I am the only one outside".
If at least two of these points match, the trade is most likely not part of the core system.
Simple rules against FOMO
Work goes not with the emotion itself, but with the frame around trades.
No plan, no trade .
A position opens only if the scenario existed before the spike. Fresh "brilliant" ideas during the impulse are placed into the journal, not into the order book.
Move distance limit .
Decide in advance after what percentage move from a key zone the setup becomes invalid.
For example: "if price travels more than 3–4 percent away from the level without a retest, the scenario is cancelled, next entry only after a pause and new base".
Trade from zones, not from the middle of the impulse .
Plans are built around areas where a decision makes sense, not around the fastest part of a candle.
Time filter .
After a sharp move, add a small pause.
Five to fifteen minutes with no new orders, only observation and notes.
What to do when the move has already gone
The smart choice is not "grab at least something".
Better to:
save a screenshot of the move;
mark where the trend started to speed up;
write down whether this symbol was in the plan and why;
prepare a setup for a pullback or the next phase, where entry comes from a level, not from the middle of noise.
Then the missed move turns into material for the system instead of three revenge trades in a row.
A short checklist before pressing the button
Was this symbol in the plan before the run started.
Do I see the exact point where the idea breaks and is the stop parked there.
Is the loss size acceptable if this trade repeats many times.
Can I repeat the same entry one hundred times with the same rules.
If any line sounds weak, skipping this "train" often saves both money and nerves.
The market will send new ones. The task is not to jump into every car, but to board the ones that match the timetable of the trading plan.

World Market Types 1. Stock Markets (Equity Markets)
The stock market is where people buy and sell shares of companies. A share means a small piece of a company.
Why it exists?
Companies need money to grow. They sell shares to the public. In return, investors can make money if the company does well.
Two parts:
Primary Market: Where new shares are first sold (IPO).
Secondary Market: Where old shares are bought and sold between investors.
Examples:
New York Stock Exchange (USA)
London Stock Exchange (UK)
National Stock Exchange (India)
👉 Simple Example: If you buy shares of Apple, you own a very tiny part of Apple.
2. Bond & Debt Markets
Bonds are like loans. Governments and companies borrow money from people. In return, they promise to pay interest.
Why it exists?
To fund big projects (like roads, airports) or business expansion.
Types of Bonds:
Government Bonds (very safe, like U.S. Treasuries).
Corporate Bonds (issued by companies).
Municipal Bonds (issued by cities).
Example: India issues “G-Secs” (Government Securities).
👉 Simple Example: If you buy a bond for ₹1,000, the government will return your money later and give you interest in the meantime.
3. Commodity Markets
Commodities are raw materials like gold, oil, wheat, or coffee.
Two ways to trade:
Spot Market: Immediate buying/selling.
Futures Market: Agreement to buy/sell at a fixed price in the future.
Examples:
Chicago Mercantile Exchange (USA)
Multi Commodity Exchange (India)
👉 Simple Example: A coffee company may buy coffee beans in advance to protect against future price hikes.
4. Foreign Exchange Market (Forex)
The forex market is where currencies are traded. It’s the biggest market in the world, with $7 trillion traded every day.
Why it exists?
For global trade. (India imports oil and pays in USD).
For travel (changing INR to USD or EUR).
For investment and speculation.
Examples: EUR/USD, USD/INR, GBP/USD pairs.
👉 Simple Example: When you travel abroad and exchange rupees for dollars, you are part of the forex market.
5. Derivatives Market
Derivatives are contracts whose value comes from something else (like stocks, gold, or currency).
Types:
Futures
Options
Swaps
Why it exists?
To manage risk.
To make profit through speculation.
👉 Simple Example: An airline can buy a futures contract for oil to protect against rising fuel costs.
6. Real Estate Market
This market is about buying, selling, or renting property (land, houses, offices, malls, factories).
Direct Way: Owning a house or land.
Indirect Way: Investing in REITs (Real Estate Investment Trusts), which let people invest in property without owning it directly.
👉 Simple Example: If you buy a flat in Mumbai, you are part of the real estate market.
7. Cryptocurrency Market
This is a new and fast-growing market. It deals with digital coins like Bitcoin and Ethereum.
Where it happens?
On exchanges like Binance, Coinbase, or decentralized apps (Uniswap).
Why it exists?
People use it for investment.
Some use it for payments.
Others use it for decentralized finance (DeFi).
👉 Simple Example: If you buy Bitcoin on Binance, you are in the crypto market.
8. Primary vs Secondary Markets
Primary Market: New shares/bonds are sold for the first time (IPO).
Secondary Market: Old shares/bonds are traded among investors (stock exchange).
👉 Simple Example: Buying Zomato shares during IPO = Primary. Buying Zomato shares on NSE later = Secondary.
9. Developed, Emerging, and Frontier Markets
Markets are also classified based on the country’s economy.
Developed Markets: Rich, stable, and safe. Examples: USA, UK, Japan.
Emerging Markets: Fast-growing but risky. Examples: India, Brazil, China.
Frontier Markets: Very small, risky, but full of potential. Examples: Vietnam, Nigeria.
👉 Simple Example: Investing in USA is safer, but investing in India may give higher returns.
10. Domestic, International, and Regional Markets
Domestic: Inside one country (NSE India).
International: Across countries (Forex, Eurobond).
Regional: Between groups of countries (EU Single Market, ASEAN).
👉 Simple Example: Trading only in India = Domestic. Trading USD/EUR = International.
11. OTC (Over-the-Counter) vs Exchange-Traded
Exchange-Traded: Official, transparent, with rules (Stock Exchange).
OTC: Directly between two parties, less regulated (Bond and Forex markets).
👉 Simple Example: Buying Reliance shares on NSE = Exchange. A bank selling USD to another bank = OTC.
12. Traditional vs Digital Markets
Traditional Markets: Face-to-face, physical trading pits.
Digital Markets: Online platforms, apps, and blockchain.
👉 Simple Example: Old stock exchanges used hand signals; now trades happen in seconds via computers.
13. Special Market Segments
Insurance Markets: For managing risks (life, health, property).
Carbon Credit Markets: For trading emission rights.
Art & Luxury Markets: Trading in paintings, collectibles, wine, etc.
14. Future of World Markets
Markets are changing fast. Some big trends are:
AI and Algorithmic Trading – Robots and AI make trades in microseconds.
Green & ESG Investing – Investors prefer eco-friendly companies.
Tokenization of Assets – Even property or art can be split into digital tokens.
Central Bank Digital Currencies (CBDCs) – Countries creating digital versions of money.
Conclusion
World markets are the backbone of global trade and investment. From stock markets in New York to commodity markets in Chicago, from bond markets in Europe to crypto markets online, each type of market serves a unique purpose.
Stock markets give companies money and investors ownership.
Bond markets provide loans to governments and companies.
Commodities markets keep global trade flowing.
Forex markets keep international payments possible.
Derivatives markets help manage risks.
Real estate and crypto open new doors for investors.
In simple words: Markets are where the world connects. They decide prices, move money, and drive economies forward.
Role of Imports, Exports, and Tariffs Globally1. Understanding Imports
1.1 Definition and Importance
Imports refer to the goods and services that a country buys from foreign nations. They can include raw materials like crude oil, intermediate goods like steel, or finished consumer products like smartphones and luxury cars.
Imports are vital because no country is self-sufficient in everything. For example:
Japan imports crude oil because it lacks natural reserves.
India imports gold, electronics, and crude oil to meet domestic demand.
The U.S. imports cheap consumer goods from China and agricultural products from Latin America.
1.2 Role of Imports in Development
Imports help countries:
Access resources not available domestically (e.g., oil, rare earth minerals).
Improve quality of life by offering consumer choices.
Boost competitiveness by supplying industries with cheaper or better raw materials.
Promote innovation through exposure to foreign technology.
For example, many developing nations import advanced machinery to modernize their industries, which eventually helps them become competitive exporters.
1.3 Risks and Challenges of Imports
However, heavy reliance on imports can create vulnerabilities:
Trade deficits when imports exceed exports, leading to debt and currency depreciation.
Dependence on foreign suppliers can be risky during geopolitical tensions.
Loss of domestic jobs if foreign goods outcompete local industries.
A classic example is the U.S. steel industry, which suffered from cheap imports from China and other countries.
2. Understanding Exports
2.1 Definition and Importance
Exports are goods and services sold by one country to another. Exports are the lifeline of many economies, especially those with limited domestic markets.
For example:
Germany thrives on exports of automobiles and machinery.
China became the “world’s factory” by exporting electronics, textiles, and manufactured goods.
Middle Eastern countries like Saudi Arabia rely on oil exports for government revenue.
2.2 Role of Exports in Growth
Exports contribute to:
Economic growth by earning foreign exchange.
Employment creation in manufacturing, agriculture, and services.
Technology transfer and skill development.
Trade balance improvement, reducing dependency on foreign debt.
Export-led growth has been a successful model for many Asian economies. South Korea, Taiwan, and later China built their prosperity on robust export sectors.
2.3 Risks and Challenges of Exports
Reliance on exports also carries risks:
Global demand fluctuations can hurt economies. For instance, oil-exporting nations face crises when oil prices fall.
Trade wars and tariffs can reduce access to markets.
Overdependence on one sector creates vulnerability (e.g., Venezuela relying heavily on oil).
3. Tariffs and Their Role in Global Trade
3.1 Definition and Purpose
Tariffs are taxes imposed on imported (and sometimes exported) goods. Governments use them to:
Protect domestic industries from foreign competition.
Generate revenue.
Influence trade balances.
Exercise political or economic leverage.
3.2 Types of Tariffs
Ad valorem tariffs: Percentage of the good’s value.
Specific tariffs: Fixed fee per unit.
Protective tariffs: Designed to shield local industries.
Revenue tariffs: Focused on government income.
3.3 Role of Tariffs in Trade Policy
Tariffs can:
Encourage domestic production by making imports more expensive.
Shape consumer preferences toward local products.
Serve as negotiation tools in international diplomacy.
However, tariffs often lead to trade wars. For example, the U.S.-China trade war (2018–2020) disrupted global supply chains, increased costs for consumers, and created uncertainty in markets.
4. Interconnection of Imports, Exports, and Tariffs
Imports, exports, and tariffs are deeply interconnected. Together they define a country’s trade balance and influence its global economic standing.
Countries that export more than they import run a trade surplus (e.g., Germany, China).
Countries that import more than they export run a trade deficit (e.g., the United States).
Tariffs can alter this balance:
High tariffs discourage imports but can provoke retaliatory tariffs, hurting exports.
Low tariffs encourage open trade but may harm domestic producers.
This interplay is at the heart of trade agreements, disputes, and organizations like the World Trade Organization (WTO).
5. Historical Evolution of Global Trade
5.1 Mercantilism (16th–18th century)
Mercantilist policies emphasized maximizing exports and minimizing imports, with heavy reliance on tariffs. Colonial empires used this strategy to enrich themselves at the expense of colonies.
5.2 Industrial Revolution
Exports of manufactured goods surged from Europe to the world, while colonies provided raw materials. Imports fueled industrial growth, while tariffs protected nascent industries.
5.3 Post-World War II Liberalization
The General Agreement on Tariffs and Trade (GATT) and later the WTO promoted free trade, reducing tariffs globally. Exports and imports flourished, creating the modern era of globalization.
5.4 21st Century Dynamics
Today’s global trade is shaped by:
Free trade agreements (e.g., NAFTA/USMCA, EU Single Market, RCEP).
Trade wars (e.g., U.S.-China).
Strategic tariffs to protect industries (e.g., solar panels, steel, agriculture).
6. Case Studies
6.1 China: Export Powerhouse
China’s rise is a textbook case of export-led growth. By keeping tariffs low, encouraging manufacturing, and integrating into global supply chains, China became the world’s largest exporter. However, its dependence on exports also made it vulnerable to U.S. tariffs in recent years.
6.2 United States: Import-Heavy Economy
The U.S. is the world’s largest importer, relying on foreign goods for consumer demand and industrial inputs. While this supports consumer affordability, it creates persistent trade deficits. The U.S. has used tariffs strategically to protect industries like steel and agriculture.
6.3 European Union: Balanced Trade
The EU maintains both strong exports (cars, pharmaceuticals, machinery) and imports (energy, raw materials). Its single market and common external tariffs demonstrate how regional integration manages trade collectively.
6.4 India: Emerging Economy
India imports heavily (crude oil, electronics, gold) but also pushes exports in IT services, pharmaceuticals, and textiles. Tariffs are frequently used to protect local farmers and small industries.
7. Benefits and Drawbacks of Free Trade vs. Protectionism
7.1 Free Trade Benefits
Efficiency and lower costs.
Greater consumer choices.
Encouragement of innovation.
Economic interdependence, reducing chances of conflict.
7.2 Protectionism Benefits
Protects infant industries.
Safeguards jobs.
Shields strategic sectors (defense, agriculture).
7.3 Risks of Each
Free trade can erode domestic industries.
Protectionism can lead to inefficiency and higher consumer costs.
The balance between these approaches is often contested in politics and economics.
8. Global Organizations and Trade Regulations
WTO: Ensures fair rules and resolves disputes.
IMF and World Bank: Influence trade indirectly through development aid and financial stability.
Regional Trade Blocs: EU, ASEAN, MERCOSUR, RCEP—all shape tariff policies and trade flows.
These organizations seek to balance national interests with global cooperation.
Conclusion
Imports, exports, and tariffs are not just economic mechanisms; they are the foundations of globalization, growth, and international relations. Imports ensure access to essential resources and products, exports drive growth and competitiveness, and tariffs shape the balance between free trade and protectionism.
Their interaction defines trade balances, influences politics, and shapes the destiny of nations. In a world increasingly interconnected yet fraught with geopolitical rivalries, the careful management of imports, exports, and tariffs will remain one of the greatest challenges and opportunities of the 21st century.
Opportunities and Risks in Global MarketsSection 1: Opportunities in Global Markets
1.1 Expansion of International Trade
The lowering of trade barriers and rise of free-trade agreements have created enormous opportunities for companies to reach international consumers. Businesses can:
Diversify revenue sources beyond their domestic markets.
Scale production with access to global demand.
Benefit from competitive advantages like cheaper labor or raw materials in different regions.
For example, Asian electronics manufacturers sell across North America and Europe, while African agricultural producers tap into Middle Eastern and Asian demand.
1.2 Access to Capital Markets
Globalization has enabled firms to tap into international capital markets for funding. Companies can raise money through cross-border IPOs, bond issuances, and venture capital flows. Investors, in turn, gain exposure to high-growth markets like India, Africa, and Southeast Asia.
This cross-border capital flow:
Improves liquidity.
Reduces financing costs.
Helps small and medium enterprises (SMEs) scale faster.
1.3 Technological Innovation and Digital Markets
Technology is perhaps the biggest driver of modern opportunities:
E-commerce platforms like Amazon, Alibaba, and Flipkart have made global consumer bases accessible.
Fintech solutions such as digital payments, blockchain, and decentralized finance (DeFi) have transformed financial inclusion.
Artificial Intelligence (AI) and data analytics allow companies to forecast demand, optimize supply chains, and personalize customer experiences.
Digital markets also open up remote work opportunities, enabling firms to access global talent at lower costs.
1.4 Emerging Market Growth
Emerging economies such as India, Vietnam, Nigeria, and Brazil present massive opportunities due to:
Rising middle-class populations.
Expanding digital infrastructure.
Government reforms promoting business and investment.
These markets often offer higher returns compared to saturated developed economies, though with higher volatility.
1.5 Supply Chain Diversification
Globalization allows firms to diversify production bases. Instead of relying on a single country (e.g., China), companies are adopting a “China + 1” strategy by investing in Vietnam, India, or Mexico. This reduces risks while taking advantage of cost efficiency and new markets.
1.6 Sustainable and Green Finance
The transition to clean energy and sustainability has created a trillion-dollar opportunity. Investors and companies are increasingly focused on:
Renewable energy projects (solar, wind, hydrogen).
Carbon trading markets.
Sustainable investment funds (ESG-focused).
The global push toward net-zero emissions offers growth in sectors like electric vehicles, energy storage, and recycling technologies.
1.7 Cultural Exchange and Global Branding
Brands that succeed globally (Apple, Coca-Cola, Nike, Samsung) benefit from cultural globalization. A global presence not only increases revenues but also strengthens brand equity. Local firms can also “go global” by leveraging cultural exports (e.g., K-pop, Bollywood, anime).
Section 2: Risks in Global Markets
2.1 Economic Risks
Recession and Slowdowns: Global interconnectedness means downturns in one major economy ripple across the world (e.g., the 2008 financial crisis, COVID-19 pandemic).
Currency Volatility: Exchange rate fluctuations can erode profits in cross-border transactions. For instance, a strong U.S. dollar hurts emerging markets with dollar-denominated debt.
Inflation Pressures: Global commodity price spikes (oil, food) affect inflation, reducing purchasing power.
2.2 Geopolitical Risks
Geopolitics plays a decisive role in shaping market risks:
Trade wars (U.S.-China tariffs) disrupt global supply chains.
Sanctions on countries like Russia or Iran limit market access.
Military conflicts destabilize entire regions, raising commodity prices (e.g., oil during Middle East crises).
Nationalism and protectionism are reversing decades of globalization, creating uncertainty for investors.
2.3 Regulatory and Legal Risks
Differences in tax laws, intellectual property rights, and compliance frameworks create legal complexities.
Sudden regulatory changes—like India banning certain apps, or the EU imposing strict data privacy laws (GDPR)—can disrupt global operations.
2.4 Financial Market Volatility
Global markets are vulnerable to shocks from:
Speculative bubbles in stocks, bonds, or cryptocurrencies.
Interest rate hikes by central banks (like the U.S. Federal Reserve), which trigger global capital outflows from emerging markets.
Banking crises, which undermine investor confidence.
2.5 Technological Risks
While technology creates opportunities, it also brings risks:
Cybersecurity threats: Global firms are increasingly targets of hacking, ransomware, and data breaches.
Digital monopolies: A few tech giants dominate markets, creating anti-competitive concerns.
Automation risks: Job displacement caused by robotics and AI could destabilize labor markets.
2.6 Environmental and Climate Risks
Climate change disrupts agricultural production, supply chains, and insurance markets.
Extreme weather events damage infrastructure and raise commodity prices.
Firms face carbon taxation and regulatory costs in transitioning toward sustainability.
2.7 Social and Cultural Risks
Cultural misalignment: Global firms sometimes fail to adapt products to local preferences (e.g., Walmart’s exit from Germany).
Inequality: Globalization can widen the gap between rich and poor, fueling social unrest.
Demographics: Aging populations in developed economies (Japan, Europe) create labor shortages and higher social costs.
Section 3: Balancing Opportunities and Risks
To succeed in global markets, businesses and investors must adopt strategies that maximize opportunities while managing risks.
3.1 Risk Management Strategies
Hedging: Using derivatives to protect against currency and commodity risks.
Diversification: Investing in multiple markets and asset classes to spread risk.
Scenario Planning: Preparing for political, economic, and technological disruptions.
Local Partnerships: Collaborating with local firms to navigate regulations and cultural differences.
3.2 Role of Governments and Institutions
Global governance bodies like WTO, IMF, and World Bank ensure smoother trade and financial stability.
Central banks influence global capital flows through monetary policies.
Regional trade blocs (EU, ASEAN, NAFTA) create stability and cooperation.
3.3 Technological Adaptation
Firms must invest in cybersecurity to safeguard against digital risks.
Adoption of AI and automation should balance efficiency with social responsibility.
Data compliance is essential in markets with strict privacy laws.
3.4 Sustainability as a Competitive Edge
Firms that embrace ESG (Environmental, Social, Governance) principles not only mitigate regulatory risks but also attract investors. Green finance, circular economy practices, and carbon neutrality commitments enhance long-term profitability.
Section 4: Future Outlook
The global market of the next decade will be shaped by megatrends:
Shift of economic power to Asia and Africa – China, India, and Africa will drive consumption growth.
Digital economy dominance – AI, blockchain, metaverse, and fintech will redefine global commerce.
Climate transition economy – Renewable energy, carbon markets, and sustainable finance will become mainstream.
Geopolitical fragmentation – Competing power blocs may create parallel financial and trade systems.
Hybrid supply chains – “Friend-shoring” and regionalization will coexist with globalization.
The winners will be firms and investors who are adaptive, diversified, and innovative.
Conclusion
The global market is a double-edged sword—full of unprecedented opportunities but also fraught with significant risks. Opportunities arise from trade liberalization, digital transformation, emerging markets, and sustainability, while risks emerge from volatility, geopolitical conflicts, regulatory challenges, and climate change.
Ultimately, success in the global marketplace depends on the ability to balance opportunity with risk management. Companies, investors, and governments must act with foresight, agility, and resilience to navigate this ever-changing landscape.
In a hyper-connected world, those who can adapt to technological, economic, and geopolitical shifts will thrive, while those who remain rigid may struggle. Global markets are not just about chasing profits; they are about building sustainable, resilient systems that create long-term value.

Scalping in World Markets1. What is Scalping?
Scalping is a short-term trading style where traders aim to profit from small price fluctuations, typically a few pips in forex, a few cents in stocks, or a few ticks in futures. The average trade duration is extremely short – from a few seconds to a few minutes.
Key characteristics of scalping:
High trade frequency – dozens or even hundreds of trades per day.
Small profit targets – usually 0.1% to 0.5% of price movement.
Tight stop-losses – risk is controlled aggressively.
High leverage usage – to magnify small gains.
Dependence on liquidity and volatility – scalpers thrive in active markets.
2. Scalping in Different World Markets
2.1 Forex Market
The forex market is the most popular for scalping because of its 24/5 availability, tight spreads, and deep liquidity.
Major currency pairs (EUR/USD, GBP/USD, USD/JPY) are preferred for scalping due to minimal spreads.
Forex scalpers often use 1-minute and 5-minute charts to identify quick opportunities.
2.2 Stock Market
Scalping in equities focuses on high-volume stocks like Apple, Tesla, or Amazon.
Traders benefit from intraday volatility and liquidity during opening and closing market hours.
Access to Level 2 order book and Direct Market Access (DMA) is crucial for equity scalpers.
2.3 Futures and Commodities
Futures contracts like S&P 500 E-mini, crude oil, and gold are attractive for scalpers.
Commodity scalping requires understanding of economic reports (EIA crude oil inventory, OPEC meetings).
2.4 Cryptocurrencies
Crypto markets are 24/7, offering endless scalping opportunities.
High volatility and liquidity in coins like Bitcoin and Ethereum make them ideal.
However, high transaction fees and slippage can erode profits.
2.5 Global Indices
Scalpers often trade indices like Dow Jones, FTSE 100, DAX, and Nikkei 225.
Indices react quickly to macroeconomic data, providing fast scalping opportunities.
3. Scalping Strategies in World Markets
3.1 Market Making
Involves placing simultaneous buy and sell orders to profit from the bid-ask spread.
Works best in highly liquid instruments.
3.2 Momentum Scalping
Traders ride micro-trends by entering when momentum surges (e.g., after a breakout).
Useful in fast-moving markets like NASDAQ or forex majors.
3.3 Range Scalping
Scalpers trade within tight support and resistance zones.
Buy near support and sell near resistance repeatedly.
3.4 News-Based Scalping
Focuses on volatility caused by economic releases (CPI, NFP, Fed announcements).
High risk but high reward.
3.5 Algorithmic Scalping
Uses bots to execute trades automatically within milliseconds.
Common in institutional trading with access to co-location servers.
4. Tools and Techniques for Scalping
Trading Platforms – MT4/MT5, NinjaTrader, Thinkorswim, Interactive Brokers.
Charts & Timeframes – 1-minute, 5-minute, tick charts, and order flow charts.
Indicators:
Moving Averages (EMA 9, EMA 21)
Bollinger Bands
RSI (1 or 5 period)
VWAP (Volume Weighted Average Price)
Order Book & Level 2 Data – Helps scalpers see liquidity depth.
Hotkeys & Fast Execution – Essential for entering/exiting trades within seconds.
5. Risk Management in Scalping
Scalping is high-risk due to the large number of trades and leverage. Key risk controls include:
Stop-loss orders – Protect from large losses when price moves unexpectedly.
Position sizing – Never risk more than 1% of account per trade.
Spread & commissions – Monitor closely, as these eat into small profits.
Discipline – Avoid overtrading and revenge trading.
6. Advantages of Scalping
Quick Profits – Immediate feedback from trades.
Less exposure to overnight risk – No swing or position holding.
Works in all market conditions – Volatile, range-bound, or trending.
Compounding effect – Small profits add up across multiple trades.
Psychological satisfaction – For traders who like constant engagement.
7. Challenges of Scalping
High Stress – Requires constant focus and fast decision-making.
Costs – Commissions, spreads, and slippage reduce profitability.
Execution speed – Any delay can wipe out gains.
Broker restrictions – Some brokers prohibit or limit scalping.
Psychological fatigue – Scalping can be mentally exhausting.
8. Psychology of a Scalper
Scalping is not just about technical skills; it demands the right mindset:
Patience and discipline – Avoid chasing trades.
Emotional control – Handle stress and avoid panic decisions.
Consistency – Stick to predefined strategies.
Focus – Ability to concentrate for hours without distraction.
9. Regulations and Global Differences
US Markets: FINRA requires $25,000 minimum for pattern day trading in equities.
European Markets: MiFID II rules on leverage (max 1:30 for retail).
Asian Markets: Japan and Singapore allow high-frequency scalping, but require licensing for institutional scalpers.
Forex Brokers: Some brokers discourage scalping due to server load.
Best Practices for Successful Scalping
Focus on liquid assets.
Keep a trading journal.
Test strategies on demo accounts.
Control emotions and avoid overtrading.
Use technology for execution speed.
Conclusion
Scalping in world markets is one of the most challenging yet rewarding trading approaches. It requires discipline, speed, and precision to consistently extract profits from tiny market movements. While technology and globalization have made scalping more accessible, only traders with the right psychology, tools, and risk management can succeed.
As markets evolve with AI, crypto, and faster infrastructures, scalping will continue to be a dominant force in global trading. For traders who thrive under pressure and enjoy high-frequency engagement, scalping offers unparalleled opportunities – but it demands mastery of both strategy and self-control.

Global Supply Chain Challenges1. Complexity and Interdependence
One of the biggest challenges of global supply chains is their complexity. Unlike traditional domestic supply chains where most processes are localized, global supply chains involve:
Multiple countries producing different components.
Long transportation routes across oceans and continents.
Coordination among suppliers, manufacturers, warehouses, and retailers.
Dependence on international trade regulations and customs.
For instance, a single smartphone may include rare earth minerals from Africa, semiconductors from Taiwan, assembly in China, and distribution worldwide. If one link fails—say, a port strike in the U.S. or a political dispute in Asia—the entire chain suffers delays and shortages.
This high interdependence means companies cannot operate in isolation. A disruption in one country cascades globally, making supply chain resilience a top concern for businesses.
2. Geopolitical Risks
Geopolitical tensions have always influenced global trade, but recent years have seen an escalation in conflicts that directly impact supply chains:
Trade Wars: The U.S.-China trade war led to tariffs on hundreds of billions worth of goods, forcing companies to rethink their sourcing strategies.
Sanctions and Restrictions: Sanctions on countries like Russia and Iran disrupt the supply of vital energy resources and raw materials.
Conflicts and Wars: The Russia-Ukraine war has severely disrupted grain and energy supplies, causing ripple effects worldwide.
Rising Nationalism: Many countries are moving toward “protectionism,” encouraging local manufacturing instead of relying on imports.
These risks make global supply chains unpredictable. Companies are increasingly exploring China+1 strategies (diversifying production beyond China) and regional supply chain models to reduce exposure.
3. Transportation and Logistics Bottlenecks
The efficient movement of goods is critical for supply chains, but several issues plague the global logistics industry:
Port Congestion: Major ports such as Los Angeles, Shanghai, and Rotterdam often face severe backlogs, delaying shipments for weeks.
Container Shortages: The COVID-19 pandemic revealed imbalances in container availability, as containers got stuck in regions with low exports.
Rising Freight Costs: Shipping costs have skyrocketed in recent years, sometimes increasing fivefold, which directly affects product pricing.
Infrastructure Limitations: Developing countries often lack efficient road, rail, and port infrastructure, adding delays.
Disruptions in Key Routes: Blockages like the 2021 Suez Canal crisis showed how a single incident can paralyze global trade.
Logistics providers are adopting digital tracking, automation, and AI-driven route optimization to address these challenges, but the issues remain significant.
4. Climate Change and Natural Disasters
Climate change has emerged as a critical threat to supply chain stability. Extreme weather events disrupt production, transportation, and distribution. Examples include:
Flooding in Thailand (2011) that severely impacted global electronics and automotive supply chains.
Hurricanes in the U.S. causing oil refinery shutdowns and fuel shortages.
Wildfires in Australia and California disrupting agricultural production.
Moreover, climate change brings regulatory challenges. Many countries are now implementing carbon border taxes, demanding cleaner supply chains. Companies must invest in sustainability—using renewable energy, reducing emissions, and adopting circular economy models—while still managing costs.
5. Pandemics and Health Crises
The COVID-19 pandemic exposed the fragility of global supply chains like never before. Lockdowns, labor shortages, and border closures created massive disruptions:
Factories shut down, halting production of critical goods.
Global demand patterns shifted (e.g., rise in demand for PPE and semiconductors).
Transportation capacity was severely limited.
Panic buying and hoarding caused shortages of essentials.
Even post-pandemic, supply chains continue to struggle with aftershocks—semiconductor shortages, rising e-commerce demand, and workforce restructuring. This has led companies to explore resilient supply chain models focusing on agility, redundancy, and digital monitoring.
6. Labor and Workforce Challenges
Global supply chains rely heavily on human labor at every stage—manufacturing, warehousing, shipping, and retail. However, several issues create challenges:
Labor Shortages: Many industries, particularly trucking and shipping, face chronic labor shortages.
Poor Working Conditions: Sweatshops, low wages, and unsafe working environments create ethical concerns.
Union Strikes: Port worker or factory strikes can halt production for weeks.
Skill Gaps: The shift to digital technologies requires skilled workers in areas like data analytics and AI, but there is a global shortage of such talent.
Companies must invest in workforce development, automation, and fair labor practices to ensure long-term stability.
7. Supply Chain Visibility and Transparency
One of the toughest challenges is the lack of visibility across complex supply chains. Many companies only know their first-tier suppliers but have little knowledge of second- or third-tier suppliers. This lack of transparency creates risks in:
Identifying bottlenecks.
Ensuring compliance with regulations.
Tracking unethical practices such as forced labor or environmental harm.
Digital technologies like blockchain, IoT sensors, and AI analytics are increasingly being used to improve visibility and traceability. However, implementing these systems across global networks is expensive and time-consuming.
8. Cybersecurity Risks
As supply chains become digitized, they are also exposed to cyber threats. Cyberattacks on logistics firms, shipping companies, and manufacturers can cripple operations. For example:
The Maersk cyberattack (2017) disrupted global shipping for weeks.
Ransomware attacks on manufacturing plants caused production halts.
Data breaches expose sensitive supplier and customer information.
Securing global supply chains requires strong cybersecurity protocols, international cooperation, and investment in resilient IT systems.
9. Regulatory and Compliance Challenges
Operating across multiple countries means companies must navigate a complex web of laws and regulations:
Customs Regulations: Varying import-export rules increase costs and delays.
Environmental Laws: Stricter sustainability standards demand cleaner processes.
Product Standards: Different countries have different quality and safety requirements.
Data Protection Laws: With digital trade, compliance with laws like GDPR adds complexity.
Failure to comply can result in fines, reputational damage, and disrupted operations.
10. Rising Costs and Inflation
Another major challenge is the rising cost of operating global supply chains:
Raw Materials: Prices of commodities such as oil, metals, and agricultural products fluctuate widely.
Transportation: Higher fuel costs and freight rates directly impact profitability.
Labor Costs: Wages are rising in traditional manufacturing hubs like China, pushing companies to explore alternatives such as Vietnam and India.
Inflation: Global inflation reduces consumer demand, making supply chains less predictable.
Companies are balancing cost efficiency with resilience—sometimes choosing more expensive but reliable regional sourcing models.
Conclusion
Global supply chains are both the strength and vulnerability of the modern economy. While they enable efficiency, affordability, and innovation, they are also highly exposed to risks—geopolitical, environmental, technological, and social. The challenges are vast and interconnected, meaning solutions require not just corporate strategies but also international cooperation, regulatory reforms, and technological innovation.
In the coming decades, the most successful supply chains will be those that balance cost, resilience, and sustainability. They will not just deliver products efficiently but also adapt quickly to disruptions, respect environmental standards, and uphold ethical values. The challenges are immense, but they also offer opportunities to build stronger, smarter, and more sustainable global supply networks.

Role of Shipping & Freight in Global TradeIntroduction
Global trade has been the backbone of the world economy for centuries. The movement of goods across oceans, rivers, and seas has connected civilizations, created wealth, and shaped the geopolitical map. At the center of this massive global exchange lies shipping and freight, the lifelines of international commerce. Without ships transporting raw materials, energy resources, manufactured products, and food across continents, global trade as we know it would come to a standstill.
Today, over 80–90% of world trade by volume and more than 70% by value is carried by sea, according to the International Maritime Organization (IMO). From crude oil tankers supplying energy to container ships delivering electronics, shipping and freight play a pivotal role in ensuring the smooth functioning of supply chains, sustaining industries, and providing consumers worldwide with affordable products.
This essay explores in detail the role of shipping and freight in global trade, its historical evolution, types of shipping services, economic importance, technological advances, environmental challenges, and its future in an interconnected world.
1. Historical Evolution of Shipping in Global Trade
Shipping has been central to human civilization for thousands of years.
a) Ancient Maritime Trade
Phoenicians, Egyptians, Greeks, and Romans used ships to transport goods such as spices, silk, grain, and metals.
Maritime routes like the Mediterranean Sea network and the Indian Ocean trade linked Asia, Africa, and Europe.
The Silk Road by sea connected China with the Middle East and Europe, making maritime trade faster and safer than land routes.
b) Age of Exploration (15th–17th Century)
European powers such as Spain, Portugal, Britain, and the Netherlands developed large fleets to explore and colonize.
Ships carried gold, silver, spices, tea, and slaves, fueling the rise of global empires.
The development of naval power became closely tied to control of trade routes.
c) Industrial Revolution and Modern Shipping
Steamships in the 19th century replaced sailboats, reducing travel time dramatically.
The Suez Canal (1869) and Panama Canal (1914) reshaped global shipping routes, cutting distances between major trade centers.
The 20th century brought containerization (1950s), revolutionizing freight with standardized containers, reducing costs, and enabling modern supply chains.
Shipping thus evolved from simple wooden boats to highly sophisticated mega-ships, forming the backbone of globalization.
2. Types of Shipping & Freight in Global Trade
Shipping today is diverse, with specialized vessels designed to handle different types of cargo.
a) Container Shipping
Most manufactured goods (electronics, clothing, furniture, machinery) are moved in standardized 20-foot and 40-foot containers.
Containerization allows goods to be easily transferred between ships, trucks, and trains.
Major shipping companies like Maersk, MSC, and CMA CGM dominate global container shipping.
b) Bulk Shipping
Dry bulk carriers transport raw materials like coal, iron ore, grain, and fertilizers.
Liquid bulk carriers (tankers) carry oil, LNG (liquefied natural gas), and chemicals.
These ships are vital for energy supply and industrial production.
c) Roll-on/Roll-off (Ro-Ro) Shipping
Used for transporting vehicles, trucks, heavy machinery.
Cars are driven directly onto the ship and off at the destination port.
d) Specialized Freight
Refrigerated ships (reefers) carry perishable goods like fruits, seafood, dairy, and medicines.
Heavy-lift ships transport oversized cargo like wind turbines, oil rigs, and infrastructure equipment.
e) Air Freight vs. Sea Freight
While air freight is faster, it is significantly more expensive.
Sea freight remains the preferred mode for large volumes, bulk cargo, and cost-sensitive goods.
3. Economic Role of Shipping & Freight in Global Trade
Shipping is not just a transport service—it is the foundation of global commerce.
a) Enabler of Globalization
Shipping allows countries to specialize in production, exporting surplus and importing what they lack.
For example, Middle Eastern countries export oil, China exports manufactured goods, and Brazil exports soybeans.
b) Cost-Effective Transportation
Shipping is the cheapest mode of long-distance transport.
Large vessels reduce per-unit transport costs, making global products affordable for consumers.
c) Contribution to Global GDP
The shipping industry contributes over $500 billion annually to global GDP.
Ports, logistics, shipbuilding, and freight services generate millions of jobs worldwide.
d) Strategic Importance
Control over sea lanes translates into geopolitical power.
Disruptions like the Suez Canal blockage (2021) showed how dependent global trade is on maritime routes.
4. Supply Chains & Just-in-Time Trade
Modern trade relies on complex supply chains. Shipping and freight are central to this system.
Just-in-Time (JIT) manufacturing depends on timely delivery of parts from across the world.
Delays in shipping (like during COVID-19) disrupted industries from automobiles to electronics.
Shipping enables global value chains, where production is fragmented across countries.
For example:
iPhones are designed in the U.S., assembled in China, with parts sourced from Japan, Korea, and Germany—made possible by efficient shipping networks.
5. Ports as Trade Hubs
Shipping relies on ports, which act as gateways for trade.
a) Major Global Ports
Shanghai, Singapore, Rotterdam, Dubai, Los Angeles are key global hubs.
Ports provide warehousing, customs clearance, refueling, and transshipment services.
b) Port Infrastructure
Modern ports have automated cranes, container terminals, cold storage, and logistics zones.
Efficient ports reduce turnaround time and lower trade costs.
c) Strategic Chokepoints
The Strait of Hormuz, Strait of Malacca, and Panama Canal are crucial for global shipping.
Blockage or conflict in these areas can disrupt world trade.
6. Challenges Facing Shipping & Freight
While shipping is vital, it faces multiple challenges.
a) Environmental Concerns
Shipping contributes nearly 3% of global CO₂ emissions.
Oil spills, ballast water pollution, and marine waste threaten ecosystems.
b) Piracy & Security
Piracy in the Horn of Africa and South China Sea remains a threat.
Naval patrols and international cooperation are required to safeguard sea lanes.
c) Geopolitical Tensions
Trade wars, sanctions, and conflicts disrupt shipping flows.
Example: Russia-Ukraine war affected grain shipments and energy supplies.
d) Capacity & Congestion
Global ports often face congestion, leading to delays and higher freight rates.
Shortages of containers during COVID-19 caused shipping prices to skyrocket.
e) Rising Costs
Fuel costs (bunker oil), insurance, and regulatory compliance increase freight costs.
7. Technological Innovations in Shipping
Technology is reshaping global shipping.
a) Digitalization
Blockchain and electronic bills of lading improve transparency.
AI and big data optimize routes and reduce delays.
b) Automation & Smart Ports
Automated cranes and digital tracking reduce labor costs.
Smart ports use IoT sensors for efficiency.
c) Green Shipping
LNG-powered ships, hybrid engines, and wind-assisted propulsion reduce emissions.
IMO aims to cut shipping emissions by 50% by 2050.
d) Autonomous Ships
Trials of crewless vessels are underway.
Remote-controlled ships may lower costs and improve safety.
8. Case Studies of Shipping in Global Trade
a) Suez Canal Blockage (2021)
The container ship Ever Given blocked the canal for 6 days.
Delayed $10 billion worth of trade per day.
Highlighted vulnerability of global supply chains.
b) COVID-19 Pandemic
Container shortages, port closures, and demand fluctuations disrupted trade.
Freight rates rose by 4–5 times.
Accelerated digital adoption in shipping.
c) China’s Belt & Road Initiative (BRI)
Development of new ports and maritime routes strengthens global connectivity.
Creates both opportunities and geopolitical tensions.
9. Future of Shipping & Freight in Global Trade
Shipping will remain central to trade, but its role will evolve.
a) Sustainability & Green Transition
Pressure to reduce carbon footprint will drive innovation.
Hydrogen, ammonia, and biofuels may replace conventional fuels.
b) Geopolitical Realignment
Emerging trade corridors (like Arctic routes) will alter global shipping patterns.
Nations will compete to control key ports and sea lanes.
c) Integration with Digital Economy
E-commerce growth demands faster, reliable shipping.
Real-time tracking and AI-driven logistics will dominate.
d) Increased Regionalization
Companies may shorten supply chains to reduce dependency on long-distance shipping.
Yet, maritime trade will remain irreplaceable for bulk goods.
Conclusion
The role of shipping and freight in global trade cannot be overstated. From ancient maritime exchanges to today’s interconnected world economy, ships have carried the raw materials, energy, and finished goods that power industries and sustain societies. Shipping ensures global availability of resources, low-cost consumer goods, and functioning supply chains.
At the same time, shipping faces challenges such as environmental sustainability, geopolitical tensions, and technological disruption. However, with continued innovation, regulatory support, and international cooperation, shipping will remain the lifeline of global trade for decades to come.
As the world moves toward greener, smarter, and more resilient trade systems, the shipping industry will continue to be the bridge between nations, economies, and people, cementing its place as the true engine of globalization.
Impact of Trade Wars on Global CommoditiesUnderstanding Trade Wars
Definition
A trade war occurs when countries engage in escalating retaliatory trade barriers, such as tariffs (taxes on imports), export bans, or quotas. Unlike routine trade disputes resolved through institutions like the World Trade Organization (WTO), trade wars are prolonged confrontations that can severely disrupt global supply chains.
Causes of Trade Wars
Protection of domestic industries – Governments impose tariffs to shield local producers from cheaper foreign imports.
Geopolitical tensions – Strategic rivalry between powers (e.g., U.S.–China).
Perceived unfair trade practices – Accusations of currency manipulation, dumping, or intellectual property theft.
Political populism – Leaders appeal to domestic audiences by promising to revive manufacturing or agriculture.
Mechanisms of Impact
Trade wars affect commodities through:
Tariffs: Increasing the cost of imports reduces demand.
Supply chain disruptions: Restrictions create shortages or gluts in certain markets.
Currency fluctuations: Retaliatory measures often cause volatility in exchange rates.
Investor sentiment: Commodities markets react to uncertainty with price swings.
Historical Trade Wars and Commodities Impact
The U.S.–China Trade War (2018–2020)
The most notable recent example is the U.S.–China trade war, where both nations imposed tariffs on billions of dollars’ worth of goods. Its impact on commodities was profound:
Agricultural Products: China, a major buyer of U.S. soybeans, shifted its purchases to Brazil and Argentina. U.S. farmers faced significant losses, while South American exporters gained.
Metals: U.S. tariffs on Chinese steel and aluminum disrupted global metals supply, increasing costs for downstream industries.
Oil and Gas: China reduced imports of U.S. crude oil, turning to Russia and the Middle East instead.
1970s Oil Crisis and Resource Nationalism
While not a conventional “trade war,” the OPEC oil embargo of 1973 illustrates how commodity trade restrictions can destabilize global markets. By restricting oil exports, OPEC caused a dramatic rise in crude oil prices, triggering global inflation and recessions.
Japan–U.S. Trade Disputes (1980s–1990s)
The U.S. imposed restrictions on Japanese automobiles, semiconductors, and steel. While not as aggressive as the China case, it influenced global steel and automotive commodity supply chains.
Impact on Different Commodities
1. Agricultural Commodities
Trade wars hit agriculture hardest because food products are politically sensitive and heavily traded.
Soybeans: In the U.S.–China conflict, soybean exports from the U.S. plummeted by over 50% in 2018. Brazil emerged as the biggest beneficiary.
Wheat and Corn: Farmers faced surplus production when markets closed, leading to lower farm incomes.
Meat and Dairy: Tariffs on pork and beef reduced demand, leading to oversupply and lower domestic prices.
Key Point: Agricultural producers in exporting countries often lose, while rival exporters in neutral countries gain market share.
2. Energy Commodities
Energy is both a strategic and economic commodity. Trade wars disrupt supply chains and create uncertainty.
Crude Oil: During the U.S.–China dispute, China reduced U.S. crude imports. Instead, it boosted imports from Russia, reshaping global oil flows.
Liquefied Natural Gas (LNG): China, a top LNG importer, reduced its contracts with U.S. suppliers, affecting American energy exports.
Coal: Tariffs on coal imports can shift demand toward domestic suppliers, though with environmental consequences.
Result: Trade wars encourage diversification of energy suppliers, altering global energy geopolitics.
3. Metals and Minerals
Metals are essential inputs for manufacturing and construction. Tariffs in this sector ripple across industries.
Steel and Aluminum: U.S. tariffs in 2018 raised global prices temporarily, hurting consumers (e.g., automakers) but boosting U.S. domestic producers.
Copper: As a key industrial metal, copper prices fell due to weaker global demand expectations from trade wars.
Rare Earth Elements: China, controlling over 80% of rare earth supply, threatened export restrictions during tensions—causing panic in tech and defense industries.
Observation: Strategic metals become bargaining chips in geopolitical disputes.
4. Precious Metals
Gold, silver, and platinum group metals behave differently in trade wars:
Gold: Seen as a “safe haven,” gold prices typically rise during trade war uncertainty. Example: Gold surged during U.S.–China tensions.
Silver and Platinum: Both industrial and investment commodities, they experience mixed effects—falling demand from industries but rising investor interest.
Economic Consequences of Commodity Disruptions
For Producers
Loss of export markets (e.g., U.S. soybean farmers).
Price crashes in domestic markets due to oversupply.
Increased costs if reliant on imported raw materials.
For Consumers
Higher prices for finished goods (e.g., cars with more expensive steel).
Reduced availability of certain products.
Inflationary pressures in commodity-importing nations.
For Global Markets
Increased volatility in commodity exchanges (CME, LME).
Shifts in global trade flows, creating winners and losers.
Distortion of investment decisions in commodities futures markets.
Case Studies
Case Study 1: U.S. Soybean Farmers
When China imposed tariffs on U.S. soybeans, American farmers saw exports fall from $12 billion in 2017 to $3 billion in 2018. Despite government subsidies, many small farmers struggled. Brazil, however, expanded its exports to China, reshaping global agricultural trade.
Case Study 2: Steel Tariffs and the U.S. Auto Industry
The Trump administration’s tariffs on steel and aluminum in 2018 increased input costs for U.S. automakers. While domestic steel producers benefited, car manufacturers faced rising costs, reducing their global competitiveness.
Case Study 3: Rare Earths and Tech Industry
China’s threat to restrict rare earth exports during trade tensions with the U.S. in 2019 raised concerns for tech manufacturers, as rare earths are critical for smartphones, batteries, and defense equipment. Prices surged globally, forcing nations to seek alternative suppliers.
Long-Term Structural Shifts
Trade wars don’t just have short-term impacts; they reshape global commodity systems.
Diversification of Supply Chains
Importers diversify sources to reduce dependence on hostile nations. Example: China diversifying soybean imports beyond the U.S.
Rise of Regional Trade Blocs
Countries form regional agreements (e.g., RCEP, USMCA) to secure commodity flows.
Strategic Stockpiling
Nations build reserves of critical commodities (oil, rare earths, grains) to withstand disruptions.
Technological Substitution
Trade wars accelerate R&D in substitutes (e.g., battery technologies reducing dependence on cobalt).
Shift in Investment Flows
Investors prefer politically stable commodity suppliers, leading to long-term realignments.
Winners and Losers
Winners
Neutral exporting countries that capture lost market share (e.g., Brazil in soybeans).
Domestic producers shielded by tariffs (e.g., U.S. steel).
Investors in safe-haven commodities like gold.
Losers
Farmers and exporters in targeted nations.
Consumers facing higher prices.
Global growth, as uncertainty reduces trade volumes and investment.
Future Outlook
Increasing Commodities Nationalism
Countries may increasingly weaponize commodities as tools of leverage in geopolitical disputes.
Technology and Substitutes
Trade wars may accelerate innovation, such as renewable energy reducing reliance on imported fossil fuels.
Institutional Reforms
The WTO and other institutions may need reforms to mediate commodity-related disputes more effectively.
Climate Change Factor
As climate change reshapes commodity production (e.g., agriculture, water, energy), trade wars could worsen resource scarcity and volatility.
Conclusion
The impact of trade wars on global commodities is multi-dimensional and far-reaching. From agriculture to energy, metals to precious resources, trade disputes disrupt flows, distort prices, and realign global supply chains. While some nations or industries benefit temporarily, the broader effect is one of uncertainty, inefficiency, and economic loss.
In the long run, trade wars reshape the architecture of commodity markets—encouraging diversification, regionalism, and innovation. However, they also raise questions about the sustainability of globalization and the ability of international institutions to maintain stability in a fracturing world.
Ultimately, commodities—being the backbone of human survival and industrial growth—remain at the heart of trade wars. Understanding their dynamics is crucial not only for policymakers and businesses but also for ordinary citizens whose livelihoods are directly or indirectly tied to global trade.
Food Security & Global Market PricesIntroduction
Food is the most fundamental human need, yet in the 21st century, billions of people still struggle with hunger, malnutrition, and unstable food access. At the same time, global markets heavily influence the price and availability of food commodities such as wheat, rice, corn, soybeans, and edible oils. The link between food security and global market prices has become one of the defining challenges of our era.
Food security, as defined by the Food and Agriculture Organization (FAO), exists when all people, at all times, have physical, social, and economic access to sufficient, safe, and nutritious food to meet their dietary needs and food preferences for an active and healthy life. Achieving this requires stability in production, affordability of prices, resilience against shocks, and equitable distribution.
Global market prices, meanwhile, are shaped by international trade, supply-demand balances, speculation in commodity markets, climate events, geopolitical conflicts, and policy decisions such as subsidies or export bans. When prices spike, food insecurity rises—especially in poorer countries where households spend a large share of their income on food.
This essay explores the intricate relationship between food security and global market prices, examining causes, consequences, and policy responses.
Section 1: Understanding Food Security
Food security rests on four pillars:
Availability – Adequate supply of food from domestic production or imports.
Access – Economic and physical access, meaning people can afford and obtain food.
Utilization – Proper nutrition, safety, and absorption of food in the body.
Stability – Reliable supply and access over time, without major disruptions.
Food insecurity emerges when any of these pillars is weak. For instance:
A drought may reduce availability.
Rising global prices can weaken access.
Poor sanitation or lack of dietary diversity can affect utilization.
Wars, conflicts, or pandemics disrupt stability.
Section 2: The Role of Global Market Prices in Food Security
Global markets set benchmarks for staple foods. Prices in Chicago, Paris, or Singapore often determine what wheat, rice, or soybeans cost in Africa, South Asia, or Latin America.
Why Prices Matter for Food Security
High Prices = More Hunger
When global food prices rise, poorer households reduce consumption or switch to less nutritious diets.
FAO estimates that the 2007–08 food price crisis pushed more than 100 million people into hunger.
Low Prices = Farmer Distress
While high prices hurt consumers, very low prices can harm small farmers, reducing their incomes and discouraging future production.
This creates a cycle of poverty, migration, and reduced agricultural investment.
Price Volatility
Unpredictable swings are as harmful as high prices. Farmers cannot plan their crops, governments struggle with food subsidy budgets, and traders hoard supplies, worsening instability.
Section 3: Historical Food Price Crises
1. The 1970s Oil Shock & Food Prices
Oil price hikes raised fertilizer, transport, and irrigation costs, driving global food inflation.
2. 2007–2008 Global Food Price Crisis
Wheat, rice, and maize prices doubled or tripled due to biofuel demand, export bans, and speculation.
Riots broke out in more than 30 countries, including Haiti, Egypt, and Bangladesh.
3. 2010–2011 Price Surge (Arab Spring Trigger)
Poor harvests in Russia and Ukraine, coupled with droughts, drove wheat prices higher.
Food inflation was a key factor fueling protests in Tunisia, Egypt, and across the Arab world.
4. COVID-19 Pandemic (2020–2022)
Supply chain disruptions, export restrictions, and labor shortages pushed food prices up.
Millions of urban poor in developing countries were hit hardest.
5. Russia–Ukraine War (2022–present)
Ukraine and Russia supply 30% of global wheat exports, 20% of maize, and 75% of sunflower oil.
The war disrupted Black Sea trade routes, triggering a surge in global grain prices.
Section 4: Key Drivers of Global Market Prices
Supply & Demand Imbalances
Rising demand for meat (China, India) increases feed grain demand.
Population growth (expected to reach 10 billion by 2050) pressures supplies.
Climate Change & Extreme Weather
Droughts in Africa, floods in South Asia, and wildfires in North America reduce output.
El Niño and La Niña cycles influence rainfall and crop yields globally.
Energy Prices
Oil prices affect fertilizer, irrigation, and transport costs.
Biofuel policies (e.g., ethanol in the US, biodiesel in Europe) divert grains from food to fuel.
Trade Policies
Export bans (India on rice, Russia on wheat) reduce global supply and spike prices.
Import tariffs and quotas distort markets further.
Speculation & Financialization of Commodities
Hedge funds and institutional investors increasingly trade food futures.
While providing liquidity, speculation can amplify price swings.
Geopolitical Conflicts & Wars
War zones reduce production (Ukraine) or block exports.
Sanctions can disrupt fertilizer supplies (Russia-Belarus potash).
Section 5: Food Security Challenges in Different Regions
Africa
Heavy reliance on imported wheat and rice.
Vulnerable to global price shocks due to weak currencies.
Climate shocks (drought in Horn of Africa) worsen hunger.
Asia
India: major producer but also restricts exports during inflation.
China: massive food demand, maintains large reserves.
Southeast Asia: rice-dependent economies vulnerable to export bans.
Middle East & North Africa (MENA)
Highly import-dependent (over 50% of food).
Price shocks linked to political unrest (Arab Spring).
Latin America
A food-exporting region (Brazil, Argentina) but faces domestic food inflation.
Export crops often prioritized over local food needs.
Developed Countries
More resilient due to subsidies and safety nets.
Still vulnerable to rising food inflation, affecting lower-income households.
Section 6: Consequences of Rising Food Prices
Hunger & Malnutrition
Poor families spend 50–70% of income on food.
Rising prices mean reduced meals, more stunting in children.
Social Unrest & Political Instability
Food riots, protests, and revolutions often follow price spikes.
Economic Strain on Governments
Higher subsidy bills (India’s food subsidy crosses billions annually).
Pressure on foreign reserves for food-importing countries.
Migration & Refugee Crises
Hunger drives rural-to-urban migration and cross-border displacement.
Section 7: Policy Responses to Balance Food Security & Prices
Global Cooperation
WTO rules to prevent arbitrary export bans.
FAO-led initiatives for transparency in food markets.
National Policies
Price stabilization funds and buffer stocks.
Social safety nets: food stamps, cash transfers, subsidized food.
Investment in Agriculture
Modern farming, irrigation, storage, and logistics.
Encouraging climate-resilient crops.
Sustainable Practices
Reduce food waste (1/3 of global food is wasted).
Diversify crops to reduce reliance on wheat/rice/maize.
Regional Food Reserves
ASEAN rice reserve mechanism.
African Union initiatives for emergency grain stocks.
Private Sector & Technology
Precision farming, AI-driven yield forecasts.
E-commerce platforms improving farmer-market linkages.
Section 8: The Future – Can We Ensure Food Security Amid Price Volatility?
By 2050, food demand will rise by 60–70%.
Climate change could reduce yields by 10–25% in some regions.
Global interdependence means local crises (Ukraine war, Indian export bans) ripple worldwide.
The challenge is balancing farmer incomes, consumer affordability, and global stability.
Promising solutions include:
Climate-smart agriculture.
International grain reserves.
Digital platforms for real-time price transparency.
Stronger trade cooperation and less protectionism.
Conclusion
Food security is deeply tied to global market prices. When markets are stable and predictable, people eat well, farmers earn fair incomes, and societies remain peaceful. But when prices spike due to conflict, climate change, or speculation, millions are pushed into hunger and political instability rises.
The future demands a balanced approach—ensuring affordable food for consumers, fair returns for farmers, and resilience in supply chains. Global cooperation, sustainable practices, and smart technology will be central to ensuring that food security is not left hostage to market volatility.
In short: food is not just a commodity—it is a foundation of human survival, dignity, and global stability.

Global Economic Recessions & RecoveriesPart 1: What is a Global Economic Recession?
Definition
A recession is generally defined as a significant decline in economic activity lasting for a prolonged period, typically identified by two consecutive quarters of negative GDP growth. At the global level, a recession occurs when world output, trade, and employment collectively decline.
But beyond technical definitions, recessions are felt in real life:
Jobs become scarce.
Wages stagnate.
Businesses close.
Governments face reduced tax revenues.
Investors witness stock market downturns.
Features of a Recession
Falling GDP – Global production and services shrink.
Rising Unemployment – Companies lay off workers.
Decline in Trade – Imports and exports fall as demand weakens.
Stock Market Weakness – Investors flee risky assets.
Banking Stress – Credit availability shrinks.
Part 2: Causes of Global Recessions
Recessions can stem from multiple factors, often overlapping:
Financial Crises
Example: The 2008 Global Financial Crisis caused by housing bubbles and excessive leverage in banks.
Policy Errors
Excessively tight monetary policy can choke growth.
Overly aggressive taxation or austerity can reduce demand.
External Shocks
Oil price spikes (1973 Oil Shock).
Wars or geopolitical tensions.
Natural disasters or pandemics (COVID-19).
Speculative Bubbles Bursting
Dot-com bubble (2000).
Cryptocurrency market collapses (2022).
Structural Imbalances
High sovereign debt.
Trade imbalances between nations.
Part 3: Impact of Global Recessions
Recessions are not just economic phenomena—they touch every aspect of human life.
On Individuals
Job losses and wage cuts.
Higher cost of living due to inflation in essentials.
Reduced access to credit.
Mental health stress due to financial uncertainty.
On Businesses
Lower consumer demand.
Rising defaults and bankruptcies.
Reduced investments in innovation and expansion.
On Governments
Lower tax revenues.
Increased welfare spending (unemployment benefits, subsidies).
Rising fiscal deficits.
On Global Trade
Decline in exports and imports.
Shipping, aviation, and logistics industries suffer.
Emerging markets depending on global demand face deep contractions.
Part 4: Historical Global Recessions
1. The Great Depression (1929–1939)
Trigger: US stock market crash in 1929.
Impact: 25% unemployment in the US, collapse of world trade, rise of protectionism.
Lessons: Importance of financial regulation and global cooperation.
2. The Oil Crisis Recession (1973–1975)
Trigger: OPEC oil embargo, quadrupling oil prices.
Impact: High inflation (stagflation), economic slowdown in the West.
Lessons: Vulnerability of economies to energy shocks.
3. The Asian Financial Crisis (1997–1998)
Trigger: Collapse of Thai baht, spreading currency crises across Asia.
Impact: Severe recessions in South Korea, Indonesia, and Malaysia.
Lessons: Risks of excessive foreign debt and weak financial systems.
4. The Global Financial Crisis (2008–2009)
Trigger: Subprime mortgage meltdown, Lehman Brothers collapse.
Impact: Deep recession in US & Europe, contagion worldwide.
Lessons: Need for stricter financial regulations and coordinated stimulus.
5. COVID-19 Recession (2020)
Trigger: Global lockdowns, supply chain breakdowns.
Impact: Largest contraction since WWII, record unemployment.
Lessons: Importance of healthcare resilience and digital infrastructure.
Part 5: Mechanisms of Economic Recovery
Recovery is the phase where the economy rebounds from recession toward growth.
Types of Recovery Shapes
V-Shaped – Sharp fall, quick rebound (COVID-19 recovery in some nations).
U-Shaped – Slow bottoming out, then recovery.
W-Shaped (Double-dip) – Recovery followed by another recession.
L-Shaped – Prolonged stagnation (Japan in the 1990s).
Drivers of Recovery
Government Stimulus – Fiscal spending and tax cuts.
Monetary Easing – Central banks lowering interest rates and buying assets.
Innovation & Productivity – New technologies boosting efficiency.
Global Trade Growth – Rebound in demand for exports and imports.
Consumer Confidence – Households resuming spending.
Part 6: Role of Global Institutions
Organizations play vital roles in stabilizing and guiding recoveries:
IMF (International Monetary Fund) – Provides emergency loans and financial advice.
World Bank – Funds infrastructure and poverty alleviation.
WTO (World Trade Organization) – Ensures smooth global trade.
G20 – Coordinates global economic policies.
Part 7: Challenges in Modern Recoveries
High Debt Levels – Countries borrow heavily during recessions, making recovery harder.
Income Inequality – Recoveries often benefit the wealthy more than workers.
Climate Change Risks – Natural disasters and transition to green energy impact growth.
Geopolitical Tensions – Trade wars, sanctions, and conflicts hinder global cooperation.
Technological Disruptions – Automation may delay job recoveries.
Part 8: Strategies for Strong Recoveries
Balanced Policy Mix
Combine fiscal stimulus with responsible monetary policy.
Investment in Infrastructure
Creates jobs and boosts long-term productivity.
Support for SMEs
Small businesses often generate the most jobs.
Green & Sustainable Growth
Renewable energy and climate-friendly projects.
Strengthening Global Cooperation
Joint efforts on trade, health, and finance.
Part 9: Future Outlook of Global Recessions & Recoveries
Digital Transformation – Technology will play a central role in recoveries.
Decoupling Trends – Some countries reducing dependency on global supply chains.
Demographics – Aging populations in developed nations may slow recoveries.
Emerging Economies – India, Southeast Asia, and Africa may drive global growth.
Resilience Building – More focus on healthcare, energy independence, and financial safety nets.
Conclusion
Global recessions and recoveries are not isolated events—they are part of an ongoing cycle in the world economy. Each downturn brings hardships, but also opportunities to reform, innovate, and build resilience.
The history of past crises shows that while recessions are painful, recoveries can set the stage for long periods of prosperity if managed wisely. The key lies in global cooperation, responsible policymaking, and adaptability.
Currency Markets (Forex) & Exchange Rate DynamicsIntroduction
Money is the lifeblood of trade. Just as people in different regions use different languages, nations around the world use different currencies. While within a country people exchange goods and services using their national currency (like Rupee in India, Dollar in the US, Yen in Japan, or Euro in Europe), when trade crosses borders, there arises a need to exchange one currency for another. This mechanism, in which currencies are bought, sold, and exchanged at agreed prices, is called the foreign exchange market (Forex or FX).
The currency market is the largest and most liquid financial market in the world. Every single day, more than $7.5 trillion (as of 2024 estimates) worth of currencies change hands globally—far exceeding daily trading in stocks, bonds, or commodities. Forex is the invisible backbone of international trade, investment, tourism, remittances, and even geopolitics.
This essay will explore the structure of currency markets, the participants, instruments, and mechanics of trading, and then dive deep into exchange rate dynamics—the forces that determine why one currency strengthens or weakens against another.
1. What is the Currency Market (Forex)?
The foreign exchange market (Forex) is a decentralized global marketplace where currencies are traded. Unlike stock exchanges, which operate in specific locations (like NYSE or NSE), Forex is an over-the-counter (OTC) market, meaning that trading happens electronically between banks, brokers, corporations, and individuals worldwide, 24 hours a day, five days a week.
Key features of Forex:
24-hour market: Opens on Monday in Asia (Sydney/Tokyo) and runs through Europe (London) until Friday evening in the US (New York).
Decentralized structure: No single exchange; transactions occur via electronic networks and interbank systems.
High liquidity: With trillions traded daily, currency can be bought/sold almost instantly.
Leverage-driven: Traders often borrow to increase exposure, which magnifies both profits and risks.
Relative value trading: In Forex, one never buys a currency in isolation—it’s always traded against another (e.g., EUR/USD, USD/INR).
2. Why is Forex Important?
The currency market is not just a playground for speculators—it has deep real-world importance:
International Trade & Investment – Exporters and importers depend on Forex to convert earnings. Example: An Indian IT company earning in dollars must convert to rupees to pay local salaries.
Tourism & Travel – A traveler from India to Europe needs Euros, while a European visiting India needs Rupees.
Foreign Direct Investment (FDI) – When companies invest abroad, they convert currencies (e.g., a Japanese firm investing in the US needs dollars).
Remittances – Millions of migrant workers send money home, creating huge Forex flows.
Central Banks & Governments – They intervene in currency markets to stabilize their economies.
Financial Trading & Hedging – Hedge funds, banks, and retail traders seek profits or risk protection by betting on currency movements.
3. Structure of the Forex Market
The Forex market has multiple layers and participants:
(A) Interbank Market
The top level, where large international banks (JPMorgan, Citi, Deutsche Bank, HSBC, etc.) trade billions daily.
Provides liquidity and sets global benchmark rates.
(B) Corporates & Multinationals
Companies engaged in cross-border trade or investment.
Example: A US car company importing parts from Japan needs Yen.
(C) Central Banks & Governments
They buy/sell currencies to manage exchange rates, stabilize economies, and control inflation.
Example: Reserve Bank of India intervening to prevent sharp INR depreciation.
(D) Institutional Investors & Funds
Hedge funds, mutual funds, pension funds speculate or hedge exposures.
(E) Retail Traders
Individuals trading via brokers/platforms. Growing rapidly due to online apps.
Though small compared to banks, retail adds significant market activity.
4. Types of Forex Transactions
Currency trading can be classified by settlement timing and purpose:
Spot Market
Immediate exchange of currencies (settled in 2 business days).
Most visible and liquid segment.
Forward Market
Agreement to exchange currencies at a future date at a pre-agreed rate.
Used by businesses to hedge risks (e.g., an Indian importer locking USD/INR rate for future payment).
Futures & Options (Derivatives)
Standardized contracts traded on exchanges.
Used by traders and funds for speculation or hedging.
Swap Agreements
Two parties exchange currencies temporarily and reverse the deal later.
Often used by banks for liquidity management.
5. Major Currency Pairs
Currencies are quoted in pairs, where one is the base currency and the other is the quote currency.
Major Pairs (involving USD, highly liquid):
EUR/USD (Euro vs Dollar)
GBP/USD (British Pound vs Dollar)
USD/JPY (Dollar vs Yen)
USD/CHF (Dollar vs Swiss Franc)
Minor Pairs (crosses without USD):
EUR/GBP, EUR/JPY, GBP/JPY
Exotic Pairs (developed vs emerging currencies):
USD/INR (Dollar vs Rupee)
USD/BRL (Dollar vs Brazilian Real)
6. Exchange Rate Dynamics – How Currency Values are Determined
At the heart of Forex lies the exchange rate: the price of one currency in terms of another.
Example: 1 USD = 83 INR means 1 US Dollar costs 83 Indian Rupees.
But why does it fluctuate daily? Multiple forces shape exchange rates:
(A) Supply and Demand
If demand for dollars rises (e.g., due to higher imports or capital outflows from India), USD/INR rises (rupee weakens).
Conversely, strong FDI inflows increase rupee demand, strengthening INR.
(B) Interest Rate Differentials
Currencies of countries offering higher interest rates attract investors seeking better returns.
Example: If RBI keeps rates higher than the US Fed, foreign investors may buy Indian bonds, increasing INR demand.
(C) Inflation Levels
Countries with lower inflation usually see stronger currencies, as purchasing power remains stable.
High inflation erodes currency value. Example: Argentina’s peso depreciates sharply due to hyperinflation.
(D) Economic Growth & Trade Balance
Strong GDP growth attracts foreign capital, boosting currency.
A trade surplus strengthens currency (exports > imports), while deficits weaken it.
(E) Political Stability & Governance
Investors prefer stable democracies with strong rule of law.
Political crises, wars, or corruption scandals often trigger capital flight.
(F) Speculation & Market Sentiment
Traders bet on future currency directions. If markets believe the rupee will weaken, speculative selling accelerates the move.
(G) Central Bank Intervention
Central banks directly buy/sell currencies or adjust interest rates to stabilize their currency.
Example: Bank of Japan often intervenes to prevent excessive Yen appreciation.
7. Exchange Rate Systems
Throughout history, different systems have been used to manage currency values:
Fixed Exchange Rate – Currency pegged to gold or another currency (e.g., USD pegged to gold under Bretton Woods until 1971).
Floating Exchange Rate – Market forces determine value (used by US, EU, UK, Japan).
Managed Float – Central bank intervenes occasionally (India, China).
Currency Pegs – Some countries peg to USD (Saudi Riyal, Hong Kong Dollar).
8. Volatility in Forex
Forex is highly volatile—daily fluctuations create both risks and opportunities.
Example: Brexit referendum (2016) caused GBP/USD to crash overnight.
Global crises (COVID-19, Russia-Ukraine war) often trigger “flight to safety,” strengthening USD as investors rush to safe-haven assets.
9. Risks in Currency Markets
Exchange Rate Risk – Loss from adverse moves in rates.
Interest Rate Risk – Changes in rates affect currency value.
Liquidity Risk – Exotic currencies may have wider spreads.
Political/Geopolitical Risk – Wars, sanctions, coups affect currency flows.
Speculative Risk – Leverage magnifies losses.
10. Case Studies of Exchange Rate Dynamics
(A) USD-INR
Over decades, INR has depreciated from 1 USD = 7 INR (1970s) to ~83 INR (2025) due to inflation differentials, trade deficits, and dollar strength.
RBI actively manages volatility via interventions.
(B) Japanese Yen (JPY)
Known as a funding currency due to ultra-low interest rates.
Often used in “carry trades”—borrowing Yen cheaply and investing in higher-yielding assets elsewhere.
(C) Euro (EUR)
World’s second-most traded currency.
Dynamics depend on the Eurozone economy—if Germany faces slowdown, Euro weakens.
Conclusion
The currency market (Forex) is the invisible giant powering the global economy. It ensures that trade, investment, tourism, and remittances flow smoothly across borders. Its exchange rate dynamics reflect a complex interplay of economics, politics, psychology, and speculation.
For businesses, policymakers, and investors, understanding Forex is crucial—because a small change in exchange rates can alter profits, trigger inflation, or shake entire economies.
As the world moves toward digital money, AI-driven trading, and multipolar currency systems, the future of Forex will be even more dynamic and unpredictable. Yet one thing is certain: as long as nations exist with different currencies, Forex will remain the beating heart of global finance.
Short Selling & Market Volatility WorldwideIntroduction
Financial markets thrive on a balance between optimism and skepticism. While investors who buy assets express confidence in growth, those who sell short represent a contrasting, yet equally vital, belief system. Short selling refers to the practice of selling borrowed securities with the expectation that their price will fall, enabling the seller to buy them back later at a lower price for a profit. Though often controversial, short selling is deeply embedded in the functioning of global financial markets.
On the other hand, market volatility refers to the speed and magnitude of changes in asset prices, reflecting uncertainty, investor sentiment, and macroeconomic conditions. Both concepts are closely interlinked: short selling can amplify volatility, while volatile conditions often fuel short-selling opportunities.
Globally, regulators, institutional investors, and policymakers debate whether short selling destabilizes markets or provides healthy skepticism that enhances efficiency. This discussion has become more critical after episodes like the 2008 Global Financial Crisis, the 2020 COVID-19 crash, and retail-driven short squeezes like GameStop in 2021.
This paper explores the mechanisms, history, controversies, regulatory frameworks, and global impacts of short selling, along with its deep connection to market volatility.
1. Understanding Short Selling
1.1 The Mechanics of Short Selling
The process of short selling involves several steps:
Borrowing the asset: A short seller borrows shares (or other securities) from a broker.
Selling in the open market: The borrowed securities are sold at the prevailing market price.
Repurchasing (covering the short): Later, the seller buys back the same quantity of shares, ideally at a lower price.
Returning the shares: The borrowed securities are returned to the lender, and the difference between the selling and repurchasing price becomes the short seller’s profit (or loss).
For example, if a trader sells borrowed shares of Company X at ₹1,000 each and repurchases them later at ₹800, the profit per share is ₹200 (excluding fees and borrowing costs).
1.2 Types of Short Selling
Naked Short Selling: Selling shares that have not been borrowed beforehand (often restricted).
Covered Short Selling: Selling shares that have already been borrowed (legal and widely practiced).
Synthetic Shorts: Using derivatives like options and futures to replicate short exposure.
1.3 Motivations Behind Short Selling
Profit-seeking: Traders speculate on price declines.
Hedging: Institutions use short positions to protect long portfolios.
Arbitrage: Exploiting mispricings in related securities.
Market correction: Identifying overvalued companies or fraudulent firms.
2. Market Volatility: A Global Phenomenon
2.1 Defining Volatility
Volatility measures the variability of asset returns, often expressed through standard deviation or implied volatility indices (e.g., VIX in the US, India VIX).
Historical Volatility: Based on past price movements.
Implied Volatility: Derived from option prices, reflecting market expectations.
2.2 Drivers of Volatility
Macroeconomic factors: Inflation, interest rates, GDP growth.
Political & geopolitical events: Elections, wars, trade tensions.
Corporate events: Earnings surprises, fraud revelations, mergers.
Market psychology: Fear and greed cycles.
Liquidity shocks: Sudden shortages or surges in capital flows.
2.3 Measuring Volatility Across the World
US: CBOE Volatility Index (VIX), often called the “fear gauge.”
India: NSE’s India VIX.
Europe: VSTOXX index.
Japan: Nikkei Volatility Index.
Volatility has universal dimensions but varies in intensity across emerging vs. developed markets.
3. The Interplay Between Short Selling & Volatility
3.1 Short Selling as a Source of Volatility
Downward pressure: Aggressive shorting can accelerate sell-offs.
Panic amplification: Retail investors may overreact to visible short interest.
Short squeezes: When heavily shorted stocks rise sharply, short sellers rush to cover, creating upward volatility.
3.2 Short Selling as a Dampener of Volatility
Price discovery: Shorts expose overvaluation and fraud, preventing bubbles.
Liquidity enhancement: Short sellers add trading volume, reducing bid-ask spreads.
Market efficiency: They ensure both positive and negative information is reflected in prices.
Thus, short selling has a dual effect: it can either stabilize by correcting mispricings or destabilize by triggering rapid sell-offs.
4. Historical Case Studies
4.1 The Great Depression (1929)
Short sellers were widely blamed for accelerating the market crash, leading to restrictions and the introduction of the Uptick Rule in the US (1938).
4.2 The Global Financial Crisis (2008)
Amid Lehman Brothers’ collapse, regulators worldwide banned or restricted short selling to prevent systemic risk. Critics argue these bans reduced liquidity and delayed price corrections.
4.3 European Debt Crisis (2010–2012)
Countries like Spain, Italy, and Greece banned short selling during sovereign debt fears. However, studies later showed such bans were ineffective in calming markets.
4.4 COVID-19 Market Crash (2020)
Volatility surged globally. Several European countries, India, and others imposed temporary short-selling restrictions, though the US refrained. Markets eventually recovered, highlighting that volatility stemmed more from uncertainty than short sellers.
4.5 GameStop Short Squeeze (2021)
A unique retail-driven rebellion where Reddit’s WallStreetBets community targeted heavily shorted stocks like GameStop and AMC. The short squeeze led to extreme volatility, losses for hedge funds, and debates about transparency in short selling.
5. Global Regulatory Perspectives
5.1 United States
Regulated by the SEC.
Uptick Rule (1938–2007): Allowed short selling only at higher prices than previous trades.
Alternative Uptick Rule (2010): Restricts shorting when a stock falls 10%+ in a day.
Transparency: Short interest data is disclosed biweekly.
5.2 Europe
European Securities and Markets Authority (ESMA) coordinates rules.
Transparency requirements: Large short positions must be disclosed publicly.
Temporary bans are common during crises.
5.3 Asia
Japan: Longstanding short-sale disclosure rules.
India: Short selling allowed with restrictions; naked shorting is prohibited. Stock lending & borrowing (SLB) mechanism facilitates covered shorts.
China: Very restrictive, viewing short selling as destabilizing.
5.4 Emerging Markets
Regulations often stricter due to concerns about volatility and investor confidence. Many nations restrict short selling during market stress.
6. The Ethical & Controversial Side
6.1 Criticisms of Short Selling
Seen as betting against success of companies.
Can exacerbate panic during downturns.
Potential for abusive practices, such as spreading false rumors (short-and-distort).
6.2 Defense of Short Selling
Vital for price discovery.
Helps identify fraudulent companies (e.g., Enron, Wirecard, Luckin Coffee).
Encourages transparency and corporate accountability.
6.3 Public Perception
Retail investors often view short sellers negatively, especially when firms collapse. Yet institutional investors appreciate their role in balancing optimism with caution.
7. Short Selling, Technology, and the Future
7.1 Algorithmic & High-Frequency Shorting
Algorithms execute rapid-fire shorts based on news, price movements, or arbitrage.
Concerns exist about flash crashes and heightened volatility.
7.2 Role of Social Media
Platforms like Reddit, Twitter (X), and Discord amplify sentiment.
Retail coordination can now challenge institutional short sellers.
7.3 Crypto Markets
Short selling extends to Bitcoin and altcoins via futures and perpetual swaps.
Volatility in crypto is often more extreme than in traditional markets.
7.4 ESG & Ethical Investing
Debates arise whether short selling aligns with sustainable finance principles. Some argue it deters harmful companies; others view it as destructive speculation.
8. Short Selling in Different Market Structures
8.1 Developed Markets (US, UK, EU, Japan)
Deep liquidity supports active short selling.
Transparency rules balance risks.
8.2 Emerging Markets (India, Brazil, South Africa)
Lower liquidity makes volatility concerns greater.
Short selling often tightly regulated.
8.3 Frontier Markets
Limited short-selling infrastructure due to lack of stock-lending systems.
Volatility often driven by macro shocks, not short activity.
9. Empirical Research on Short Selling & Volatility
Studies suggest short selling increases intraday volatility but contributes to long-term price efficiency.
Short-sale bans during crises reduce liquidity and increase spreads, worsening volatility rather than containing it.
Transparency of short positions has a calming effect, as investors better understand bearish sentiment.
10. Policy Recommendations
Maintain transparency: Public disclosure of short positions helps reduce rumor-driven panic.
Avoid blanket bans: Evidence shows bans worsen liquidity and delay corrections.
Encourage stock-lending markets: Well-functioning lending systems reduce settlement risk.
Balance retail vs. institutional interests: Retail investors need education to understand short selling rather than fear it.
Global harmonization: Given interconnected markets, international coordination is vital during crises.
Conclusion
Short selling and market volatility are inseparable components of the financial ecosystem. While short selling often attracts controversy, it remains a critical tool for liquidity, hedging, and price discovery. Global evidence shows that volatility is not inherently caused by short sellers but by broader uncertainty and structural imbalances.
Regulators face the delicate task of balancing market stability with efficiency. A world without short selling would risk bubbles, fraud, and illiquidity. Conversely, unchecked shorting could fuel panic. The challenge is to create transparent, fair, and robust systems where skepticism and optimism coexist.
As financial markets evolve—with technology, retail participation, and new asset classes like crypto—the role of short selling in shaping volatility will continue to grow. Rather than vilifying it, policymakers and investors must acknowledge its dual nature: both a source of turbulence and a guardian of truth in markets worldwide.

Healthcare & Pharma StocksIntroduction
Healthcare and pharmaceutical (pharma) stocks represent one of the most vital and resilient segments of global equity markets. Unlike cyclical sectors such as automobiles or real estate, healthcare is a necessity-driven industry—people require medical care, medicines, and treatments regardless of economic ups and downs. This inherent demand creates a unique investment landscape where growth, stability, and innovation intersect.
Pharma and healthcare stocks include a wide variety of companies—ranging from multinational giants like Pfizer, Johnson & Johnson, and Novartis to Indian leaders such as Sun Pharma, Dr. Reddy’s Laboratories, and Cipla. The sector also encompasses hospitals, diagnostic chains, biotech innovators, medical device manufacturers, and health-tech startups.
This write-up provides a deep 360-degree analysis of healthcare & pharma stocks, covering their structure, business drivers, global trends, risks, opportunities, and investment strategies.
1. Structure of Healthcare & Pharma Sector
The healthcare & pharma ecosystem can be broadly divided into:
A. Pharmaceuticals
Generic drugs: Off-patent medicines manufactured at lower costs. (e.g., Sun Pharma, Teva)
Branded drugs: Patented products with high margins. (e.g., Pfizer, Novartis)
Active Pharmaceutical Ingredients (APIs): Raw drug materials, where India and China dominate.
Contract Research & Manufacturing Services (CRAMS): Outsourcing R&D and manufacturing.
B. Biotechnology
Companies focused on genetic engineering, cell therapies, and monoclonal antibodies.
High-risk but high-reward investments (e.g., Moderna, Biocon).
C. Hospitals & Healthcare Services
Hospital chains (Apollo, Fortis, Max Healthcare).
Diagnostics (Dr. Lal PathLabs, Metropolis, Thyrocare).
Health insurance companies.
D. Medical Devices & Technology
Imaging equipment, surgical tools, wearables (Medtronic, Siemens Healthineers).
Digital health platforms and telemedicine providers.
E. Global vs. Domestic Markets
Global players dominate innovation-driven drug discovery.
Indian players dominate generics, APIs, and affordable healthcare solutions.
2. Key Growth Drivers
A. Rising Global Healthcare Spending
Worldwide healthcare spending is projected to cross $10 trillion by 2030.
Ageing populations in developed nations and increasing middle-class healthcare demand in emerging economies fuel growth.
B. Lifestyle Diseases
Diabetes, hypertension, cardiovascular disorders, and obesity are increasing.
Continuous demand for chronic therapy drugs.
C. Patents & Innovation
Innovative drugs with patent protection ensure high profit margins.
Pipeline of oncology, rare disease, and immunology drugs is expanding.
D. COVID-19 Acceleration
Pandemic showcased the sector’s importance.
Vaccine manufacturers, diagnostics, and hospital chains saw exponential growth.
E. Government Policies & Healthcare Access
India’s Ayushman Bharat scheme, US Medicare expansion, and Europe’s universal healthcare systems are pushing accessibility.
F. Digital Transformation
Telemedicine, AI-based diagnostics, robotic surgeries, and wearable devices.
Creates new sub-segments for investors.
3. Risks & Challenges
A. Regulatory Risks
FDA (US), EMA (Europe), and CDSCO (India) have stringent regulations.
Compliance failures lead to import bans, plant shutdowns, and fines.
B. Patent Expirations
Blockbuster drugs lose exclusivity after 10–15 years.
Leads to generic competition and margin erosion.
C. Pricing Pressure
Governments cap drug prices to maintain affordability.
Generic drug prices are constantly under pressure.
D. R&D Uncertainty
Only 1 in 10,000 drug molecules successfully reaches the market.
High R&D costs with uncertain returns.
E. Geopolitical & Supply Chain Issues
China controls key raw materials (APIs).
Any disruption impacts global supply.
4. Global Leaders in Healthcare & Pharma
A. Pharma Giants
Pfizer (US): COVID-19 vaccine, oncology, cardiovascular drugs.
Johnson & Johnson (US): Diversified pharma, medical devices, consumer healthcare.
Novartis (Switzerland): Oncology, gene therapy.
Roche (Switzerland): Diagnostics and cancer treatments.
AstraZeneca (UK): Cardiovascular and respiratory therapies.
B. Biotechnology Leaders
Moderna & BioNTech: mRNA vaccine technology.
Gilead Sciences: HIV and hepatitis treatments.
Amgen: Biologic drugs.
C. Indian Leaders
Sun Pharma: Largest Indian pharma company, strong in generics.
Dr. Reddy’s: APIs, generics, biosimilars.
Cipla: Strong in respiratory segment.
Biocon: Pioneer in biosimilars.
Apollo Hospitals: Leading hospital chain.
Metropolis & Dr. Lal PathLabs: Diagnostics leaders.
5. Market Trends
A. Consolidation & M&A
Big pharma acquiring biotech startups.
Indian firms expanding globally via acquisitions.
B. Biosimilars & Biologics
Biologics (complex drugs made from living organisms) are the future.
Biosimilars (generic versions of biologics) gaining ground after patent expiry.
C. Personalized Medicine
Genetic testing enables customized treatments.
Oncology leading the way.
D. Artificial Intelligence in Drug Discovery
AI reduces time and costs in clinical trials.
Companies like Exscientia and BenevolentAI working with pharma giants.
E. Medical Tourism
India, Thailand, and Singapore attract patients globally due to cost advantage.
Growth in hospital and diagnostic sector.
6. Investment Perspective
A. Defensive Nature
Healthcare is non-cyclical—stable demand even in recessions.
Acts as a hedge in uncertain markets.
B. Growth Potential
Emerging markets like India offer double-digit growth.
Biotech and innovation-driven companies can deliver multibagger returns.
C. Dividends & Stability
Big pharma firms are cash-rich and provide regular dividends.
Stable revenue models for hospitals and insurers.
D. Valuation Metrics
Investors should analyze:
R&D pipeline: Future drug launches.
Regulatory compliance: FDA approvals, audits.
Debt levels & cash flow: Capital-intensive sector.
Market presence: US, Europe, and India exposure.
7. Indian Market Outlook
Pharma exports: India supplies 20% of global generics by volume.
Domestic healthcare: Rising insurance penetration and government spending.
Diagnostics: High growth with preventive healthcare awareness.
Hospital chains: Consolidation and increasing private equity investments.
API manufacturing push: Government incentives to reduce dependency on China.
8. Future Opportunities
Gene Therapy & CRISPR: Revolutionary treatments for genetic disorders.
mRNA Technology: Beyond vaccines, applicable in cancer therapies.
Wearable Health Tech: Smartwatches, glucose monitors, cardiac sensors.
Telemedicine: Remote healthcare becoming mainstream.
AI in Healthcare: Faster drug discovery, predictive healthcare analytics.
9. Risks for Investors
Litigation Risks: Patent disputes, product liability lawsuits.
Currency Fluctuations: Export-driven Indian pharma firms face forex risk.
Competition: Generic wars in the US and EU.
Policy Shifts: Government price controls can reduce profitability.
10. Investment Strategies
A. Long-Term Play
Biotech & R&D-driven pharma are long-term investments (10–15 years).
Examples: Biocon, Moderna, Roche.
B. Defensive Allocation
Hospitals, insurance, and generic pharma are safer bets for portfolio stability.
C. Thematic Investing
Focus on oncology, biosimilars, digital health, or telemedicine themes.
D. Diversification
Spread across global pharma (Pfizer, J&J), Indian generics (Sun, Cipla), and hospitals (Apollo, Fortis).
Conclusion
Healthcare & pharma stocks represent a unique mix of stability, growth, and innovation. The sector is driven by non-cyclical demand, global healthcare spending, lifestyle diseases, and constant innovation in biotechnology. At the same time, it faces challenges like regulatory hurdles, pricing pressures, and patent expirations.
For investors, healthcare and pharma provide defensive positioning in uncertain times and long-term multibagger opportunities in high-growth biotech and digital health. In India, the sector is set to grow rapidly with rising domestic demand, government support, and increasing global market share.
In essence, investing in healthcare & pharma stocks is not just about chasing profits—it is about betting on the future of human health and well-being.

GBPUSD SELL 100 PIPS LIVE TRADE AND BREAKDOWN GBP/USD retests the 1.2870 zone, or two-week lows
The Greenback's upside impulse is now gathering extra steam and motivates GBP/USD to recede to the area of new two-week troughs around 1.2870.

Pattern and Structure This image provides a visual guide to key chart patterns and market structures in Forex trading. It emphasizes the importance of understanding how these patterns form and how price action influences market movements. The chart showcases several common patterns:
1. Bearish Channel: Traders are advised to buy at the retest after a breakout from the channel.
2. Double Bottom: This reversal pattern suggests buying after the confirmation of the second bottom or the breakout.
3. Rising Wedge: A bearish continuation pattern where selling is recommended after a breakout.
4. Flag Pattern: This continuation pattern typically occurs after a strong price move. The image suggests buying after the breakout.
5. Inverted Head and Shoulders (H&S): A reversal pattern signaling a potential bullish move, with a buying opportunity after the breakout.
6. Symmetrical Triangle: This pattern can break either way, but the focus is on buying at the retest after an upward breakout.
The psychological level plays a significant role, as it represents critical zones where market sentiment often shifts. The chart encourages re-entry after successful retests in bullish patterns. This comprehensive structure helps traders enhance their technical analysis skills and make informed decisions.
