BTC - Predicting Scalps with Order Blocks Here’s another practical example of “Will Bitcoin Move Up or Down?”
Will Bitcoin Move up or down from 108,500?
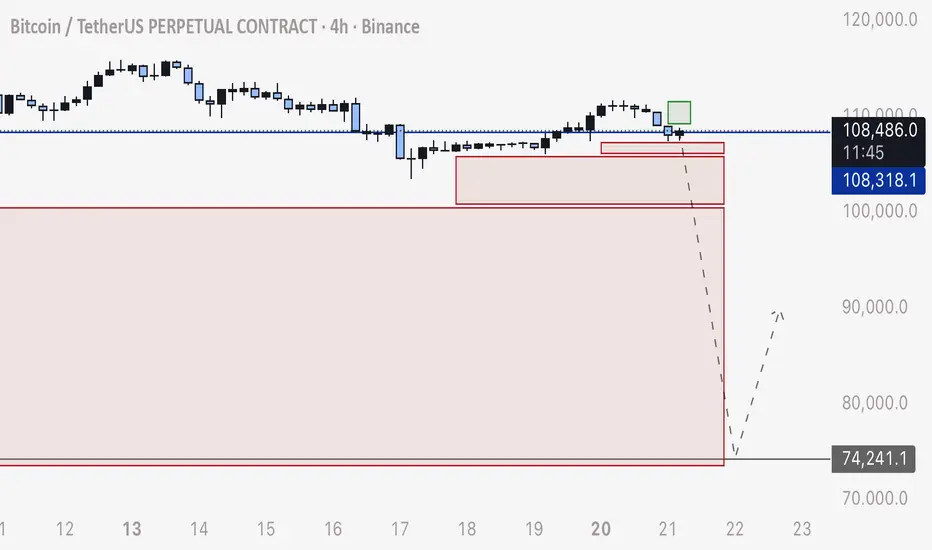
In this example we will be taking a trade from the consolidation point of 108,500
In my previous posts I’ve taught you how to draw order blocks of stop loss orders and use them to predict movement. We draw green boxes for BUY orders ABOVE price and red boxes for SELL orders BELOW price.
Note how this is opposite to how we are told to look at charts - with limit buys below and limit sells above. Stop Loss orders only full when price crosses the level and buys are above, sells are below.
In this example we will factor in Consolidation Time / Duration to predict price.
Although there are significant gaps of short stop losses above, the time of consolidation that collects the long stop loss orders is much larger in duration.
I’ve drawn the boxes here in widths to show length of time price has consolidated to attract these orders. The more time in consolidation without a recovery of these order blocks, the more orders are accumulated and therefor more buying or selling power.
Because there are much more long stop loss orders accumulated:
Bitcoin will DROP from 108,500 and we can set a take profit on the short at the end of this order block range at 78,000
Lesson
Using DXY to Predict Manipulation on BitcoinIn this post it’s important to view and relate to the linked, related idea called “DXY - Major Breakdown of Ascending Channel”
I’ll keep this short and to the point since we are actively in the war zone now.
1. Identify major patterns or structure shifts on DXY. For 8 years I’ve used these same ascending channel supports on DXY and it’s made very clear this is the way it trades, as we can duplicate the line angle and move it near infinitely to any area and see how price respects it.
2. Identify major DXY events in relation to the DXY pivot. In this case, we are witnessing a bearish retest of a major bearish signal.
3. Understand what it all means. DXY falling / correcting for 4-7 years translates to BULL MARKET of the same duration on stocks, equities, and securities.
Now you may be thinking - “Okay but that means, Bitcoin will go up then?”
WRONG
The reason is, Bitcoin and Crypto is a manipulated game and it’s all rigged and intentional.
What does this really mean then?
4. If we will see a natural bullish trend on Bitcoin for the next 4-7 years, that means the market makers want their money back. Since Bitcoin has been only moving up since late 2022, this has set up a massive chain reaction of long stop losses / sell orders, paving a path to these lower zones on my BTC chart. What this should tell you is - FLASH CRASH COMING. Manipulated crash before the true bull run.
Now you may be wondering - “No way, the world would have to see an apocalypse for 8,000 to be hit”
WRONG
Stop loss orders are in place already as a natural consequence of traders decisions over the last 3+ years. These are sell orders. Once these sell orders start filling, bitcoin will see an automatic wick down to these low levels. No active selling is required, and therefor no black swan required.
Now - If DXY was retesting a bullish pattern, I’d be longing as that signals extended bear market.
And rest assured - THIS MARKET IS ALL MANIPULATION.
We can use DXY to predict the trigger of it all.
Happy trading.
- DD
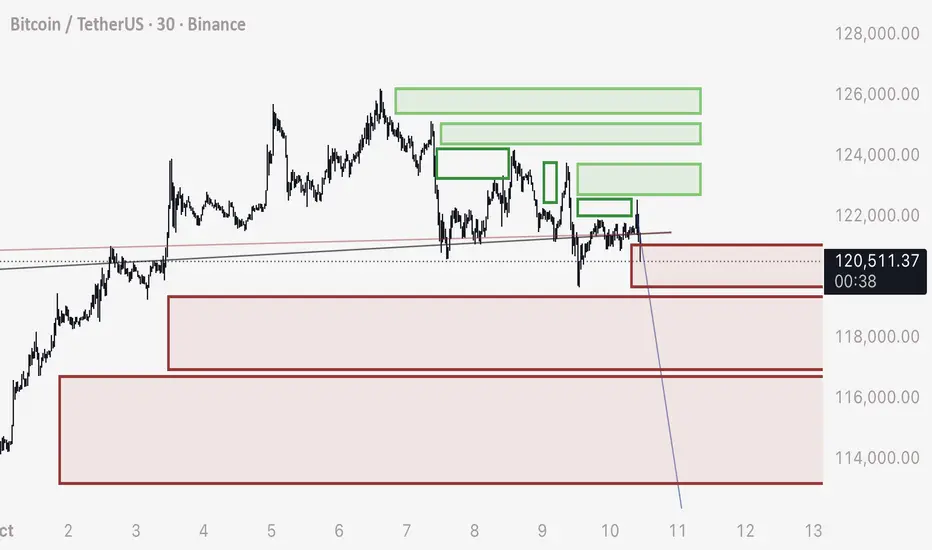
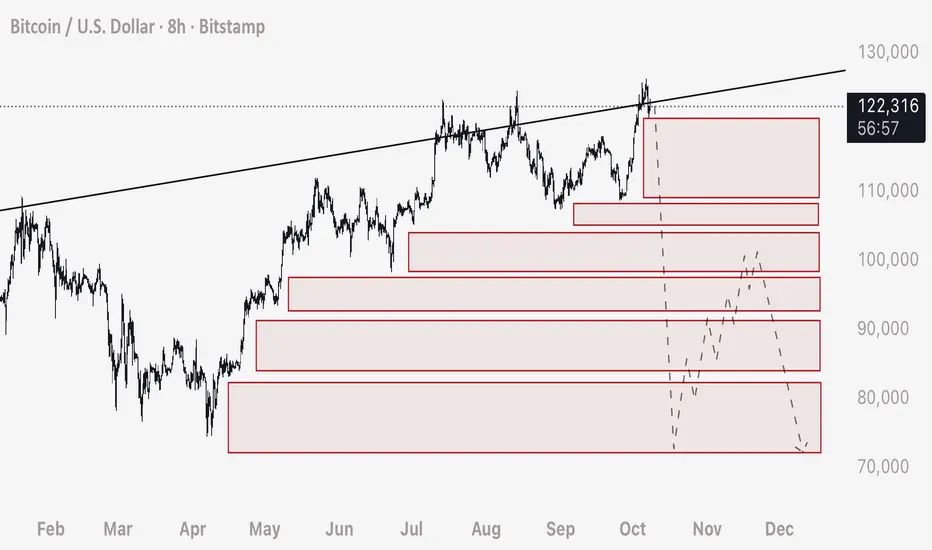
BTC - Use Order Blocks to Predict if Price with move UP OR DOWNI will give a practical demonstration here on how to draw your own order blocks and heat maps to predict if price will move up or down from this 121,400 current level.
First understand that stop loss order blocks are opposite to what we have learned as traders.
We are told that buy orders are below price (limit buys) and sell orders are above us (limit sells).
The truth of Bitcoin however is the exact opposite is true. The stop loss orders carry much more power than limit orders, as they are filled for the “whole leveraged position size”, not for only the margin used.
While limit buys will automatically fill if price is below that price, or limit sells will automatically fill if price is above that price - this is not true for stop loss orders or liquidation orders.
Stop Losses and Liquidations only FILL if price CROSSES the level.
This means we can use order blocks from open candle sets, extended out past price currently, to understand where these gaps of orders are located.
Green boxes for BUYS above price.
Red boxes for SELLS below price.
When price enters into these boxes zones, these orders will start filling - acting as a type of propellant that’s implanted in the chart from traders previous choices. This creates “wicks” and fast movements.
WILL PRICE GO UP OR DOWN FROM 21,400?
In this example from 121,400 I drew both long stops and sell stops.
The emptied green boxes have already been reclaimed. The filled in green boxes are left unreclaimed and contain these orders.
For price to go up, it would have to move past the previous wick, and enter into these zones - which have a significant gap in between them.
For price to DROP, we can look at the boxes of long stops or sell orders.
Note that these order blocks are neatly placed one after the next, with no significant gaps between them.
Therefor, there is much better odds of price dropping from 121,400 - entering into these sell order blocks, and naturally dropping as those orders are filled one into the other.
It would be a good day trade strategy to SHORT the 121,400 level, and expect the price to move down through these blocks.
It would be a bad day trade strategy to LONG the 121,400, as the orders are very few compared to the downside, therefor, lower odds.
This is really the only strategy you need to scalp trades on Bitcoin and predict where price is going.
If you find these helpful, please let me know below.
Yours truly,
- DD
Result - Using Order Blocks to Predict Bitcoins MovementHere is the result from our first practical demonstration of the effectiveness of using order blocks (stop loss orders) and liquidity analysis to predict price movement on BTC.
Both the upwards movement and downward moment was able to be predicted with absolute accuracy.
I hope this result serves as proof for my thesis:
What moves Bitcoin is Stop Loss and Liquidation orders, which can be analyzed by looking back at open candles and length of consolidation to predict speed.
And
There is no market manipulation other than price being CONTROLLED to attract positions to be opened and consequently stop loss orders. Fast, sudden movements are a natural phenomenon caused by traders stop losses triggering into one another. Traders manipulate themselves.
I have applied this to two more examples on the higher time frames. And as those complete they will be reviewed.
PLEASE SEE ORIGINAL IDEA LINKED BELOW AS WELL AS OTHER PLANS AND IDEAS RELATED.
Any questions please comment below.
Using Order Blocks to Predict Price Movement on HTFExpanding on my previous post, we can apply this technique to predict price movement on the higher time frames (8 Hour in this case).
Step 1 - Drawing the Boxes
- Fundamentally what we want to do, is look at the price movement and figure out where clusters of stop loss would be contained.
- To do this, we want to look for the areas of upwards (in this example) consolidation that hasn’t dropped down to trigger the orders.
- I have drawn boxes here close to the candle set, and extended them out past where price currently is to prove that these areas have not been reclaimed or had the stop loss orders triggered.
PLEASE NOTE: Stop Loss orders and Liquidation Orders are very unique. Unlike limit orders that will automatically fill if price is above or below, these orders do not fill unless price CROSSES the exact price of the order. In essence, it’s important to understand that looking back on the chart we can understand there are limit orders for sells (in this example) that’s below the current price. If a limit sell order was to be placed at a lower price, it would fill automatically if price is above.
- We can anticipate a take profit (locally in this example) at 74,000. SHORT entry should be where the orders begin to set off to a large degree, in this example, entry would be BELOW where price currently is, at 122,200. We want to make sure that the stop loss orders will be enough to carry the price through these blocks. Stop loss can be places above the local wick high (where the SHORT stop losses have already been filled) at 123,900.
Step 2 - Predicting and Understanding Wick Speed
- To predict how fast the movement will complete, we need only evaluate the amount of TIME allowed for positions to be placed (longs in this example). Very simply because the more time provided to traders in an upwards consolidation, the more positions and consequently stop losses and liquidations will be placed below the price.
- More TIME = More Orders = Faster Wick Speed. To understand this another way, imagine there was 2 scenarios where regular limit buys were placed. Scenario 1 has 100 people placing buy orders, Scenario 2 has 10,000 people placing buy orders. Scenario 2 would move price higher at a faster speed, and to a greater distance. In other words we are predicting VOLUME of STOP LOSS ORDERS.
PLEASE NOTE: Stop Loss orders move price at a greater volume compared to the position entry. If Trader A uses $1,000 to open a Long, and uses a leverage of 10x - his Stop Loss or Liquidation order is to close the entire leveraged position size. While he is injecting $1,000 of liquidity into the market with his order, he is consequently leaving a sell order underneath his entry for $10,000 (leveraged position size).
PLEASE NOTE: The placement and amounts contained in stop losses or liquidations are not available to the public. Exchanges do not need to disclose that information, and you can assume it’s only shared with the market makers or liquidity providers. Heatmap Platforms such as Coinglass have disclaimers that state it’s not based on true date and is only a prediction.
SUMMARY:
I hope this serves you with a practical demonstration of how we can use Stop Loss analysis to predict price movement.
I also hope that you can understand you’re able to do this yourself by developing the vision to quickly see it in the chart. We are blessed in that we simply need to look backwards to see where we will be going next, as the orders that move Bitcoin are previously embedded in the chart.
Yours truly and all the best,
- DD
If you have any questions or want further clarifications - please ask in the comments and I will answer you.
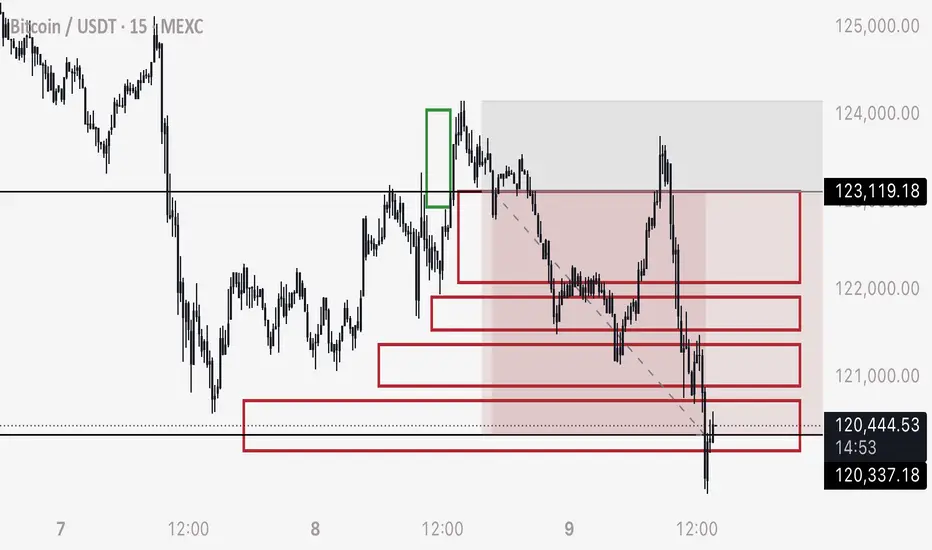
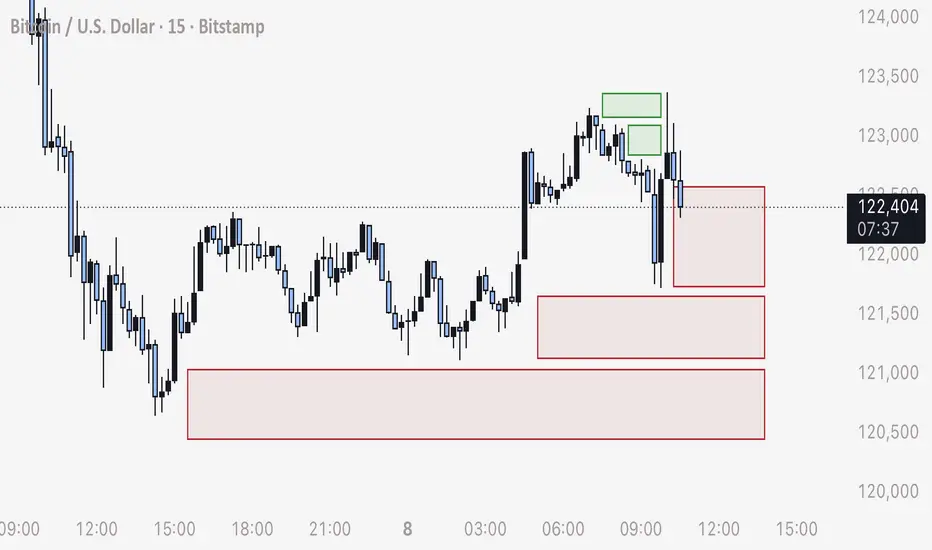
BTC - Practical Example of Trading Order Blocks / Stop HuntsHere is a very practical, recent example of trading the reaction of BTC hitting stop loss order blocks and how price moves.
Green Boxes:
- Note that price moves in a slow, downwards consolidation
- This slow drop allowed time for traders to enter shorts, consequently leaving stop loss orders for the entire position size
- The price movement when these cascading blocks of orders are triggered always moves exponentially faster than the consolidation. Slower the move in a direction = faster the wick in the opposite direction. More orders ( buys or sells ) equals greater speed and distance.
- These orders being triggered (stop losses and liquidations) trump any pattern, support or resistance. It all becomes irrelevant as the order chains will always execute and set off, ignoring any technical pattern.
Predicting this Wick to 123,300:
- Notice the downwards consolidation followed by a faster drop in the end.
- Price quickly moved higher
- From this point we can anticipate that the high leverage stop loss orders for shorts will be triggered, at this point you can scalp a long, take profit slightly above where the consolidation started.
Red Boxes:
- The red boxes are sell orders created from long positions being opened and consequently their stop loss and liquidation orders
- Mark and extend boxes from the open zones that price has not reclaimed
- When price moves down low enough, to start filling these sell orders, you may short to slightly below the beginning of the upwards consolidation
- I’d anticipate when price moves below 122,200, that’s when the wick will form and land at a minimum of 120,100 (if not setting off more sell orders as we look at higher time frames than the 15 M)
- Looking at the slowness and time allowed for the upwards consolidation, we can anticipate a larger amount of longs have been opened, and this can be translated to an increased speed of a wick down and faster movement.
In Summary:
I hope this serves you as a good, practical example of the method of trading stop losses hunts and order blocks, which in my experience is the only reliable way to predict the price of Bitcoin.
Yours truly,
- DD
BTC - How Manipulation Works and How to Detect It I subscribe to premium solely for the multi second time frames, time frames that you may think are useless.
What if I told you this is the ONLY true way to detect manipulation?
HOW MANIPULATION WORKS
It’s a lot more subtle than you think.
The main driver of what moves the price of Bitcoin is the adverse orders from derivatives and leveraged positions. These orders being stop loss orders and liquidation orders.
In essence, it’s traders own decisions and orders, that cause price to move in an opposite direction.
You may have heard people say “Do the Opposite” or “Contrarian Trader”. What they mean is, the market seems to move in the opposite direction as the majority sentiment. Even the fear and greed index is used to convey this principal.
However there’s a true and technical way of understanding this.
As bitcoins price moves and consolidates SLOWLY and STEADILY in one direction, this extended period of time allows traders to enter leveraged positions in that same direction that’s moving price slowly up or slowly down.
Consequently, these trades are leaving opposite direction orders of a larger magnitude, such as stop loss orders for the “entire leveraged position size”. For example, Trader Bob uses $100 to inject liquidity into a long position, and opts to use 80x because of his confidence in Bitcoin moving up. Trader Bob then sets a stop loss order which “sells” his position and closes 100% of his leveraged position size. Trader Bob sets BELOW the current price a sell order for $8,000 - 80x his original $100 injected.
MANIPULATION comes in two distinct parts.
1) Price is held stable, to ACCUMULATE and ATTRACT more of the orders (long or short) - which the market makers and exchanges know is ACTUALLY creating more propellant and energy that will move price in the opposite way.
As an example, if Bitcoin is at 100,000 and the market makers and exchanges know there’s a mass amount of liquidity to reclaim at 80,000 - they will do a series of manipulations to get price to that level.
A) They will hold price steady while looking like Bitcoin is about to keep moving up. This attracts more longs with different leverage and stop loss orders creeping closer to 80,000
B) They will drop price slowly, and rise back quickly. The slow drop allows time for traders to work down the price scale those stop losses and liquidations, and the fast rise ensures they are left in tact and price won’t move low enough to trigger off the chain reaction.
SUMMARY OF 1)
Price is manipulation by being KEPT or STABLE from setting off the chain reaction of stop loss orders, which offering time to get traders to place more of these orders.
NOTE THAT Market Makers don’t place their own trades. They accommodate leveraging traders. That said, they do want their money back - so they want traders to place trades in the losing direction, while simultaneously having their own stop loss orders set a chain reaction that takes price to the level they want.
2) Price is PUSHED or FORCED into the chain reaction of stop loss orders and liquidation orders.
This is the manipulation that forces price, however we can understand the mechanics fully and understand the intentions.
Manipulators (hidden providers of liquidity) will place icebergs or many small orders, which generate large volume in small time intervals, and force bitcoin into the series of orders.
It is then the traders own adverse orders that automatically fulfill the price movement.
SUMMARY OF 2)
Price manipulation is initially forcing price into a series of stop loss orders and liquidation orders, and it’s possible to detect this.
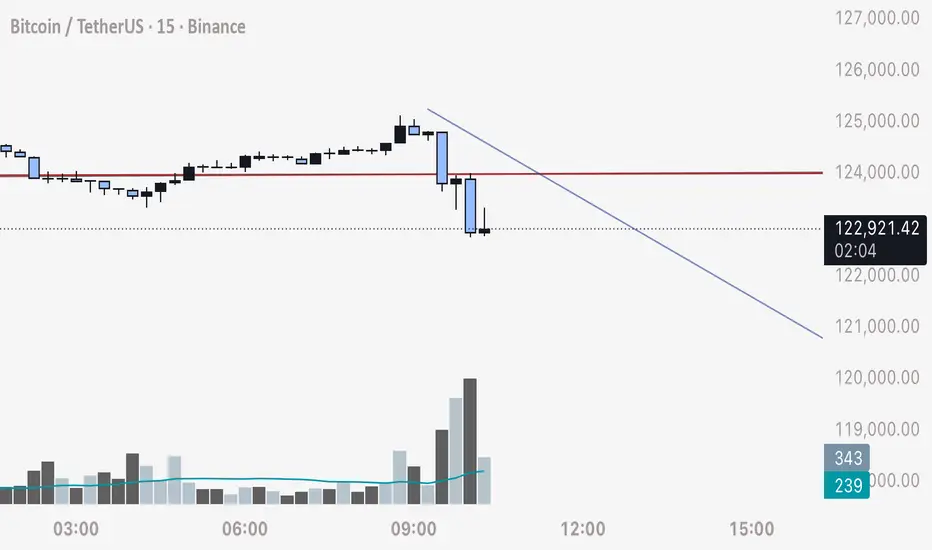
USING THE 5 SECOND TIMEFRAME TO DETECT MANIPULATION
1) Add the basic VOLUME indicator to your chart
NOTE - Suggest using Binance BTC chart
2) Note the Volume moving average - which is shown as a Bitcoin Amount transacted each 5 second interval. This is commonly 0-2 BTC transacted per 5 second.
3) Observe each candle volume coming in. The time frame is small enough that you can see if it’s a buy or sell, very seldomly mixed buys / sells. This also serves as an alternative Order Book.
4) Watch for abnormally large volume transactions on the 5 second candles. It’s not out of the ordinary to spot a 5 second candle that contains 500 BTC bought or sold.
THIS is CERTAINLY the price manipulation that forces price into a sequence of stop loss orders.
5) Use that buy or sell manipulation volume candle as a que to understand the intention of where price is going to be forced.
THE WRAP UP
I hope to assist you all with understanding that the Bitcoin chart is very much INTENTIONAL and can be treated as a STRATEGIC BUSINESS due to the market cap being dominated by leveraging liquidity and few players who control it.
Love and luck to all,
- DD
BTC - Drawing your own Heatmaps and Understanding how BTC MovesAs of late I’ve been noticing more and more YouTube videos of analysts referencing coinglass heatmaps as a means of understanding where liquidity is.
Coinglass - if you read the details and disclaimer - is a prediction based algorithm and is not true or accurate data.
In fact, exchanges have no enforcement that encourages them to disclose data such as stop loss locations, leverage ratios, or liquidation zones.
To draw your own liquidity heat map, I demonstrate here how you can do that.
1) Determine the candle sets that move straight up or down - without price reclaiming that area.
2) Draw a box extending out from that section. Respectively these will be buy orders or sell orders.
3) Unlike limit orders for buys and sells, stop losses are extremely important - as they are limit orders that don’t automatically fill if price is at a premium or discount. They only fill if price crosses the exact price, setting off the order.
4) Use your liquidation boxes to determine where these hidden limit orders are in the chart. As we see currently, there is a mass of leveraged sell limit orders (long stop losses) stacked with little to no gaps in between them.
From here, we can understand how Bitcoin moves.
1) The majority of the market cap is leveraging liquidity. Liquidity used by traders leveraging their longs or shorts.
2) These orders leave above (or below) stop loss orders or liquidation prices, that act in the opposite way of traders direction. For example if a trader longs with $100 using 100x, he is leaving underneath his entry a sell order for the entire position size, or $10,000.
3) These stop loss orders trigger a natural chain reaction that fill, one into the next, causing the price to move fluidly as it triggers off the order block areas.
Since Bitcoin has been moving steadily up, sideways, up, sideways - for such a long period, we can deduce that there is a massive chain reaction of sell orders which will allow the price to drop aggressively and fluidly, without any active sell orders being placed by traders.
Traders looking at coinglass or other similar platforms, and stating there is a mass of short liquidity in the chart - are entirely wrong. Zooming out, we can see an overwhelming offset to the long positions left intact in the chart.
The bottom of the price drop will be the end of these stop loss orders. From there, price will leave a quick and quickly start returning to the higher levels.
Hope you found this helpful.
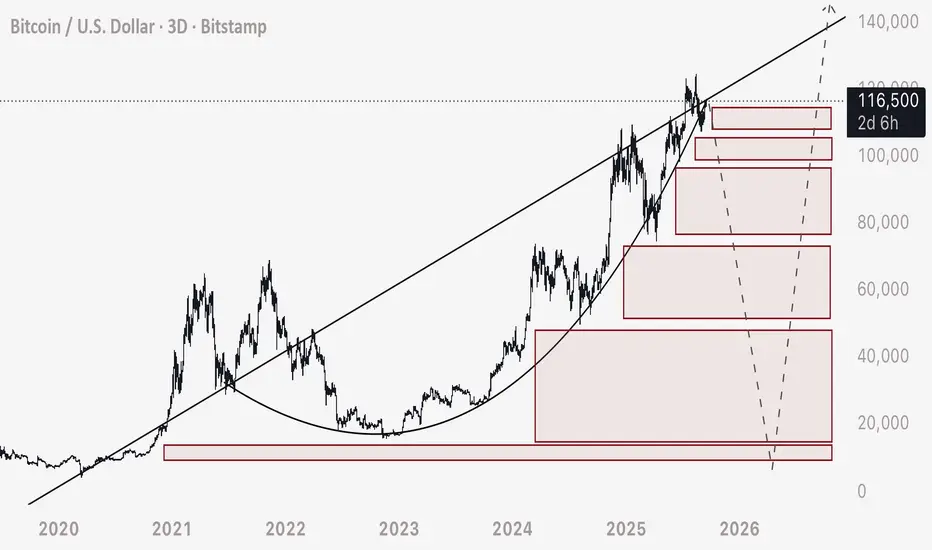
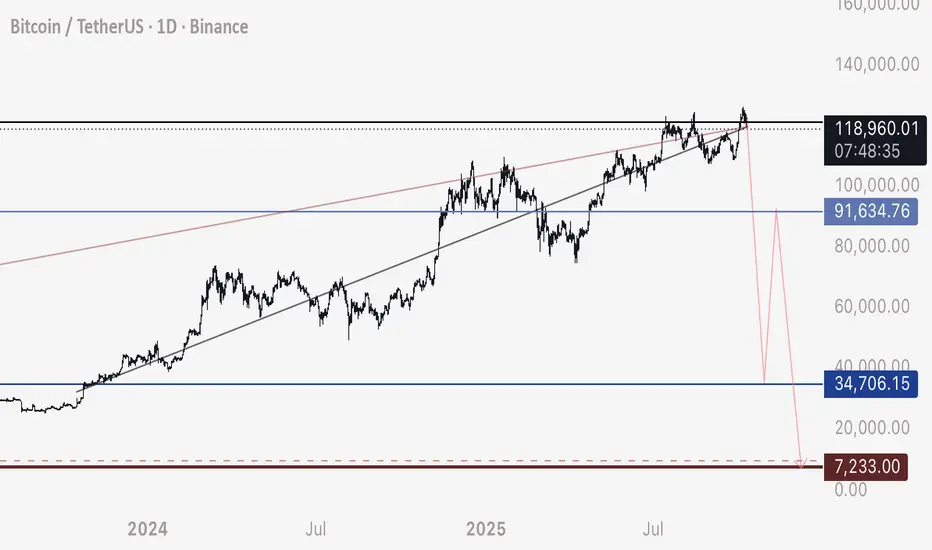
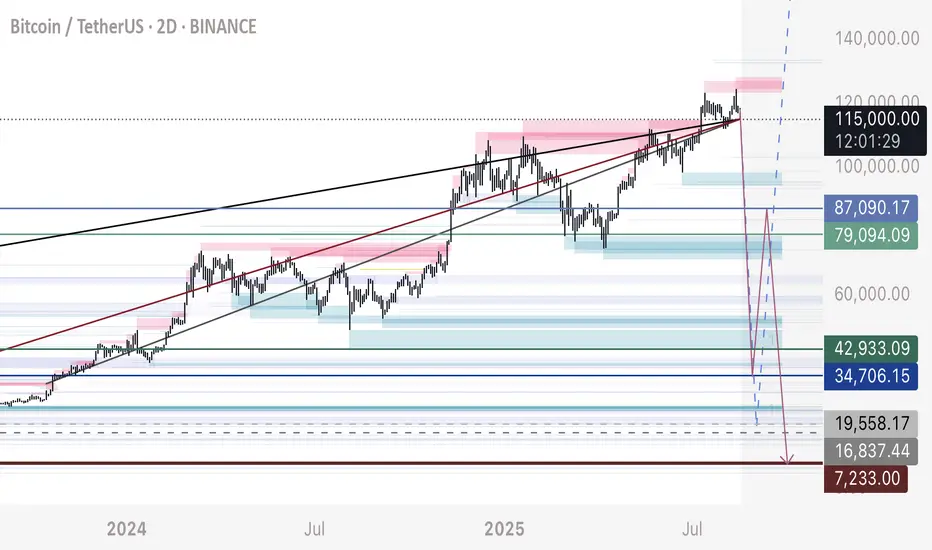
BTC - The Reason 8,000 is Possible There is already speculation and news coming out about plans of a large drop, and I imagine if this occurs there will be much hysteria and conspiracy about it.
Bitcoin is massively dominated by leverage trading. In fact, the majority of buys (or sells respectively) are leveraged.
Even Microstrategy for example, is leveraging its BTC to buy more BTC - and what happens when the value of the asset drops too low when leveraging is used? Well, we will find out. But normally this means bankruptcy / liquidation.
In futures trading, this is liquidation or stop losses being hit on those positions.
Since the price of BTC has been moving up, sideways, up, sideways, up, sideways - we could see for years the intentionality in this chart.
The market has been accumulating long positions / leveraged buys, holding the price up and continuing to attract money into the market cap (leveraged) and keep the orders in tact.
As a consequence, this leaves behind a trail, like a series of dominos, of leveraged sell orders.
These sell orders are in the form of long stop losses or liquidations. In essence, we have an explosive chain reaction ready to set off in the chart - an automatic, natural consequence to how the chart has been moving the last 2 years.
The argument may be that Bitcoins market cap is stabilized by a “floor”, possibly by ETF holdings, spot holdings, ETC - however, this is not the case. Many of these spot holdings themselves are leveraged with BTC to procure more BTC.
Even so, the vast majority of the market cap is market maker liquidity allowing retail traders to leverage trade the asset and other cryptocurrency - and the exchanges aren’t legislated to disclose where the stop losses are located or how much liquidity is contained here.
So if we think popular heat map and liquidation platforms are accurate, think again. The only way to really understand this, is to look at the price movement on HTF.
There are longs held since 12,000, and stop losses respectively held sub 10,000.
I suspect the true “floor price” of BTC is between 7,000 to 8,000 - that’s the total percentage of stable spot holding liquidity vs leveraged liquidity. Leveraged liquidity has no incentive to be stable, it moves in and out, market makers make their money via bankrupting / liquidating traders, or forcing them into stopped out positions.
For me, the last 1-2 years, this has never been an IF, but a WHEN. And WHEN this chain reaction occurs, those reading this can understand the reason is not a black swan (although that may serve as some initial excuse) - but rather a very natural phenomenon in a unique market that we mistakingly treat as a stable market that these events simple cannot happen in.
I’ll be very clear when I say - it’s possible BTC drops to 8,000, extremely fast, possibly in a matter of days or even hours, and quickly returns to ATH positions.
The real warning here I want to get across, is that a flash crash as I am describing, will only go so low as the stop loss orders are active. Ultimately there are no incentives or plans to destroy or bring BTC to zero.
When this flush happens, the big players (market makers) will be filling in the buy orders at those low prices with the liquidity returned from retail longs.
DO NOT SELL AT A MASSIVE LOSS. This is the biggest warning I have to get across with these posts, and would be the most devastating conclusion - believing BTC will go to nothing.
DXY is breaking down a major multi month bearish pattern and over the next 3-5 year period will be absorbing liquidity towards the lows. A falling dollar = bull market for BTC and equities.
This move up on BTC WAS NEVER A BULL MARKET - it was a bearish retest. This explains the erratic, up only nature of the move zoomed out - and all these justifications to explain that this is the “norm” it’s dangerous to traders. It’s not the norm of a bull market, it’s the norm of a bearish retest.
What do you do with this information?
If you are me, and by no means am I suggesting this, you can short the market and try to align yourselves with the big players.
If you’re a believer in the future of BTC, you can do nothing - not letting any fast drop or hysteria shake you or drive you to making an emotional decision to sell or change your mind.
This has never been a doom and gloom scenario for you all - it’s a reality check, a warning, and an opportunity to prepare yourselves for something you may not yet believe is possible unless you’ve been watching this market unfold since it’s very inception. In those cases, you will certainly remember flash crashes and stop hunts - and they have never changed, nor has the nature of the exchanges or market - it’s month more calculated now with big players invested in capitalizing to the fullest on the flaws of it all.
I wish you all the best.
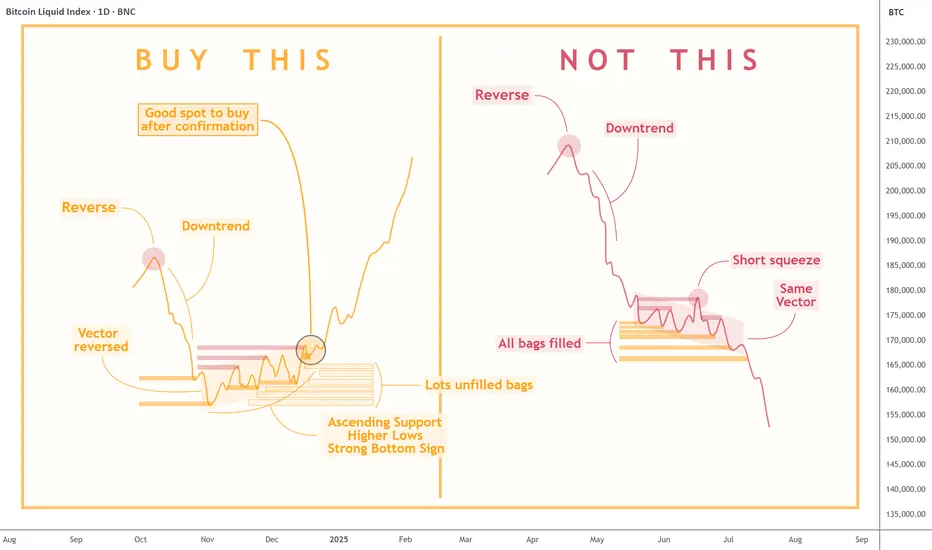
Quick Lesson: How to Identify Trend ReversalKnowing when to enter the market can mean the difference between making a profit and incurring a loss. The chart above clearly compares two similar-looking scenarios with very different outcomes: the one you should aim for and the one you should avoid.
- On the left , we see a textbook example of a bullish reversal. After a significant downtrend, the market prints higher lows and begins forming an ascending support. This signals that selling pressure is fading and buyers are stepping in. Notably, there are usually lots of unfilled bags — latecomers who show strong demand below the current price level but never get their orders filled, and who then just hit the 'market buy' button, which adds fuel to the fire of pump.
- In contrast, the right side shows a very similar pattern — a downtrend followed by consolidation, but with crucial differences. Here, all prior liquidity zones have already been filled, meaning there is less incentive for buyers to support the price. The “same vector” suggests price action hasn’t changed direction, and a common short squeeze traps late buyers before resuming the decline. This is a common bull trap , where a temporary price pump gives false hope before another leg down.
To sum up , a REAL REVERSAL builds on structure, accumulation, and higher lows—whereas a FALSE BOTTOM is often characterized by brief rallies, exhausted liquidity, and no change in vector trend. Experienced traders wait for confirmation and accumulation before entering a position, not just a temporary pause in a downtrend.
NO TRADE? THAT IS THE TRADEToday, I took no trades and I’ll be honest, it was really tempting to break that discipline.
I stared at the chart longer than I needed to. My cursor hovered around the Buy and Sell buttons. My brain tried to convince me that “maybe” this candle meant something. Even though there was no valid sweep, no BOS, and no clean entry into an FVG , the desire to just “be in a trade” was strong.
But I reminded myself:
📌 No Setup = No Trade
📌 Your edge is your lifeline
📌 Discipline is what pays you, not activity
What I felt today is something every trader battles, setup hoping . It’s that mental trap where silence feels wrong, and boredom feels dangerous. But the truth is, boredom is part of being a consistently profitable trader. There are days where your best trade is the one you don’t take.
And I’m proud to say I did nothing.
No revenge trade.
No gambling.
No deviation from plan.
Instead, I observed. I journaled my emotions. I stayed in control. That’s the work behind the scenes: the mental reps that build longevity in this business .
So if you had a quiet session today too, and you resisted the urge to jump in without reason, celebrate that. You're training your mind to trust your system, not your feelings.
Sometimes, the most powerful trade you’ll ever take… is the one you never place.

Quick Lesson: Slow & Fast Flows (Study it & Benefit in Trading)It is always important to look not only at levels (supports/resistances), but how exactly price moves within them.
On the left side , we see a slow flow—a controlled and gradual decline. Sellers are patient, offloading positions over time into visible liquidity levels. Each dip is met with small bids, creating a staircase-like drop. This kind of move doesn’t trigger panic immediately, but it’s dangerous because it builds up pressure. Eventually, when buyers dry up, a larger breakdown happens.
On contrary, the right side shows a fast flow. Here, a large sell order slams into a thin order book, causing an immediate price spike down. There's little resistance, and multiple levels are skipped. This creates an inefficient move, often forming a sharp wick. These fast drops are typically caused by fear, liquidation, or aggressive exit orders. But what’s interesting is the recovery: because the move was so aggressive and liquidity was so thin, price can snap back up quickly. These are often V-shaped reversals with low resistance on the way back.
Try to look for such setups on the chart and learn how the price behaves . Studying such cases will help you identifying upcoming sell-offs/pumps and earn on them.

USDCHF | Live Price Action LessonIn this lesson we have the major pivots in price action directed with the blue path so that we can easily find the trend and to also figure out how to take action on finding out if this pair is Bullish or Bearish
In this case we see that price is at the same high in the past with tight swings creating a range or also called the distribution phase in the 4 market cycles and these two sings alone are telling us that price is looking bearish for the long term
After knowing what the overall goal is for price action 🐻 we can create a strategy for short positions only and look for entries at high points within the entire range to swing this market
(the pivots are our zones of entry either up/down)
I've also drawn an impulse wave to add more confluence to the according swings Up and Down as both directions have the same pattern
Note: Usually the 1st wave is typically way smaller with the 3rd wave⚡ being the largest and quickest.
Using the 150-day MA can now help you manage the trade in either direction like show on chart
we can see that almost every pivot bounced somewhat around the average line for optimal entry points
At the top like the last setup price action broke below and then retraced back to the MA to confirm if the selloff is true after being rejected.
🎯
The goal for this setup is to capture the entire swing and to scale the position as price falls further with more confirmation along the way
Typical forex traders dont teach this type of method as its harder to manage and unrealistic based on how long its takes (70 days+ give or take)
This is a different approach and would be similar to mid - long term swing trading stocks or crypto but it very possible for forex as well based on your strategy and style
By finding the true pivot points in price action you can easily break the trade down to capture 100 - 200 pips or less but will require you to look at the charts in one way only and not both ☯
as it can be confusing.
If you enjoyed reading this and learned something new to help advance your trading journey please boost this post, share it, and comment your thoughts on this universal strategy so that I can continue to make more, Thanks!🙂

Adapting to Market Conditions: Mastering the Market’s Rhythm Markets are not static, they constantly evolve and successful traders are those who adapt their strategies accordingly. Understanding the shapes of trending and volatile markets is, I would say not only essential but also absolute necessary to staying profitable.
This adaptability ensures you’re always aligned with what the market is doing, rather than fighting against it.
1. Trending Markets: Go with the Flow 🌊📈
Trending markets are characterized by sustained movement in one direction, either upward or downward.
In these markets for example:
Example 1: Tesla (TSLA)🚀
When Tesla (TSLA) is in a strong uptrend, as indicated by higher highs and higher lows on the daily chart, breakout strategies work well. For instance, buying above a resistance level and riding the trend upwards aligns with market momentum.
Also, in November last year, Tesla's stock (TSLA) experienced a pullback to its 50-day moving average, which acted as a support level before the stock resumed its upward trend. This technical behavior is common in trending markets, where moving averages often serve as dynamic support or resistance levels.
Traders and investors monitor such pullbacks to key moving averages as potential entry points, anticipating that the trend will continue.
________________________________________
💎 Remember:
- Moving averages often act as dynamic support/resistance in trending markets. Pullbacks to these levels can provide excellent entry points.
________________________________________
Example 2: Forex (EURUSD):
📉 A trending EURUSD pair driven by central bank policy divergence is ideal for moving average crossovers or trend-following indicators like the MACD. Here the examples are numerous and often they do play out.
For example, if the pair is steadily declining, shorting on pullbacks to resistance levels gives a good risk-to-reward ratio.
2. Range-Bound Markets: Mastering Consolidation 🔄🏦
In range-bound markets, price moves between well-defined support and resistance levels without a clear trend. In this case, focus on buying near support and selling near resistance rather than chasing breakouts.
📉 How to Trade Range-Bound Markets:
To do that you’re going to have to study the market.
First, and the most essential to pinpoint accurately, is identify Support and Resistance Levels.
🚫What to avoid in this scenario is Chasing FALSE Breakouts.
•While it might be tempting to jump into a trade when the price appears to break out of the range, these moves often fail, causing the price to snap back into the range.
Patience is essential—seriously, take a deep breath! 🧘
When you resist the urge to chase a breakout, that’s the discipline I was talking about.
________________________________________
💎 Remember:
🛑 Pinpoint Support and Resistance: Accurately identify key levels where price tends to reverse.
🚫 Avoid False Breakouts: Resist the urge to jump into breakouts; many of these fail, leading to price snapping back into the range.
🌟 Pro Tip: Patience is a skill, not a trait. Sticking to your plan is what separates amateurs from professionals.
________________________________________
3. Volatile Markets: Swimming in More Dangerous Waters 🌊🦈
• In these kinds of markets, you never know if you’re catching a wave or becoming the snack!
Though, let’s be honest: it’s usually the latter! — with volatility this wild, most of us are just chum in the water while the sharks feast!🦈
• Volatility spikes are often triggered by economic events, earnings reports, or geopolitical news. These markets can create massive opportunities but also higher risks. Navigating these markets requires an understanding of the underlying factors driving the instability.
Here are a few examples:
Example 1: Stocks (Amazon - AMZN) 💸:
📊 Macroeconomic Events: Changes in consumer spending patterns, inflation data, or Federal Reserve interest rate decisions can impact Amazon's valuation, as they directly affect consumer behavior and borrowing costs.
🌍Geopolitical News: With its massive global reach, even a small disruption in supply chains, shipping costs, or international demand can cause BIG ripples for the company.
📈Earnings Reports: Amazon's quarterly reports, often lead to significant stock price movements, as the company's revenue growth, profitability, and guidance influence investor sentiment.
• What are the risks?
One of the biggest risks, and something that can’t be stressed enough, is emotional decision-making . When markets are volatile, it’s easy to let fear or excitement take over, leading to impulsive trades.
________________________________________
💎 Remember:
• Your emotions aren’t great traders—they’re more like that friend who screams “BUY!” or “SELL!” at the worst possible time. Don’t let the emotions drive your portfolio; they’ll crash it faster than a teenager with a new driver’s license. 🚗
⏰ Bad timing is another one.
– If you’re caught on the wrong side of a trade you can experience substantial losses. But again this is where risk management and setting clear limits on how much you’re willing to lose make the difference in the end.
⚠️ What are the opportunities?
Fast Trades: Short-term traders can capitalize on price swings by executing well-timed trades.
• These opportunities require more attention, a clear strategy, and the ability to act decisively, as even small price movements can lead to meaningful gains—or losses—in a short amount of time.
📉➡️📈 This is good mostly for long-term investors as price dips are viewed as golden opportunities for a stock with solid potential. It’s like a discount at a discount.
• Most of the time, the market eventually recovers, and the stock not only regains its value but often surpasses it.
This confidence comes from studying past trends and patters—you can view short-term dips as just the market’s way of throwing a tantrum, like your wife being mad at you for something you didn’t do... but still texting to ask if you want anything from the store.
📊 Navigating volatile stocks like Amazon requires a proper risk management strategy and an informed approach that can help mitigate the dangers and maximize the opportunities these unique markets present.
Example 2: Forex (USDJPY):
⚠️ During events like the NFP report, USDJPY can see BIG moves. Avoid trading during the initial instability and instead focus on breakout trades once the dust settles.
For example, if the pair breaks out of a symmetrical triangle post-announcement, it often indicates the direction of sustained movement.
💥 An instance of USD/JPY reacting to a major economic release occurred on December 19, 2024, following the Federal Reserve's interest rate decision.
• This led to a significant surge in USD/JPY, with the pair rising over 2% to reach 157.51, nearing a 4 month low for the yen.
A rollercoaster ride, and a dizzy one for the traders, that left traders hanging upside down, clutching their positions, and most likely also questioning their life choices.
🕒 But this is about TIMING once again. And usually, you can’t control it—like trying to catch a bus that always seems to show up either too early or right after you’ve given up and walked away.
________________________________________
💎 Remember:
⚡ Short-Term Trades: Volatility allows skilled traders to capitalize on quick price swings.
⏰ Bad Timing: Being on the wrong side of a volatile move can lead to significant losses.
________________________________________
4. Market Condition Transitions: Recognizing the Shift
⏳Adapting also means recognizing—are you paying attention?—when markets are shifting. Spotting these early —yes, we are back to TIMING!—helps you adjust your strategy before it’s too late.
• Now how to do that? Recognizing the shift, nothing more simple - These pompous words can be summed up to staying alert, using the right tools, and reacting with a clear plan—not impulse. It’s about reading the market’s signals and aligning your strategy accordingly. A good example was in Forex on AUDUSD.
5. Adapt Like a Chameleon 🦎➡️
• Markets are ever-changing, and rigid strategies can easily become a recipe for failure. Adaptability is the name of the game —a game that rewards the quick thinkers and punishes the stubborn. Like trying to win a staring contest with a cat: you’ll blink, and the market’s already moved.
________________________________________
💎 Remember:
• ✅ Stay alert to market signals.
• 🛠️ Use the right tools.
• 🎯 React with a clear, well-thought-out plan.
________________________________________
Wait, I’m not done yet!
This is the ultimate thing I’ve dreaded for years, the cornerstone of my growth. Or at least the thing that keeps reminding me how much I still have to learn:
📖💻 Backtesting and Journaling.
• It’s not glamorous to be real, it’s downright tedious—especially journaling since I’m not a very organized person myself. Honestly, for a long time, I thought it was just something only obsessive perfectionists did—but it turned out to be a great tool to check my assumptions, spot my mistakes, and, occasionally, confirm that I might actually know what I’m doing. Which felt great to have on ‘paper’.
📉🤯 It’s not just about keeping records; it’s about holding yourself accountable and spotting patterns you didn’t even know were there. Your brain works in mysterious ways—like convincing you that every loss was “just bad luck” until the journal smacks you with the truth.
Backtesting is another one of those unglamorous but essential tasks. It’s like doing your lessons before a big test—except the test is the market, and failing costs you real money. Auch.
📈 Backtesting is where you discover if your “brilliant strategy” is actually brilliant or just wishful thinking.
I recommend backtesting a strategy for an interval of at least six months to a year. This timeframe allows you to observe how the strategy performs across various market conditions. Testing for only a short period, like a month, is tempting but misleading. It’s like watching the first five minutes of a movie and thinking you know the ending—spoiler alert: you don’t.
________________________________________
🔁💪 By extending your backtesting period, you can gain confidence in your strategy’s ability to adapt, manage risk, and deliver consistent results.
Plus, a longer testing period helps spot and get past unusual moves in the market, like an unexpected lucky streak or a one-off market event that might otherwise give you a false sense of confidence.
• This way you can tweak and refine it before putting real money on the line. It’s the ultimate rehearsal before stepping onto the trading stage!
________________________________________
💎 Remember:
• ✍️ Accountability: Journaling helps you spot mistakes and refine your strategies.
• 🧩 Pattern Recognition: Discover trends in your own behavior and trading results that you didn’t notice before.
• 🔎 Pro Tip: Journaling isn’t just for perfectionists; it’s for anyone who wants to improve.
• 🕒 Test Over Time: Backtest your strategies over at least 6–12 months to evaluate their performance across different conditions.
• 🛠️ Refinement: Use backtesting to tweak and perfect your strategy before trading live.
• 🎬 Think of It Like Rehearsal: Testing prepares you for real markets, reducing costly errors.
________________________________________
Please boost this post, every like and comment drives me to bring you more ideas! I’d love to hear your perspective in the comments.
Best of luck , TrendDiva

How To Do Multi-TimeFrame Analysis With TradingViewHey,
In this video I provide the two key laws that helped me with trading;
1. An imbalance on the higher time-frames is a range on the lower time-frames.
2. A run on the higher time-frames is a trend on the lower time-frames.
From this point of view, I share with you how I analyze the charts from Monthly to Weekly to Daily chart, and how I like to time the next few days of price-action.
The chart I use in this tutorial is GBP/USD.
Kind regards,
Max Nieveld

$CHILLGUY How to Spot Euphoria LessonHere's a good lesson on spotting EUPHORIA.
I was over a friend's house who is a retail crypto trader on Thanksgiving.
He was telling that I had to buy $CHILLGUY because its the biggest meme ever.
I didn't even bother looking at the chart because of my past experience knowing how to gauge market sentiment,
but I replied, "you telling me this should be an instant sell signal for you".
From that day on, it was DOWN-ONLY 80% for the next 1.5 months 🤓

The 20 Trading Lessons from Top Traders I have read a lot of trading books since the time I started trading my own account and the one book that really helps me out and “I wish I’ve read this one first” – is Market Wizards Interview with Top Traders by Jack D. Schwager.
Here’s the list that struck me most that I’d like to share:
“Early trading failure is a sign that you are doing something wrong; it is not necessarily a good predictor of ultimate potential failure or success.” – Michael Marcus
“If you don’t stay with your winners, you are not going to be able to pay for the losers.” – Michael Marcus
“Liquidating positions is the way to achieve mental clarity when one is losing money and confused regarding market decisions.” – Michael Marcus
“Being a successful trader also takes courage: the courage to try, the courage to fail, the courage to succeed, and the courage to keep going when the going keeps tough.” – Michael Marcus
“Place your stops at a point that, if reached, will reasonably indicate that the trade is wrong, not at a point determined primarily by the maximum dollar amount you are willing to lose per contract. If the meaningful stop point implies an uncomfortably large loss per contract, trade a smaller number of contracts.” – Bruce Kovner
“The times when you least want to think about trading – the losing periods – are precisely the times when you need to focus most on trading.” – Richard Dennis
“Everybody gets what they want out of the market.” – Ed Seykota
“It is a happy circumstance that when nature gives us true burning desires, it also gives us the means to satisfy them.” – Ed Seykota
“Frankly, I don’t see markets; I see risks, rewards and money.” – Larry HIte
“ I have two basic rules about winning in trading as well as in life: 1. If you don’t bet, you can’t win. 2. If you lose all your chips, you can’t bet” – Larry Hite
“In my judgment, all traders are seekers of truth.” – Michael Steinhardt
“The more disciplined you can get, the better you are going to do in the market. The more you listen to tips and rumors, the more money you’re likely to lose.” – David Ryan
“When the market gets good news and goes down, it means the market is very weak; when it gets bad news and goes up, it means the market is healthy.” – Marty Schwartz
“Learn to take losses. The most important thing in making money is not letting your losses get out of hand. Also, don’t increase your position size until you have doubled or tripled your capital. Most people make the mistake of increasing their bets as soon as they start making money. That is a quick way to get wiped out.” – Marty Schwartz
“The best traders are the most humble.” – Mark Weinstein
“You have to learn how to lose; it is more important than learning how to win.” – Mark Weinstein
“Most traders who fail have large egos and can’t admit that they are wrong. Even those who are willing to admit that they are wrong early in their career can’t admit it later on. Also, some traders fail because they are too worried about losing.” – Brian Gelber
“You are never really confident in this business, because you can always be wiped out pretty quickly. The way I trade is: Live by the sword, die by the sword. There is always the potential that I could get caught with the big position in a fluke move with the market going the limit against me. On the other hand, there is no doubt in my mind that I could walk into any market in the world and make money.” – Tom Baldwin
“Clear thinking, ability to stay focused, and extreme discipline. Discipline is number one: Take a theory and stick with it. But you have to be open-minded enough to switch tracks if you feel that your theory has been proven wrong. You have to be able to say, my method worked for this type of market, but we are not in that type of market anymore.” – Tony Saliba
“ How do you judge success? I don’t know. All I know is that all the money in the world isn’t the answer.” Tony Saliba
There’s still a lot of golden information that I want to write in here – for ourselves and for everyday reading so as to keep us aligned with our trading goal, but I prefer to encourage you to read the book.

SIMPLE RULE BASED Structure FOR BEGINNERS☝️The main purpose of my resources is free, actionable education for anyone who wants to learn trading and improve mental and technical trading skills. Learn from hundreds of videos and the real story of a particular trader, with all the mistakes and pain on the way to consistency. I'm always glad to discuss and answer questions. 🙌
☝️ALL videos here are for sharing my experience purposes only, not financial advice, NOT A SIGNAL. YOUR TRADES ARE YOUR COMPLETE RESPONSIBILITY. Everything here should be treated as a simulated, educational environment.

GBPUSD Post Trade Analysis 2024-01-29 : Valid LossGBPUSD Post Trade Analysis
2024-01-29
*Loss*
1. Valid risk entry loss for a valid loss
A. Entry Valid
B. Point of Interest Valid - 4H A.3
C. Valid Exit
2.What can I improve ?
A.
- I can input trade concept into Edgewonk Advance Journal Section.
- I can add all info, pre trade screenshots, fundamental news
- I can improved my fundamental analysis
- First Mitigation Failed - will track and possible add no first mitigation to trade plan
What would be my entry model Price Levels ?
1. Entry Price : 1.26750
2. Stop Loss : 1.26450
3. Take Profit : 1.27200
Could I take this Trade ?
- Would set alert and have 1 hour to place trade
- Valid Entry and Win
Lessons
- First mitigation is lower probability and Entry Model is a more valid Trade

🔜RULE FOLLOWING CHALLENGE, join to improve your trading 💪Did you know that most beginner traders can't follow their rules for 7 days in a row? Unfortunately, they start overtrading or changing the rules of the system, entering random trades, overrisk, etc.
I've been there many many times myself, but then slowly started focusing on this part and made my first 7, then 10 days of rules following, broke with another tilt, started again, reached 17, 30 days, and failed again.
Each time it became better and better, and now I'm on my way to 50 days of rule-following.
I developed a routine and system that allows me to keep doing it, day after day. It includes mental technics, as well as simple EAs for Metatrader to help with over-risking and overtrading issues.
If you want to step out of your comfort zone and improve your trading, join this 7-day rule-following challenge by leaving a comment below.
It will be hosted here on TradingView, probably using the Stream feature, but I'll let you know later when we will gather up.

Three GOLDEN rules of tradingThree golden rules of trading
1. Learn when to stay out of the markets. This comes from the principle that it’s almost always good to do the contrary of what beginners do. Think for yourself, beginners tend to always search for an entry and predict any kind of price action, even the choppiest one. The truth is, sometimes markets are in condition when it’s just doesn’t make sense to trade and we need to wait.
Some questions to ask ourselves: if I would enter 1000 trades like this, do I think it will be a consistent strategy?
Do I really see a clear price action development now, or do I want to enter very early to not miss the initial move, which by the way will develop basically out of nowhere? It’s an illusion that we need to predict everything. We need to see clarity, not predict the chop.
Realize, that what we often need to do in live markets is DO NOTHING.
2. Learn how to lose
Most traders who are still learning, and after a loser, tend to become emotional (fearful, frustrated, angry etc.) and start to act based on emotions, not an actual plan they had. This can be conscious when you understand you’re making a mistakes, but emotional brain took over and you still overtrade, tilt or over risk. Or it could be unconscious when you believe you’re doing the right things.
So how to do it? Be aware of your emotional triggers, have a mental journal and step by step learn to RESIST this desire to revenge and place another trade. It’s a long process, but with commitment, it’s possible to achieve.
3. Learn to actually follow the rules
It’s a hard one to master. Beginners and even experienced trades tend to deviate from the rules of their strategy without proper testing. You constantly need to keep in mind that placing random trades will give you random results and it’s not sustainable long-term.
The best way to do it is to start a rule-following challenge, when you tick day by day if you followed the rules.
Most people didn’t follow their trading rules even for 5 days in a row! Just think about it.

📖Ultimate guide to feeling a little bit better after a loser.1The video is long, feel free to use speed settings :)
Thanks for your interest in the last post about the Major mistakes traders do.
Now let's talk about coping emotionally with losers. This is Part 1.
📖We all know this feeling, it feels awful, hopeless like something very valuable has been taken from us, like it destroys our work and plans and it feels BAD.
Who am I to speak on this topic. 4 year of trading experience, lost maybe 25 funding challenges over the course of 3 years, got 2 times funded the previous year and lost these funded accounts. Had multiple losers, out of which many just stamped me emotionally.
Over time I developed coping skills to better prepare for these -1’s and though I’m far from being really good at it, I’m definitely a bit better than I was some time before.
And this is my ultimate guide to feeling a little bit better after a -1.
📖First of all, congrats - if you’re still here, it means you’re interested in the topic and by watching videos like these from me or other traders, and thinking, and trying to become better, you’ll do it eventually. Yes, with time you better find one source of education that really sticks to you, and for me, it’s the method.. but even other videos can build some foundation for your work in this direction.
📖As pointed out in the Mental Game of Trading, Our brain functions in 3 layers, so to say - automated habits, emotional brain, and rational. The thing is, emotions can really block rational thinking. It’s physical and happens in your brain. It literally changes our chemistry. Accept the fact we can't accept losers fully. It will always feel shite, but with time and a good strategy of preparation, it will get better. So this is a Stoic principle applied to trading, be prepared for the worst-case scenario, how? Expect it to happen, and know it’s inevitable and you’ll feel bad. Paradoxically, it allows you to feel a little bit better when it actually happens.
📖Notes and full diary, you want to know all about how you behave in the markets so that you recognize the build-up of emotions and can prepare better for the next inevitable loser, and in case you understand you need to stop because you’ll become too emotional - than you’ll be able to stop.
How diaries work is that you know all your triggers, and patterns, in a way that nothing is new to you about how you feel about the market and how you react to certain situations.
📖Appreciate yourself and your work! gratitude - videos, practice, mooji. appreciate the work you did, especially if the loss comes out from a high-quality setup. Many people turn too much attentions to their flaws while forgetting recognizing their powerful sides. What’s your super power - holding to TP, sticking to max trades per day, not overrisking, really going through the checklist.
📖Awareness doesn’t equal control. You can control things only to some extent, but when emotions really kick in, it’s too late. That’s why people very often say: I understand everything, but I can’t stop. Yes, my friend this is how emotional brain works - it leaves with no control over the actions. Awareness doesn’t equal control. If you feel bad, you need to STOP, because in that state losers will feel especially bad.
📖Trade less, a lot less. Good traders and my experience.
📖Record a trade as a -1 in a journal once you started it - Ment’s video.

💡MAJOR mistake that all beginners do. Try to do the opposite.💡The main purpose of my resources is free, actionable education for anyone who wants to learn trading. Consider following the attached links for improvement of your mental and technical trading skills - learn from hundreds of videos featuring the real story and growth of a particular trader, with all the mistakes and pain on the way to consistency. I'm always glad to discuss and answer questions.
