LINK (Chainlink) – Breakout Setup Aligned With BTC Macro MoveWith BTC on the verge of a new all-time high, the market is poised for high-beta altcoins like LINK to follow with strength. LINK is currently testing the 200-day EMA — a critical momentum indicator. If BTC confirms breakout and LINK holds this zone, it sets up a high-probability continuation play.
🔹 Entry Zone:
$16 (on confirmation of support at 200-day EMA)
🎯 Take Profit Targets:
🥇 $20 (prior range high / psychological resistance)
🥈 $25 (multi-month breakout level)
🥉 $30 (macro extension target)
🛑 Stop Loss:
Daily close below $14.50 (breakdown of EMA support and invalidation of current structure)
LINK

#LINK/USDT#LINK
The price is moving within a descending channel on the 1-hour frame, adhering well to it, and is heading for a strong breakout and retest.
We are experiencing a rebound from the lower boundary of the descending channel, which is support at 14.50.
We are experiencing a downtrend on the RSI indicator that is about to be broken and retested, supporting the upward trend.
We are looking for stability above the 100 Moving Average.
Entry price: 15.80
First target: 16.45
Second target: 16.90
Third target: 17.56

Chainlink Strong Higher High In The Making ($85.75 NEW ATH 2025)It seems pretty simple and there is no room for controversy here, Chainlink is moving to print a new higher high. The chart structure and market conditions are perfectly aligned for this event to take place.
Good afternoon my fellow Cryptocurrency trader, do you agree?
Chainlink has been producing higher highs and higher lows in the past two waves. The upper boundary of the post bear market consolidation channel worked as support in August 2024 and April 2025.
Since LINKUSDT consolidated for 525 days after the bear market, this becomes a very strong support. Seeing this support zone being activated twice, the second with a higher low, reveals what's to come.
The next move is a strong advance, the biggest since 2021 and very like a new All-Time High in this year 2025.
The chart is showing as the main target $64, but it can go higher; the projection for the 2025 ATH for LINKUSDT sits at $85.75... Or more.
Thanks a lot for your continued support.
Namaste.

LINK/USDT - Long trade LINK / USDT Update 🔔
I couldn’t be more bullish on the LINK trade we’re holding right now.
We’ve got a textbook inverse head and shoulders playing out... neckline broken, perfect retest, and now a bullish engulfing candle confirming the move. Structure couldn’t be cleaner. This is exactly what you want to see after a breakout. Now could be a good idea to add to your position size on the LINK trade.
Holding strong here with eyes on the $18.20 and $19.53 short term targets. As long as price holds above the neckline zone, this setup remains high-conviction.
Big upside potential from here. Let’s ride it. 🔥

$LINK Long Overdue Move on the Horizon
BIST:LINK has shockingly been a very poor performer as well considering their revolutionary tech connecting web2 -> web3
Dump >67% and rebounded 50% since then.
PA has been trapped between the 200 and 50DA, which suggest voilent breakout coming up.
RSI Is still healthy.

ALTCOIN BOOM FOR CHAINLINK 2025-2026 PROPOSALWhy This Asset?
Core Info: Chainlink is the decentralized oracle network that bridges blockchains with real-world data (price feeds, weather, sports scores), enabling smart contracts to operate autonomously. It’s the critical infrastructure for DeFi, gaming, insurance, and beyond.
Recent News:
Cross-Chain Interoperability Protocol (CCIP) launched on Base (Coinbase’s L2) and other chains, streamlining cross-chain token transfers.
Partnership with DTCC (the $2 quadrillion securities settlement giant) to pilot real-world asset (RWA) tokenization.
Deep Dive:
Chainlink is capitalizing on two seismic shifts:
Institutional Adoption: DTCC’s collaboration signals TradFi’s growing reliance on blockchain infrastructure.
Multichain Dominance: CCIP’s expansion solves crypto’s fragmentation issue, making LINK indispensable for cross-chain interoperability.
Latest Tech/Utility Update
Update: CCIP mainnet launch + upgraded staking v0.2 (supports more node operators, boosts rewards).
Implications:
For Users: Cross-chain swaps become cheaper and faster, rivaling LayerZero and Wormhole.
For Investors: Only 8% of LINK is staked. If adoption accelerates, reduced supply + rising demand could trigger deflationary pressure.
Biggest Partner & Investment
Partner Spotlight: SWIFT, the global banking messaging network, tested CCIP with 10+ major banks for cross-border transactions.
Deal Size: Undisclosed, but SWIFT’s network spans 11,000+ banks. Integration could funnel trillions into blockchain.
Impact: SWIFT’s involvement isn’t just a partnership… it’s a gateway for TradFi liquidity. Chainlink is now the backbone for both DeFi and legacy finance.
Most Recent Added Partner
New Collab: Avalanche integrated Chainlink Data Streams for high-speed DeFi pricing.
Why It Matters: Avalanche’s institutional subnets (e.g., JPMorgan’s Onyx) now rely on Chainlink for hyper-accurate data. LINK solidifies its role as the oracle for performance-focused chains.
Tokenomics Update
Changes:
Staking v0.2 offers 5-8% APY but requires longer lockup periods.
Total supply remains fixed at 1B tokens (no inflation).
Analysis:
Staking upgrades reduce sell pressure, but 40% of tokens are still held by early investors. Gradual unlocks could cause short-term volatility, though institutional demand (e.g., SWIFT/DTCC) might absorb it long-term.
Overall Sentiment Analysis
Market Behavior: Accumulation phase. LINK surged 40% since June (13 or 13−15 range), with whale wallets growing steadily.
Driving Forces:
Bullish: CCIP adoption + SWIFT/DTCC hype.
Bearish: Rising competition (Pyth Network, API3) in the oracle space.
Insight: Sentiment is cautiously bullish. Chainlink’s first-mover advantage is strong, but it must keep innovating to fend off rivals.
Recent Popular Holders & Their Influence
Key Investors:
Wintermute (crypto’s top market maker) boosted LINK holdings by 12% this month.
Cobie, a crypto influencer, tweeted: “LINK is the oracle blue-chip.”
Why Follow Them: Wintermute’s moves often signal institutional positioning. Cobie’s endorsement fuels retail momentum.
Summary & Final Verdict
Recap: Chainlink is the glue connecting DeFi, TradFi, and multichain ecosystems. CCIP, SWIFT/DTCC deals, and staking upgrades create a perfect storm of utility and demand.
Verdict: LINK is a long-term hold with asymmetric upside. It’s not a meme coin, but its dominance in oracles (60%+ market share) makes it a cornerstone of crypto’s future. Risks include token unlocks and Pyth Network’s growth.
Final Thought: If you’re betting on blockchain infrastructure becoming mainstream, LINK is essential. If you want hype-driven pumps, look elsewhere.

LINK/USDT is Nearing The UptrendHey Traders, in today's trading session we are monitoring LINK/USDT for a buying opportunity around 15.20 zone, LINK/USDT is trading in an uptrend and currently is in a correction phase in which it is approaching the trend at 15.20 support and resistance area.
Trade safe, Joe.

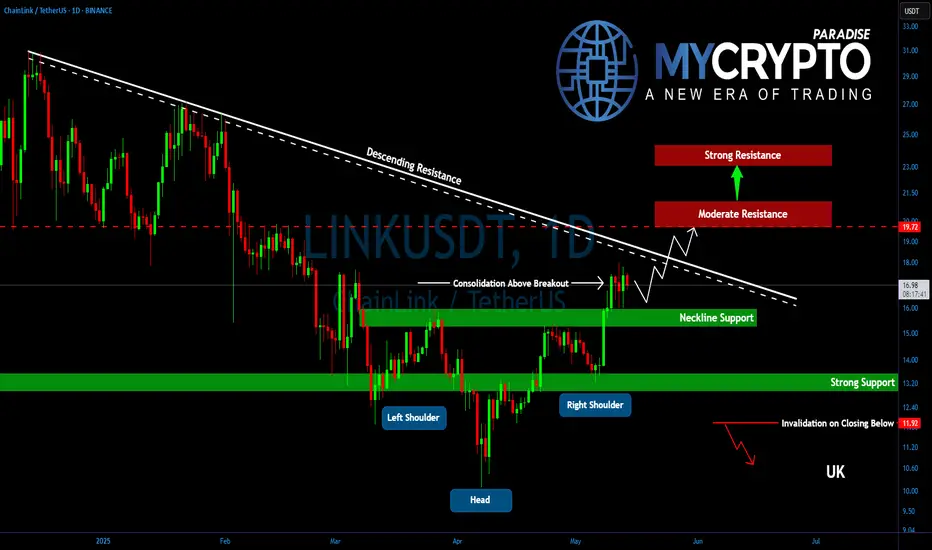
Is LINK Preparing for a Parabolic Rally? Key Levels to WatchYello, Paradisers! After completing its ABC correction, #LINK slipped into a sideways phase — but something significant is brewing beneath the surface. The recent formation of an inverse head and shoulders might be signaling the start of something much bigger.
💎LINK has now confirmed a breakout above the key neckline at $16.00, a critical level that had been capping price action. Following this breakout, the price is holding its ground well and entering a post-breakout consolidation that often acts as the launchpad for the next explosive leg.
💎#LINKUSDT now faces a decisive resistance at $18.50, a trendline rejection point that has held strong since December 2024. A clean break above this level could ignite strong bullish momentum. If bulls succeed, we could see LINK pushing quickly toward the $19.70–$20.30 range, a moderate resistance area, where partial profit-taking is likely from experienced hands.
💎Should momentum persist, the next major upside lies between $23.25–$24.00, the measured target of the inverse head and shoulders breakout. This zone is not just technically significant due to the pattern, it also aligns with the 61.8% Fibonacci retracement, making it a high-confluence resistance.
💎On the downside, LINK has strong support between $16.00–$15.50. This is not only the breakout neckline but also closely aligned with the 50 EMA and 200 EMA, reinforcing this range as a robust demand zone.
Paradisers, strive for consistency, not quick profits. Treat the market as a businessman, not as a gambler.
MyCryptoParadise
iFeel the success🌴
TradeCityPro | LINK: Eyeing Breakout as RSI Signals Divergence👋 to TradeCity Pro!
In this analysis, I’m going to review the LINK coin. This project is one of the well-known DeFi and Cross-Chain platforms, and it's considered one of the top projects in these categories.
🔍 The LINK token currently has a market cap of $627 million and holds a ranking on CoinMarketCap.
⏳ 4H Timeframe
As you can see, LINK has started a bullish leg, rising from $13.30 to $17.62. After a pullback that reached as low as $15.92, it has returned to test the previous high.
⚡️ If the $17.62 resistance is broken, the price could rally toward $19.42. Therefore, a breakout above $17.62 can be used as a long entry trigger.
📊 So far, volume has aligned well with the upward trend, and there are no signs of weakness from the volume perspective. However, if volume rises during a pullback or drops during a bullish move, it would signal a volume divergence, potentially indicating a trend reversal.
💥 Meanwhile, the RSI oscillator shows a bearish divergence. If RSI closes below the 50 level, this divergence would be confirmed, suggesting the possibility of a corrective move.
✨ To confirm a deeper correction or trend reversal, a breakdown below $15.92 would be significant. The next support after that lies at $15.22, with the main support far below at $13.30.
✔️ For short positions, I recommend waiting for clearer signs of trend reversal, such as volume divergence or confirmed RSI divergence. At the moment, there’s no solid short setup, and we need to wait for a suitable structure to develop.
📝 Final Thoughts
This analysis reflects our opinions and is not financial advice.
Share your thoughts in the comments, and don’t forget to share this analysis with your friends! ❤️

LINKUSD: Expected to give +100% return.Chainlink has turned overbought on its 1D technical outlook (RSI = 70.291, MACD = 0.870, ADX = 19.937) and has validated the start of the new bullish wave of the Channel Up as it crossed above both the 1W MA200 and MA50. Both prior bullish waves rose by nearly +300%, the most recent by +275%. Technically it can repeat at least that and double in price (TP = 35.00) before the wave peaks at the top of the Channel Up.
## If you like our free content follow our profile to get more daily ideas. ##
## Comments and likes are greatly appreciated. ##

LINK in coming Weeks ...The pattern has broken, and now I expect the price to rise to $36 . AB=CD.
previous analysis
Give me some energy !!
✨We spend hours finding potential opportunities and writing useful ideas, we would be happy if you support us.
Best regards CobraVanguard.💚
_ _ _ _ __ _ _ _ _ _ _ _ _ _ _ _ _ _ _ _ _ _ _ _ _ _ _ _ _ _ _ _
✅Thank you, and for more ideas, hit ❤️Like❤️ and 🌟Follow🌟!
⚠️Things can change...
The markets are always changing and even with all these signals, the market changes tend to be strong and fast!!

LINK Daily breakout?One of the most important crypto projects is undoubtedly Chainlink. Having been in a downtrend like must altcoins ever since President Trumps inauguration , LINK looks to finally be ready to exit the bearish trend channel for the first time this calendar year using the newly flipped 1D 200 EMA as a launchpad or is this a local top and the trend continues?
For the bulls a double bottom at $10.15 followed by a higher lows and now a higher high is a strong argument for a flip to bullish structure, however a breakout is needed to confirm this bullish flip in structure and with BTC + most majors at local resistance levels and looking in need of a cool off, this may be too much to ask of LINK at this time.
The bears would say this is business as usual and a rejection off the upper limit maintains the bearish trend, a loss of the 1D 200 EMA would definitely increase the likeliness this outcome.

Chainlink Analysis for Intraday TradingWait for the entries to be filled from both side, I will prefer short entry here, Reason btc looks too weak now, USDT.D has reached the strong bullish zone and can hit 4.80-4.89% zone for correction. While I will short BTC from 105-106K SL if 4 candle closes above 107.8K, at the same time I will open short positions on ETH, and Link SL when BTC hits the SL.

LINK/USDT 1W chart reviewHello everyone, let's look at the 1W link to USDT, in this situation we can see how the price is fighting for the mountain from the downward trend line over which we are currently.
Going further, let's check the places of potential target for the price:
T1 = $ 18.38
T2 = $ 21
Т3 = $ 23.53
Let's go to Stop-Loss now in case of further declines on the market:
SL1 = 15.31 $
SL2 = $ 13.17
SL3 = 10.53 $
Looking at the RSI indicator, we see a clear increase on the indicator and a return to the upper part of the range, but there is still room for continuing the ongoing strong growth.

LINK to make a new ATH?LINK is showing great strength and respecting EW theory.
The ABC correction finished in JUNE-2023 and since then, LINK has likely finished its wave (1) and wave (2). Now in motion to complete its wave (3).
Big Question is whether LINK will break its previous ATH of $52.88?
If it goes key targets are $70-80 (wave 3), $90-120 (wave 5).
Could it be that LINK becomes one of the strategic reserve assets for the US? Time will tell.

LINKUSDT 1D Analysis LINK ~ 1D Analysis
#LINK Successfully retested this support block. This would be a very good buy for now, with a short term target of at least 10%+.

LINK/USDT Setup: Structure Break + Fibonacci Confluence🚨 Market Watch: LINK/USDT Analysis 🚨
I'm currently keeping a close eye on LINK/USDT. 🧠 On the daily chart, we've observed a clear break in market structure 📉—and dropping down to the 4H timeframe, we see further confirmation of that shift.
At this point, price is looking a bit overextended 🏃♂️💨, and I’m anticipating a retracement back into equilibrium based on the current price swing 📊. This could set up a high-probability short opportunity 🎯.
📹 In the video, I dive into:
Overall trend direction 🔁
Market structure shifts 📐
Price action breakdown 🕵️♂️
And key support/resistance levels to monitor for target zones 🧱
My stop loss would be positioned just above entry, using around 2x ATR for smart risk control
🛡️. As for targets, we could see moves as wide as 6x ATR—but it's crucial to reference the left side of the chart for confluence 📅📈.
I’m aligning this setup with my Fibonacci retracement strategy, which we also covered in the video 🔢📏.
This is not financial advice. Always trade your own plan. ⚠️📉💼

LINK in coming Weeks ...frankly, Bitcoin will reach $30 in the coming weeks.
Give me some energy !!
✨We spend hours finding potential opportunities and writing useful ideas, we would be happy if you support us.
Best regards CobraVanguard.💚
_ _ _ _ __ _ _ _ _ _ _ _ _ _ _ _ _ _ _ _ _ _ _ _ _ _ _ _ _ _ _ _
✅Thank you, and for more ideas, hit ❤️Like❤️ and 🌟Follow🌟!
⚠️Things can change...
The markets are always changing and even with all these signals, the market changes tend to be strong and fast!!

LINK Trade Setup – Pullback to Support OpportunityChainlink (LINK) is currently testing resistance, and a retracement into the next support zone offers a clean long entry with solid upside potential.
🔹 Entry Zone:
$13.00 – $13.40
🎯 Take Profit Targets:
🥇 $15.00 – $16.00
🥈 $17.00 – $18.00
🛑 Stop Loss:
Just below $12.00

LINK/USDT 4H Chart ReviewHello everyone, let's look at the 4H chart LINK to USDT, in this situation we can see how the price was moving in a downward channel, from which we saw an exit to the top and the formation of a new local uptrend line.
Let's start by defining the targets for the near future that the price has to face:
T1 = 15.08 USD
T2 = 16.87 USD
Т3 = 17.93 USD
Т4 = 19.07 USD
Now let's move on to the stop-loss in case the market continues to fall:
SL1 = 13.98 USD
SL2 = 13.12 USD
SL3 = 11.74 USD
SL4 = 10.76 USD
SL5 = 9.48 USD
If we look at the RSI indicator we can see how the price correction gave a strong rebound on the indicator, which could potentially give strength for new growth.

LINK/USDT 1H Chart Update Chainlink is riding a strong Rising Channel!
Price action shows clear patternson LINKUSDT
▸ Bullish Doritos at $12.00 & $13.00, pushing the price higher.
▸ Reverse Doritos at $13.00 & $15.00, leading to pullbacks inside Rising Channel.
▸ Key levels to watch: $14.00 (support) and $17.00 (upper resistance).
✉️ As long as LINK stays in the channel, the bulls are in control! Will we see a breakout to $17.00 soon? Let’s discuss!

#LINK/USDT#LINK
The price is moving within a descending channel on the 1-hour frame, adhering well to it, and is heading towards a strong breakout and retest.
We are seeing a bounce from the lower boundary of the descending channel, which is support at 14.30.
We have a downtrend on the RSI indicator that is about to be broken and retested, supporting the upward trend.
We are looking for stability above the 100 moving average.
Entry price: 15.00
First target: 15.30
Second target: 15.61
Third target: 15.94

LINK: Multiple Scenarios#LINK had a great bullish rise from June 2023 to March 2024.
Since then, its price action has been unclear, with two possible corrective scenarios and one bullish shown below.
Regardless of the future path it takes, the broader outlook targets a new ATH.
#Chainlink
