Bias Analysis – US100 – HTFHTF Protected Low: 24,885
HTF Liquidity Draw: 26,250
Bias: Bullish
Execution depends on lower timeframe confirmation.
Bias only.
Liquiditypool

LONGCurrent Price: 0.99855 (Analysis was generated on Monday Morning)
Direction: LONG
Confidence level: 52%(Signals are mixed and conviction is not strong, but price is sitting right at support and the trader wisdom slightly favors upside protection flows into USDT)
Targets
Target 1: 0.9994
Target 2: 1.0002
Stop Levels
Stop 1: 0.9980
Stop 2: 0.9975
Key Insights:
Here’s what’s driving this setup. Several traders are closely watching USDT dominance and repeatedly point out that rising or stabilizing USDT flows usually show up right before or during short-term weakness in broader crypto markets. In multiple discussions, traders highlighted that when Bitcoin and altcoins struggle near resistance, capital quietly rotates back into USDT. That dynamic supports holding USDT long on a short time horizon.
Another thing that stands out is location. USDT is trading slightly below the $1.00 peg at $0.99855, which puts it right near the lower edge of its very tight weekly range. When price sits this close to support, the asymmetric trade favors a long bias rather than betting on a sudden de-peg without a catalyst. Several traders explicitly framed this as a defensive positioning phase rather than a speculative one.
Finally, even though sentiment volume on X is light, what is there leans constructive. The few trading-focused posts that do exist frame USDT as a buy for capital preservation while volatility picks up elsewhere. That aligns with the broader trader narrative around dominance and liquidity protection.
Recent Performance:
Over the past week, USDT has done exactly what it’s designed to do: move very little. Price has oscillated between roughly $0.9982 and $0.9998, repeatedly finding buyers below $0.999. Each dip toward the lower end of the range has been absorbed quickly, which tells me there’s no urgency to exit USDT at these levels.
Expert Analysis:
When I look at the professional trader commentary as a whole, the message is subtle but consistent. Many traders expect choppy or corrective price action across crypto majors, and in those environments, USDT demand tends to increase. Several traders also mentioned that even if Bitcoin pushes slightly higher short term, they still expect follow-through selling afterward, which again favors holding USDT into that move.
Technically, the levels are very clear this week. Support clusters around $0.9980–$0.9975, while mean reversion toward the peg sits just under and slightly above $1.00. That clean structure is ideal for a low-volatility long with tight risk control.
News Impact:
Recent news around Tether expanding its investments and preparing for evolving regulatory frameworks adds a layer of stability rather than risk. Nothing in the current news cycle suggests immediate stress on the peg. If anything, the focus on compliance and infrastructure strengthens short-term confidence in USDT as a parking asset.
Trading Recommendation:
Putting it all together, I’m taking a LONG position on US Dollar Tether for this week. This is not an aggressive trade; it’s a tactical one. I’m looking for a grind back toward the $1.00 area with limited downside risk, using tight stops below $0.9980. Confidence is moderate because conviction across sources isn’t strong, but price location and trader behavior tilt the odds slightly in favor of a bounce rather than a breakdown.

EURUSD| Institutional Narrative - Weekly (12th JAN - 16th JAN)
WEEKLY NARRATIVE: FX:EURUSD ARCHITECTURE 🦅
Market Condition: Bearish Orderflow Delivery State: Non-Correlated Price Delivery
The Macro View: We are currently navigating a divergence in price delivery. While the primary Draw on Liquidity (DOL) remains at the 1.17900 - 1.18100 levels, the prevailing Bearish Orderflow makes a direct sweep of those highs highly questionable for the early week.
The Roadmap:
Mon-Tue Phase: Expecting a continuation lower. Price is likely to seek Sell-Side Liquidity (SSL) within the 1.16000 - 1.15800 zone.
The Pivot: Once the lower targets are mitigated, we look for a corrective shift.
The Retracement: A move back into the 1.16900 - 1.17200 premium array to rebalance.
Architect’s Note: Do not marry the bias. The non-correlated nature of the current delivery means we must wait for displacement before confirming the retracement leg.
Happy Trading. @HSK_FX

EURUSD Buy After Few Conformation Now at This Time Price 1.1774 Area. at time point price goes up near 1.1780 its a Internal High Level then price come to down at 1.1756 (its a Order Block area, Golden zone and also fixed Volume range)as par technical analysis May be possible Price Liquated sweep 1.1747 Then Find Clear up side Buy Conformation be carefully take all entry as per yourself .that is our analysis

GOOGL low resistance liquidity run to ATHI think this GOOGL 24 hour chart has a great set up to take us back to All-time high.
We got the formation of a bullish fair value gap today.
We have relative highs sitting at 321.31.
Most definitely a low resistance run on liquidity at 332.98.
There was a gap on the weekly timeframe that got filled, and we got a bounce out of it two weeks in a row, and this would be the third week of a bounce .
The only thing that could disrupt this move up, is that there is a bearish weekly Fair value gap that needs to get broken through.
We clear that and it could be smooth sailing.

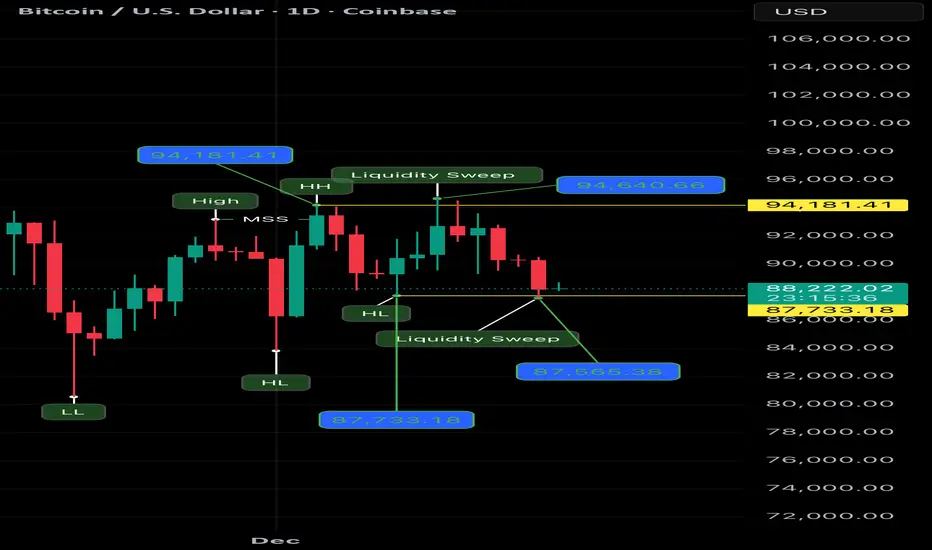
Daily Timeframe | Structure & Liquidity BehaviorCOINBASE:BTCUSD
This daily Bitcoin chart shows a clear sequence of price behavior driven by liquidity interaction, not randomness.
Let’s go step by step.
⸻
1️⃣ Market Structure Shift (MSS)
Price breaks above a previous daily high, creating a temporary bullish shift in structure.
This move changes short-term bias and pulls attention to higher prices, but structure alone does not confirm continuation.
⸻
2️⃣ Higher High Formation
After the shift, price extends higher and prints a Higher High around 94,181 – 94,640.
This area becomes a natural reaction zone, where:
• Stops accumulate
• Breakout activity increases
• Participation expands
Price now has clear overhead liquidity.
⸻
3️⃣ Liquidity Sweep Above Highs
Price pushes above the highs with long upper wicks, taking liquidity, but fails to hold above the level.
Key observations:
• No sustained closes above highs
• Immediate rejection
• Weak follow-through
This indicates exhaustion, not strength.
⸻
4️⃣ Loss of Upward Momentum
Following the sweep, price struggles to progress higher and begins to rotate lower.
This signals that the move up completed its objective and that the market is no longer accepting higher prices.
⸻
5️⃣ Downside Rotation Toward Higher Lows
As price moves down, attention shifts to the daily Higher Lows (HLs) that supported the prior structure.
These lows represent protected liquidity beneath the market.
⸻
6️⃣ First Sell-Side Liquidity Sweep (≈ 87,733)
Price drops sharply and sweeps a daily Higher Low, triggering stops and accelerating movement.
This move is clean and direct, showing clear intent.
⸻
7️⃣ Second Sell-Side Liquidity Sweep (≈ 87,565)
A deeper wick follows, confirming:
• Downside liquidity was actively targeted
• The move was deliberate and measured
Multiple sweeps reinforce the idea of liquidity completion, not panic.
⸻
8️⃣ Current Price State
At the current level (~88,340):
• Liquidity has been taken on both sides
• Price is transitioning into a balance / evaluation phase
From here, the next move will depend on:
• Acceptance above the swept lows
• Or continuation below with new structure development
⸻
Final Takeaway
This chart demonstrates a pure cause-and-effect sequence:
✔️ Structure shift
✔️ Highs taken
✔️ Rejection
✔️ Lows taken
✔️ Reset
No assumptions.
No narratives.
Just price responding to liquidity.
Not a financial advice.
Ai Generated.
XAUUSD meltdown before hitting new all time high$Guess before the price race for the moon we already respected the Weekly Bearish Imbalance nd closed the week with rejection wick...… I anticipate price to target HTF equilibrium and the Monthly FVG before I look for any buys.

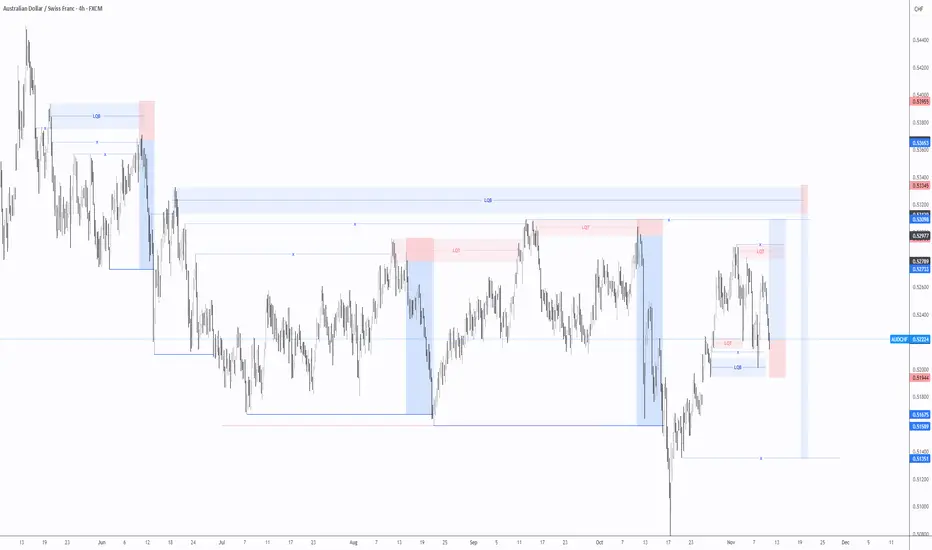
AUDCHF – Building Liquidity Before the Main SetupPrice is currently in a corrective move, trading near 0.52241.
The market is expected to target the liquidity built below 0.52910,
extending toward 0.53098, where the next pool of resting orders is located.
This move represents the liquidity-collection phase before the main setup begins.
Once the 0.53098 zone is reached and liquidity is taken,
I’ll be watching for confirmation inside the unmitigated liquidity block (0.53139 – 0.53324)
to activate the primary short setup.
Corrective Buy Plan:
• Entry: 0.52218
• Stop Loss: 0.51944
• Target: 0.53098
Main Setup (after liquidity sweep):
• Entry: 0.53145 (Sell)
• Stop Loss: 0.53361
• Target: 0.51367
⚙️ Both scenarios are part of my Liquidity Flow Model, which is still under testing and observation.
#AUDCHF #Liquidity
BTCUSD Pre NY SessionThe key target sits at 98.225, marking the next visible liquidiBTCUSD | 7 Nov 2025
Bitcoin traded through the buy-side imbalance on the daily chart and flipped that zone into resistance.
This confirms a Buy-Side Imbalance Flip.
Clear liquidity targets remain below current price.
The key target sits at 98.225, marking the next visible liquidity objective.
Dollar tone stays firm, and risk sentiment remains cautious.
Crypto markets continue to mirror liquidity behavior, not headlines.
Flows remain defensive as participants manage exposure into key levels.
Professionals wait for confirmation when structure shifts.
They don’t react to the first move — they study how price behaves around it.
Patience at structural turns defines consistency.
— CORE5DAN
Institutional Logic. Modern Technology. Real Freedom.ty objective.

BTCUSD — TP1 Hit | Structure Validation Bitcoin tagged its first target at 111,066, wrapping up another disciplined weekend for structured traders.The move is still unfolding, completing the measured leg mapped last week.
Price action remains just behind Thursday’s range as the market quietly fills the week’s single-prints near 111,629.
Technical View
BTC continues to trade inside its mid-range structure.
The current rotation follows a clean, measured rhythm — confirming that prior resistance has been absorbed.
Next focal zone: 111,900, where untested liquidity remains.
A sustained break above that region would signal continuation; a rejection keeps us boxed in for another session.
Macro Overview
Dollar Index (DXY): Holding near 106, giving mild support to risk assets.
Rates: U.S. 10-year yields steady around 4.25 %, showing markets in “wait mode.”
Seasonality: Early November typically brings moderate inflows after October volatility. Expect slower rotations until U.S. sessions return to full volume.
Volume / Flow
Weekend turnover reached roughly $23 billion across BTC pairs — moderate and balanced.
Order flow stayed clean, with no signs of forced liquidation or excess speculation.
Plan
Keep it simple:
111.9 k = magnet zone.
We’re still in range logic — control, not chase.
Note
The system did what it’s designed to do: read rhythm, not emotion.
Institutional Logic. Modern Technology. Real Freedom.

Possible Short Position on GJ we might see a sell off but we still need confirmation so we wait and see how price reacts from that POI

MET (Meteora) - TGE 15m FA/TA, Levels & RiskBias: short-term neutral>bullish if 0.581 holds; mid-term neutral.
Market read:
BTC ≈ $110.6k, ETH ≈ $3.88k, SOL ≈ $193.1. Risk tone modestly positive.
DXY ≈ 99.0; USD/JPY ≈ 152.6; SPY ≈ 671.8; UST 10Y ≈ 4.00%. Liquidity backdrop acceptable.
MET status (T+~13h)
Price ≈ 0.58 with intraday reclaim attempts. Day-one range ~0.516–0.687. Fib from H→L: 0.552 (0.236 up from L), 0.577–0.581 cluster, 0.601, 0.621, 0.646. Your 5–15m charts show RSI>70, MACD crossing up, TRIX rising, DEMA≈0.581 acting as pivot. Expect supply near 0.581/0.597 and heavy inventory 0.55–0.58.
Levels:
Support: 0.566 → 0.559 → 0.545 → 0.515.
Resistance: 0.581 pivot → 0.597–0.601 → 0.621 → 0.646.
Setups and risk (1m/5m/15m/30m)
• Break-retest long: Confirm a 5–15m close ≥0.581, then entry on retest 0.573–0.581. SL 0.566. TP1 0.597–0.601, TP2 0.621, TP3 0.646.
• Fail-reclaim short: If rejection at 0.581 with RSI>75 and waning volume, short perps only; SL 0.586; TP 0.565 then 0.559.
• 30m bias flip: Two consecutive closes ≥0.581 with rising volume/OBV shift bias to constructive; below 0.566 momentum stalls back to 0.559–0.545.
• Execution: post-only limits on Jupiter/Meteora, slippage ≤0.5%. Risk ≤1R per attempt.
FA + flow:
Day-one unlock and broad venue access create two-sided flow; watch Solana beta and CEX listings for impulse. MET’s microcap relative to SOL/JUP/ME/GRASS implies higher variance; treat 0.581 as line-in-the-sand for continuation.
Plan:
If you are flat: only engage on 0.581 hold. If long from lower: trim 25–50% into 0.597–0.601, trail to 0.569, run remainder for 0.621/0.646. If 0.566 breaks on volume, step aside and reassess near 0.559/0.545.
Outlook:
bullish above 0.581 and strengthening into 0.601; neutral-to-bearish on failures back under 0.566.
For educational purposes; not financial advice.

AIAUSDT RINSE OUTEyeing AIA after a 150% move to the upside. Keep an eye on a breakout of those ranges. Potential to send it up once more. Manage Risk Appropriately.

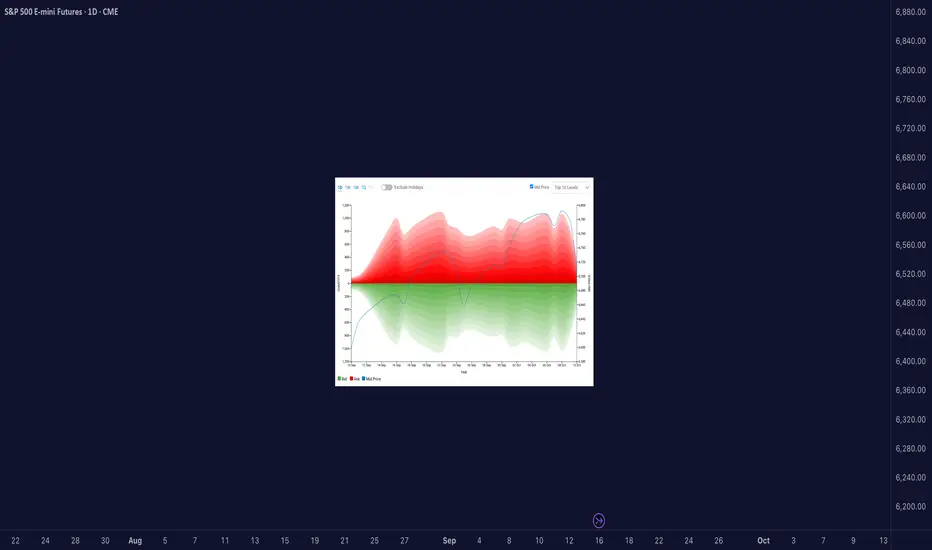
When Liquidity Dried Up — The True Story Behind the Oct 10 Crash█ We Actually Saw It Coming
There were clear signs of potential reversals across major markets before the Friday, October 10, 2025 crash. You can see it in the liquidity heatmaps: Gold, Bitcoin, S&P, and other futures all trading above their top 10 liquidity levels.
When that happens, it’s usually a warning flag. Price is moving into areas with less visible liquidity, meaning fewer resting orders available to absorb aggressive buyers. That’s when the market becomes fragile and doesn’t take much to trigger a sharp reversal.
█ When Price Trades Beyond Visible Liquidity
It’s easy to think big moves happen just because of news, but beneath the surface, microstructure signals often show when markets are already vulnerable.
One of the clearest is when the mid-price extends beyond the visible liquidity, above the top few ask levels or below the top few bid levels in the order book.
Suppose price pushes beyond the visible top levels. In that case, it often means that liquidity was consumed faster than it could replenish, either because aggressive orders cleared it out, or market makers pulled their quotes. That’s when we get what’s called a liquidity vacuum.
Research from the Federal Reserve, Bank for International Settlements, and academic studies (Lo & Hall, 2014; Meldrum & Sokolinskiy, 2025) all point to the same thing:
When order book depth is shallow, markets become more fragile. Prices overreact, spreads widen, and shocks travel faster.
█ What the Heatmap Really Shows
Those heatmaps are a visual snapshot of this structure.
The green and red bands show the depth of buy and sell orders — the liquidity zones.
The blue line is the mid-price — the true current market price.
When the blue line (mid-price) moves above the red zone, it means price has traded beyond the top available asks. That can happen because:
Buyers lifted all nearby sell orders (aggressive buying), or
Sellers pulled liquidity (passive withdrawal).
In both cases, the effect is the same, the book thins out, and volatility risk increases.
Heatmaps don’t show everything though. They don’t reveal:
Hidden or iceberg orders deeper in the book,
Off-exchange liquidity or block trades,
Or how quickly the book replenishes in real time.
But as a visual proxy, they’re incredibly useful for spotting moments when price runs ahead of available liquidity, often right before sharp reversals.
█ Why the Crash Hit So Hard
So while the crash came from unexpected news, the speed of that drop wasn’t random. Markets were already fragile. Liquidity across assets was thin. When the shock hit, there weren’t enough resting orders to slow it down.
Gold, Bitcoin, and S&P futures all had their mid-prices trading above visible liquidity, making them more sensitive to aggressive selling; that’s why the market fell almost simultaneously and so fast.
█ How I Handle These Setups
Whenever I see price trading above visible liquidity, I start managing risk differently. I might keep existing longs, but I won’t add new ones. Instead, I scale out gradually and watch for potential short setups if other signals confirm it.
It’s not about predicting crashes, it’s about recognizing when the market’s structure is fragile.
█ Quick Takeaway
When the mid-price trades above visible liquidity, the order book is telling you something simple but powerful:
“There’s not much support up here.”
That’s often when it pays to get defensive, not aggressive.
Access the CME Liquidity tool at this link
-----------------
Disclaimer
The content provided in my scripts, indicators, ideas, algorithms, and systems is for educational and informational purposes only. It does not constitute financial advice, investment recommendations, or a solicitation to buy or sell any financial instruments. I will not accept liability for any loss or damage, including without limitation any loss of profit, which may arise directly or indirectly from the use of or reliance on such information.
All investments involve risk, and the past performance of a security, industry, sector, market, financial product, trading strategy, backtest, or individual's trading does not guarantee future results or returns. Investors are fully responsible for any investment decisions they make. Such decisions should be based solely on an evaluation of their financial circumstances, investment objectives, risk tolerance, and liquidity needs.
BTCUSD : Internal sell side liquidity built up for mitigationBased on the market structures trend found bullish as the price already broken previous swing high and induced buyers, trap them and started to print downward to collect the internal sell side liquidity already built up within the market structures. Moreover, there is FVG on WTF already formed which yet to be mitigated. There is a high probability that once price mitigates this FVG price is likely to collect buy side liquidity resting near 117960-118600. Let’s allow the price to print near 114000-114400 and watch the price action thereafter.

BTC – Liquidity Grab at $116K Before Deep Correction?Description -
📊 Using the SMC Suite (Order Blocks, Liquidity Sweeps, FVG), BTC is approaching a critical supply zone ($116K–$118K).
• If price taps this orange zone, strong sellers are likely to step in.
• This move may trap late longs and grab liquidity before reversing.
• Downside targets sit around $100K initially, with extended demand near $85K–$80K.
🔑 Key Levels:
• Resistance/Supply: $116K–$118K
• Support/Demand: $100K, $85K–$80K
• Invalidation: Daily close above $122K
⚠️ This is not financial advice — just a liquidity-based interpretation of BTC’s structure .

August 24, Forex Outlook: What Can Traders Expect This Week?Welcome back, traders!
In today’s video, we’ll be conducting a Forex Weekly Outlook, analyzing multiple currency pairs from a top-down perspective—starting from the higher timeframes and working our way down to the lower timeframes.
Pairs to focus on this Week:
USDJPY
USDCAD
EURGBP
EURJPY
GBPCHF
NZDCHF
USDCHF
Our focus will be on identifying high-probability price action scenarios using clear market structure, institutional order flow, and key confirmation levels. This detailed breakdown is designed to give you a strategic edge and help you navigate this week’s trading opportunities with confidence.
📊 What to Expect in This Video:
1. Higher timeframe trend analysis
2. Key zones of interest and potential setups
3. High-precision confirmations on lower timeframes
4. Institutional insight into where price is likely to go next
Stay tuned, take notes, and be sure to like, comment, and subscribe so you don’t miss future trading insights!
Have a great week ahead, God bless you!
The Architect 🏛️📉

What Is an Iceberg Order, and How May It Be Used in Trading?What Is an Iceberg Order, and How May It Be Used in Trading?
An iceberg order is a type of execution strategy that hides the full size of a trade by revealing only small portions at a time. Used by institutions and large traders, it helps reduce market impact. Understanding how iceberg orders work, where they’re used, and their risks can help traders more accurately analyse market activity. This article breaks down everything you need to know about iceberg orders and their role in trading.
What Is an Iceberg Order?
An iceberg order is a type of order designed to execute large trades without revealing the full size to the market. Instead of placing one massive position that could disrupt prices, traders split it into smaller portions, with the rest hidden. As each portion gets filled, the next one is placed automatically until the full order is executed.
The key feature of this type of entry is that only a fraction—known as the display quantity—is visible in the order book at any given time. The rest remains hidden until it’s gradually revealed. This prevents other traders from immediately recognising the true size of the position, which helps avoid unnecessary market movements.
For example, if a trader wants to buy 50,000 shares of a stock, placing the full position in the market at once could cause prices to rise before execution is complete. Instead, they might set an iceberg order with a display size of 5,000 shares. Once the first 5,000 are bought, another 5,000 are automatically placed, repeating until the full 50,000 are executed.
They’re particularly useful for institutional traders, hedge funds, and high-net-worth individuals who want to build or reduce positions without attracting attention. However, some retail traders also use them when executing relatively large trades in markets that support this execution type. Many major exchanges, including those for equities, forex, and futures, allow icebergs, but their availability depends on the broker and trading platform being used.
How Iceberg Orders Work
The main idea of iceberg orders is clear but let’s consider how they work in detail.
Order Execution Process
When a trader places an iceberg order, they specify two key parameters:
Total size – The full amount they want to buy or sell.
Display size – The portion that will be visible at any given time.
For example, if a trader wants to buy 20,000 shares but only wants 500 to be visible at a time, the order book will show just 500 shares. Once those are bought, another 500 will appear at the same price (if still available), and the cycle continues until the entire 20,000 shares are filled.
Dynamic Execution
Some trading platforms and institutional brokers use smart order execution algorithms to optimise how these orders are placed. These algorithms might adjust the display size dynamically based on market conditions, ensuring the order gets executed efficiently without drawing too much attention.
Hidden Portions and Order Book Activity
Although most of the order remains hidden, experienced traders and high-frequency algorithms can sometimes detect iceberg levels. If they notice an order constantly refreshing at the same price level without an obvious large sell or buy position, they may infer that an iceberg is in play.
Where Iceberg Orders Are Most Popular
They are most popular in liquid markets where frequent trading activity allows the hidden portions to be executed smoothly. In less liquid markets, there’s a higher risk that the order will be only partially filled or take longer to execute, making alternative execution strategies more practical.
Why Traders Use Iceberg Orders
Iceberg orders help traders hide their full intentions from the market. Here’s why they’re commonly used:
Reducing Market Impact
When a large position enters the market, it can shift prices before the full trade is completed. This is particularly an issue in less liquid markets, where even moderate positions can cause price swings. By splitting a large trade into smaller, hidden chunks, iceberg orders prevent sudden moves that could work against the trader.
Avoiding Slippage
Slippage occurs when an order is executed at a worse price than expected due to market movement. Large trades placed all at once can exhaust available liquidity at the best price levels, forcing later portions to be filled at less favourable prices. Iceberg orders help mitigate this by allowing the trade to be executed gradually without consuming too much liquidity at once.
Maintaining Discretion
Institutions and high-net-worth traders often prefer to keep their trading activity under the radar. If other market participants see a massive buy or sell entry, they may react by adjusting their own strategies, making it harder for the original trader to get a good price. Icebergs keep most of the position hidden, preventing this from happening.
Reducing the Risk of Front-Running
High-frequency trading firms and aggressive traders actively monitor the order book for large transactions. When they spot them, they may enter positions ahead of the large trade, pushing prices in an unfavourable direction. By keeping most of the trade hidden, iceberg entries make it harder for others to exploit this information.
Identifying Iceberg Orders in the Market
Iceberg orders are designed to be discreet, but experienced traders and algorithmic systems can sometimes detect them by analysing order book activity and price movements. Since only a small portion of the total order is visible at any given time, certain patterns can reveal the presence of an iceberg in action.
Order Book Clues
One of the most obvious signs is a persistent order at the same price level. If a bid or ask keeps refreshing with the same quantity after being partially filled, it may indicate that a much larger hidden position is sitting at an iceberg level. This is particularly noticeable in less liquid markets where large trades are more disruptive.
Another telltale sign is a large trade volume without corresponding large visible orders. If significant buying or selling occurs but the order book only displays small entries, there’s a chance that a hidden order is gradually being executed.
Time and Sales Analysis
Traders can also look at time and sales data, which records every transaction. If the same price level repeatedly absorbs multiple trades without depleting, it suggests a hidden order replenishing itself after each execution.
Algorithmic Detection
Some trading algorithms are specifically designed to identify icebergs. These tools scan for patterns in order execution and attempt to infer hidden liquidity. While not always accurate, they can give traders an idea of when institutional activity is taking place.
Risks and Limitations of Iceberg Orders
While iceberg orders can help traders execute large trades discreetly, they are not without drawbacks. Market conditions, execution risks, and the rise of advanced trading algorithms can all impact their effectiveness.
- Incomplete Execution: If market conditions change or liquidity dries up, part of the position may remain unfilled. This is especially problematic in volatile or low-volume markets where price movements can accelerate unexpectedly.
- Detection by Algorithms: Sophisticated trading algorithms actively scan for hidden orders. High-frequency traders (HFTs) may detect it and adjust their strategies, making it harder to execute at a favourable price.
- Increased Trading Costs: Splitting a large entry into multiple smaller ones can lead to higher transaction costs. Exchanges and brokers may charge fees per executed trade, meaning an iceberg entry could end up costing more than a single bulk position.
- Slower Execution in Fast Markets: When markets move quickly, the visible portions of an iceberg might not fill fast enough before the price changes. This can lead to slippage, where later parts of the order get executed at worse prices than intended.
- Limited Availability: Not all brokers or exchanges support icebergs, particularly in smaller or less liquid markets. Some platforms also impose minimum position size requirements, restricting their use for smaller traders.
The Bottom Line
Iceberg orders enable traders to execute large trades discreetly, minimising market impact and enhancing execution quality. While they offer advantages in managing liquidity, they also carry risks such as detection by advanced algorithms and potential slippage. Traders should exercise caution and conduct thorough market analysis.
FAQ
What Is an Iceberg Order?
An iceberg order is a type of order that splits a large trade into smaller visible portions, with the remaining size hidden from the order book. As each visible portion is filled, the next one is automatically placed until the full order is executed. This helps traders avoid moving the market or revealing their full position size.
How Do You Identify an Iceberg Order?
Traders can spot icebergs by looking for repeated small trades at the same price level. If an order keeps refreshing after partial fills without a visible large order in the book, it may indicate hidden liquidity. Time and sales data, as well as algorithmic tools, can help detect these patterns.
What Is the Difference Between an Iceberg Order and a Basket Order?
An iceberg order breaks a single large entry into smaller, hidden parts, while a basket order consists of multiple different trades executed together, often across various assets or instruments. Basket orders are used for portfolio adjustments, whereas iceberg entries focus on reducing market impact.
What Is an Iceberg Order in Crypto*?
In crypto* markets, iceberg entries function the same way as in traditional markets—hiding large trades to prevent price fluctuations. Many exchanges offer this feature, particularly for institutional traders handling large positions.
How Do I Place an Iceberg Order?
Availability depends on the broker or exchange. Traders typically set the total position size and the visible portion, allowing the system to execute the trade in smaller segments.
What Is the Iceberg Order Strategy?
The strategy involves using iceberg orders to accumulate or distribute large positions without drawing attention. It helps reduce slippage, maintain discretion, and avoid triggering unnecessary price movement.
*Important: At FXOpen UK, Cryptocurrency trading via CFDs is only available to our Professional clients. They are not available for trading by Retail clients. To find out more information about how this may affect you, please get in touch with our team.
This article represents the opinion of the Companies operating under the FXOpen brand only. It is not to be construed as an offer, solicitation, or recommendation with respect to products and services provided by the Companies operating under the FXOpen brand, nor is it to be considered financial advice.

GBPCADDate:
August 18, 2025
Session:
Asia Session
Pair:
GBPCAD
Bias:
Short
Liquid from last week lies it should sweep those pools
this week.
Entry:1.86448
Stop Loss:1.86761
Target:1.84527
RR:6.21

XRP Pullback Play — 0.786 Fib Meets Sell-Side LiquidityXRP is currently in a pullback phase. The next high-probability long setup is at the 0.786 Fibonacci retracement, aligning with a Sell-Side Liquidity (SSL) zone.
🟢 Long Trade Setup
Entry Zone: 0.786 retracement
Stop-Loss: Below $2.80
Take-Profit 1: $3.00 (mOpen)
💡 Educational Insight
Sell-Side Liquidity (SSL) represents the pool of stop-losses and pending buy orders resting below recent swing lows. Price often seeks these liquidity pockets before reversing.
The 0.786 retracement aligns with this SSL zone, creating a high-probability setup.
However, confirmation should come from order flow → monitoring absorption, delta shifts, or footprint imbalances at this level will validate whether buyers are stepping in before entering.
🔍 Indicators used:
DriftLine — Pivot Open Zones → For identifying key yearly/monthly/weekly/daily opens that act as major S/R reference points
➡️ Available for free. You can find it on my profile under “Scripts” and apply it directly to your charts for extra confluence when planning your trades.
_________________________________
💬 If you found this helpful, drop a like and comment!

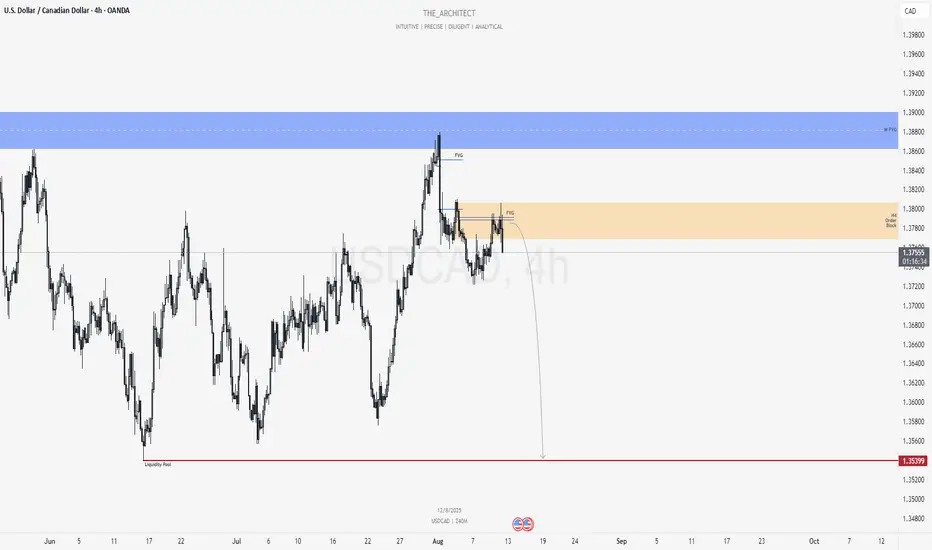
USDCAD: Bearish Continuation Setup from Premium SupplyGreetings Traders,
In today’s analysis of USDCAD, recent price action confirms the presence of bearish institutional order flow. This reaffirms our downside bias and positions us to seek high-probability selling opportunities.
Key Observations on H4:
Weekly Fair Value Gap Rejection: Last week, price rejected a weekly bearish FVG, aligning with the higher timeframe bearish draw toward discount liquidity.
Bearish Market Structure Shift: The H4 chart confirmed a market structure shift to the downside, signaling institutional alignment with the weekly timeframe.
Premium Bearish Order Block Confluence: Price has retraced into a premium-priced H4 bearish order block, which overlaps with an FVG—creating a strong institutional resistance zone.
Trading Plan:
Entry Strategy: Monitor lower timeframes (M15 and below) for bearish confirmation entries within the confluence zone.
Target Objective: Aim for the liquidity pools resting in discount pricing, in line with the overall bearish narrative.
For a detailed market walkthrough and in-depth execution zones, be sure to watch this week’s Forex Market Breakdown:
As always, remain patient, wait for confirmation, and manage your risk with precision.
Kind regards,
The Architect 🏛️📉
Cable & Fibre!So, generally I'm happy with the way the market is going. Though a little bit uncertain about how high it wants to go before it resumes its downward spiral, things are going good so far.
Looking at Cable, on an hourly chart, we see that between 06:00 am and 08:00 am (New York Time), there is FVG formed and to its left, there is a breaker. This a perfect setup for me, but I will wait to see if price actually wants to go above the 1.3477 level to reach for the 4H as well as 1H FVG.
I've put a sell limit on the fibre at 1.1635, but I will remove it for now, 'till I have confirmed whether price will go above 1.1698 level, to go into the 4H FVG, the mid-point thereof. I have a sell limit there with a stop loss at .1745.

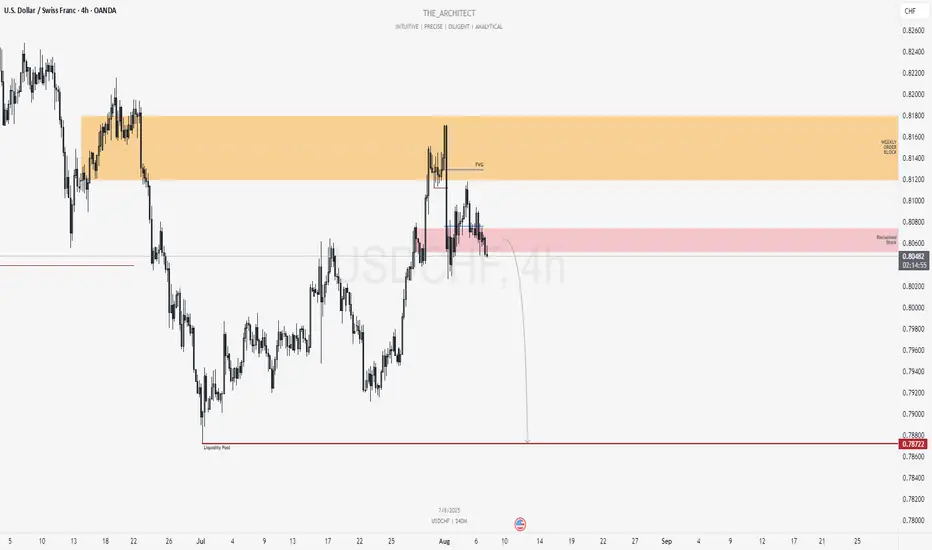
USDCHF: Bearish Continuation Setup From Reclaimed Supply ZoneGreetings Traders,
In today’s analysis of USDCHF, recent price action confirms the presence of bearish institutional order flow. This reinforces our directional bias to the downside, prompting us to focus on strategic selling opportunities.
Key Observations on H4:
Weekly Bearish Order Block: Price recently tapped into a weekly bearish order block, which triggered a decisive market structure shift to the downside. This confirms the order block's validity as a firm resistance zone.
Bearish Fair Value Gap (FVG): Following the market structure shift, price retraced into an H4 FVG. This zone acted as resistance, maintaining bearish momentum.
Reclaimed Mitigation Block: After breaking through a previous mitigation block, the area now functions as a reclaimed order block. We expect this to serve as a high-probability resistance zone moving forward.
Trading Plan:
Entry Strategy: Monitor lower timeframes (M15 and below) for confirmation entries within the reclaimed order block.
Target Objective: The current draw on liquidity is the discount-side liquidity pools, which aligns with our bearish bias.
As always, remain patient, wait for solid confirmations, and manage your risk with precision.
Kind regards,
The Architect 🏛️📉