Eli Lilly up and up. LLYShort term and temporarily.
Immediate targets 257, 263, 272. Invalidation 232.
We are not in the business of getting every prediction right, no one ever does and that is not the aim of the game. The Fibonacci targets are highlighted in green with invalidation in red. Fibonacci goals, it is prudent to suggest, are nothing more than mere fractally evident and therefore statistically likely levels that the market will go to. Having said that, the market will always do what it wants and always has a mind of its own. Therefore, none of this is financial advice, so do your own research and rely only on your own analysis. Trading is a true one man sport. Good luck out there and stay safe
LLY

$BIIB: Update, get long!I think it warrants making a new publication here, $BIIB has flashed a buy signal with tremendously good reward to risk, as it can resume the long term trend that can take it over $1600-2600 over time. Phase 3 clinical trials have gone really well for their Alzheimer's treatment 'Aduhelm', putting it in line with results obtained by $LLY's drug 'Donanemab'. I was long $LLY and have been trading in and out of $BIIB trying to time the end of the long slide since the FDA approval news came out. I think the time is now, to get in and sit tight. I've banked my $LLY exposure, but both companies will likely do well with their Alzheimer's treatments going forward and have solid trends, but the reward to risk favors $BIIB, so I'm only long Biogen currently.
Best of luck!
Cheers,
Ivan.

Flat on Eli Lilly. LLYWe are not in the business of getting every prediction right, no one ever does and that is not the aim of the game. The Fibonacci targets are highlighted in purple with invalidation in red. Fibonacci goals, it is prudent to suggest, are nothing more than mere fractally evident and therefore statistically likely levels that the market will go to. Having said that, the market will always do what it wants and always has a mind of its own. Therefore, none of this is financial advice, so do your own research and rely only on your own analysis. Trading is a true one man sport. Good luck out there and stay safe!

LLY Long Opportunity LLY has provided a nice long opportunity with the recent break above the major trendline
This breakout is comparable to a previous point, which led to a large megaphone price structure
Price will likely stay above the trendline and climb within the megaphone (attempted to roughly sketch what it would look like)

LLY - STOCKS - 21. OCT. 2021Welcome to our Weekly V2-Trade Setup ( LLY ) !
-
4 HOUR
Small pullback towards previous sr level.
DAILY
Expecting more bullish pa!
WEEKLY
Overall great market structure.
-
STOCK SETUP
BUY LLY
ENTRY LEVEL @ 241.21
SL @ 231.90
TP @ Open
Max Risk: 0.5% - 1%!
(Remember to add a few pips to all levels - different Brokers!)
Leave us a comment or like to keep our content for free and alive.
Have a great week everyone!
ALAN

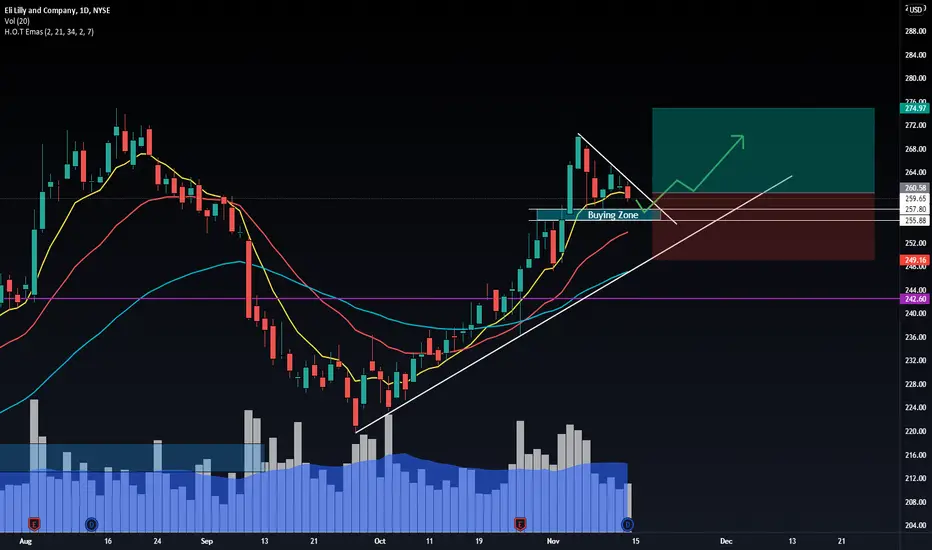
LLY trianglePulling back towards a potential buying zone ( 257.80 - 255.85)
Below that area we have a trendline that could also offer support.
Will wait for either a rejection off the buying zone or a break of the triangle
$LLY Bullish Pennant, Unusual Options Activity$LLY Bullish Pennant, Unusual Options Activity
$360M of January'22 deep in-the-money calls bought today (8-9x open interest)
On watch for a daily close outside the pennant (topside).
Near term target: $300-$310 range possible by early December
Note: This is NOT investment advice.

LLY moving to the top of this range.Just like my last post this is highlighting LLY moving up. Just with arrows this time lol

LLY moving to the top of this range.Looks as though it is moving to the top of the range I provided.

LLY longEntry price: 243-245$
Target price: 283$
Stop loss: 240-243$
Bollinger Bands: The price is under the lower band.
RSI: Indicator crossed the 30 level, therefore the assets is oversold.
Conclusions: RSI and Bollinger Bands suggests upcoming trend reversal. However the price already crossed the 1.618 Fibonacci Retracement level, thus the entry price is recommended above that line with the stop loss under 243$ in case of continuation of the trend and retesting the new resistance level at that point.
Above information should be treated in informative/education purpose, no financial advice.

CHWY Post ER Run?CHWY Daily TF
Broke the downtrend and forming nice channel up. Trading above the 20/50 day ema. Ideally would like to see a a dip to 75-76 retesting bottom channel line for a dip entry but break of 81 looking at 86.
Targets: 81,86, 93

LLY - Bullish Momentum BuildingLLY appears to have support holding. And a minor resistance trend line breakout.
See chart for target and stop loss
Ely Lilly: Testing the Bear Algorithm (Entry 1)I've developed a bearish algorithm/screener that screens for stocks with identified selling pressure / trend followed by a dead cat bounce that is likely to fail - which we will attempt to short. I'm trying to combine trend following and VFI trading principles for the coming bear market.
Components:
1. 200 EMA: below current market price (this is so we don't get stuck in short squeezes and such)
2. 50 day moving average above current market price (we want past clearly identified weakness over a sufficiently long period)
3. 10 day moving average below current price (we want a stock that has attempted to rally from the lows)
4. CMF<-0.1 (we want to screen out bottoming patterns such as Inverse Head and Shoulders whenever we can)
5. Moving Averages Ratings: Buy, Neutral, Sell - we don't anything with strong MA momentum indicators, and we don't want to be short squeezed.
6. Market Cap, Price, volume requirements


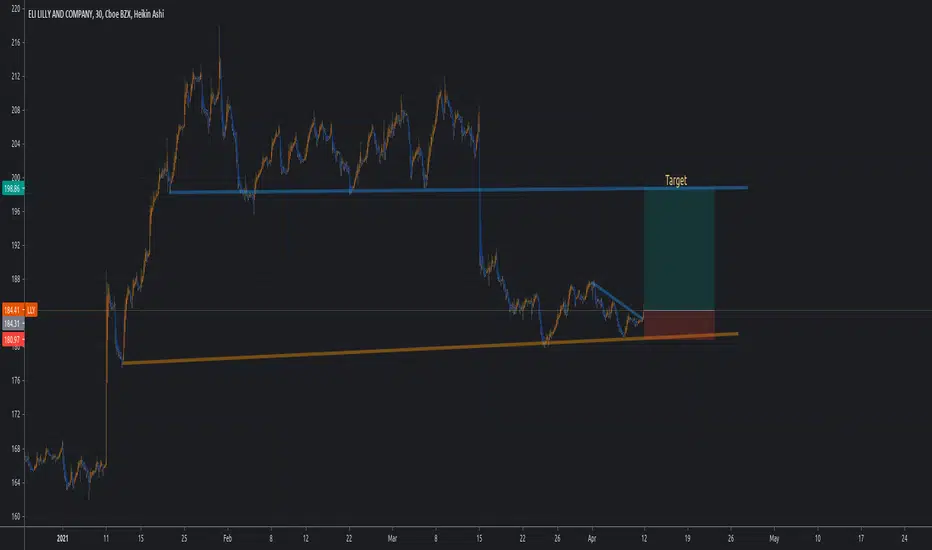
Bearish flagI always try to present the charts in a simple comprehensive format to prevent any confusion.
This is just my technical view, neither a fundamental comment,nor a recommendation to trade..!
Please review my track record and calculate the odds for yourself..!
You’re likes and comments encourage me to continue this.
Stay tuned great live stream and quality content videos coming soon..!

Why buy LLYLLY why is in striking distance of highs also is very consolidated on the daily chart. with Q4 earnings are great. Over all earnings are strong with alot of demand for its COVID product.
207.5 buy point with about 25 point for growth.

ELI LILLY AND COMPANYELI LILLY AND COMPANY short and target is demand area stop loss is up supply area close one hour .
thanks .....

Added to LLYI am a long term investor in LLY for many years along with a swing trade turned into a long term hold from back in November. Today there was a nice pullback from the post-Earnings retracement for an addition.


Long | LLYNYSE:LLY
Possible Scenario: LONG
Evidence: Price Action
This is my idea and could be wrong 100%.
11:30 InflectionsYears ago when I was learning to trade and studying under my mentor he told me that day trading was best done in just the 90 minutes from 10:00am EST to 11:30am EST. This makes a lot of sense.
The 9:30am to 10:00am opening time is very volatile for stocks. Traders are rushing to open or close positions before many have made their decisions to put orders into the book so price can swing wildly. This could present opportunities if one were on the right side of them but finding consistency within this time gap is more challenging.
Around 11:30am is getting close to lunch hour but more importantly when the European markets close. The logic is that trading is about to decrease as traders take a break. More importantly though with the close of Europe there will be less volume coming from across the pond.
In my Discord I have often been asked "when should I take profit???" which is a question I always avoid. Every trader is responsible for their own trades. When this question comes up though I will share the wisdom of my years which is "look for an exit around 11:30am". "Not always" but "often enough" this is where price will tend to do an inflection. It is a simple timing mark to watch and it does in fact work as a good guideline.
NYSE:LLY was a good example of this. The 11:30am timing element was amplified by the fact that it was also a Friday meaning not only was Europe closed for the day but also closed for the week. LLY is an international company so there was undoubtedly international trading going on with the stock.
Now that you've seen it remember to take note of this timing element in your own trading!

Another 50% ExampleThe beauty of studying price action is that a trader can apply their skills to ANY instrument, timeframe, and market. Just as the 50% retracement works in cryptocurrency it of course works in stocks. This happens to be a trade that I was able to catch. It took more than a day to trigger when NYSE:LLY pulled back to the 50% retracement for a 4th time. A very clear level for an entry and set point of risk makes for a great trade off the level!

