XAUUSD Demand Holding - Resistance Retest in PlayHello traders! Here’s my technical outlook on Gold (XAUUSD, 4H) based on the current chart structure. After a strong bullish impulse from the 3,650–3,700 area, price formed a clear ascending channel, respecting both rising support and resistance. Higher highs and higher lows continue to confirm bullish market control. Previously, Gold reached the Seller Zone around 4,360–4,380, where price entered consolidation and later turned lower. Selling pressure weakened near the 4,270 level, allowing buyers to step back in. Price then broke above 4,270, flipping it from resistance into support and signaling a bullish market structure shift. A corrective pullback followed into the Buyer Zone at 4,260–4,280, aligning with previous resistance turned support and the lower boundary of the ascending channel. Buyers successfully defended this area, keeping the bullish structure intact. Currently, price is consolidating below the Seller Zone (4,360–4,380), showing accumulation rather than strong rejection. My scenario: as long as price holds above the Buyer Zone (4,260–4,280), Gold may continue higher toward the Seller Zone / TP1. A clean breakout above resistance would open the door for further upside, while a failure to hold support could lead to a deeper corrective move. For now, the bias remains bullish. Please share this idea with your friends and click Boost 🚀
Long!!!!

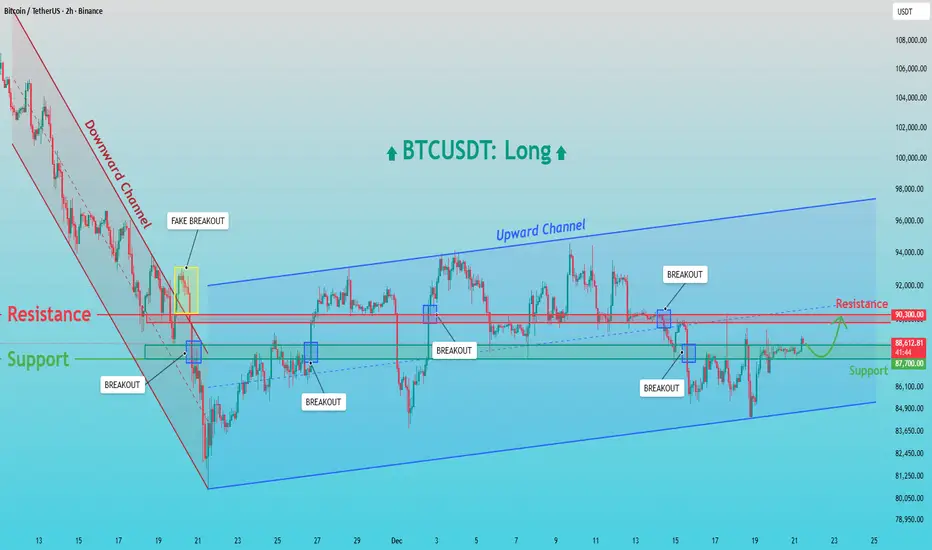
BTCUSDT: Holds Demand - Retest of 90,300 Resistance LikelyHello everyone, here is my breakdown of the current BTCUSDT setup.
Market Analysis
BTCUSDT recently transitioned from a strong downward channel into a broader bullish recovery phase. After a prolonged bearish move, price formed a base near the channel low, where selling pressure weakened. This led to a breakout from the downward channel; however, the first move above resistance resulted in a fake breakout, indicating that sellers were still active at that level. Following this, Bitcoin found strong demand around the 87,000 Support Zone, where buyers stepped in aggressively. From this area, price began to form higher lows and successfully established an ascending (upward) channel, signaling a shift in short-term market structure toward bullish control. Within this upward channel, BTC experienced several clean breakouts above intermediate resistance levels, confirming improving momentum. The key horizontal level around 90,300 acted as a major resistance, where price was rejected multiple times. Despite these rejections, the market did not break down sharply, suggesting absorption of selling pressure rather than distribution.
Currently, BTCUSDT is pulling back toward the 87,000 Support Zone, which aligns with previous resistance turned support and the lower boundary of the upward channel. Price action here remains constructive, with consolidation rather than impulsive selling, indicating that the move lower is corrective.
My Scenario & Strategy
My primary scenario remains bullish as long as BTC holds above the 87,000 support. This zone is a key demand area, and a strong reaction from here could lead to another attempt toward the 90,300 Resistance and a continuation within the upward channel. A confirmed breakout and acceptance above the 90,300 level would open the door for further upside toward higher channel targets.
However, a failure to hold the 87,000 Support Zone would signal weakness and could trigger a deeper correction toward the lower channel boundary. For now, the market structure favors long positions, with support holding and resistance as the next upside objective.
That's the setup I'm tracking. Thank you for your attention, and always manage your risk.
EURUSD Breakout and Potential RetraceHey Traders, in today's trading session we are monitoring EURUSD for a buying opportunity around 1.17200 zone, EURUSD was trading in a downtrend and successfully managed to break it out. Currently is in a correction phase in which it is approaching the retrace area at 1.17200 support and resistance area.
Trade safe, Joe.

BTCUSDT Long: Demand at 88K Could Fuel a Move to $92,700Hello traders! Here’s a clear technical breakdown of BTCUSDT based on the current chart structure. Bitcoin recently completed a prolonged move lower within a well-defined descending channel, confirming strong bearish pressure during that phase. This bearish structure remained intact until price reached a key pivot low, where selling momentum clearly weakened. After the initial impulsive move higher, BTC tested the 92,700 Supply Zone, where temporary rejection occurred. This reaction resulted in several pullbacks toward the 88,000 Demand Zone, which aligns with previous resistance turned support and the lower boundary of the ascending channel. Each pullback into this demand area was met with buying interest, indicating absorption rather than distribution.
Currently, price is stabilizing above the 88,000 Demand Zone, and the pullbacks remain corrective in nature. Multiple minor breakouts along the channel support further confirm that buyers continue to defend structure. The market is consolidating while maintaining bullish alignment.
My scenario: as long as BTCUSDT holds above the 88,000 Demand Zone, the bullish structure remains intact. A strong reaction from this area could lead to another attempt toward the 92,700 Supply / Resistance Zone. A confirmed breakout and acceptance above 92,700 would open the door for further upside continuation within the ascending channel. Only a decisive breakdown below demand would invalidate the bullish scenario. For now, the bias remains bullish, with buyers in control while price respects the ascending channel. Manage your risk!

GBPUSD is Nearing an Important Support Area!!Hey Traders, in tomorrow's trading session we are monitoring GBPUSD for a buying opportunity around 1.33250 zone, GBPUSD is trading in an uptrend and currently is in a correction phase in which it is approaching the trend at 1.33250 support and resistance area.
Trade safe, Joe.

EURUSD Holds Demand - Retest of 1.1760 Resistance LikelyHello traders! Here’s my technical outlook on EURUSD based on the current chart structure. After a prolonged bearish phase inside a descending channel, EURUSD found a solid base near the lower boundary, where selling pressure weakened and price turned around. This reversal led to a clean breakout above the descending resistance, signaling a shift in market structure from bearish to bullish. Following the breakout, price moved higher but entered a corrective phase, forming a series of pullbacks while maintaining higher lows. As momentum rebuilt, EURUSD broke above the key horizontal level and accelerated into an ascending channel, confirming bullish continuation. Price then pushed into the Seller Zone near 1.1760, where a fake breakout occurred — indicating strong supply but not a full trend reversal. After this rejection, the pair pulled back into the Buyer Zone around 1.1700–1.1720, which aligns with previous resistance turned support and the lower boundary of the ascending structure. Currently, EURUSD is holding above the support level, suggesting that the pullback remains corrective. Buyers continue to defend this zone, keeping the bullish structure intact. My scenario: as long as price holds above the 1.1700 Buyer Zone, EURUSD may bounce and make another attempt toward the 1.1760 Resistance / TP1. A confirmed breakout and acceptance above this level would open the door for further upside continuation. A failure to hold support, however, could lead to a deeper correction within the structure. For now, the bias remains bullish, with support holding and resistance as the main upside target. Please share this idea with your friends and click Boost 🚀

EURAUD Will Go Up From Support! Long!
Here is our detailed technical review for EURAUD.
Time Frame: 4h
Current Trend: Bullish
Sentiment: Oversold (based on 7-period RSI)
Forecast: Bullish
The market is trading around a solid horizontal structure 1.768.
The above observations make me that the market will inevitably achieve 1.776 level.
P.S
Please, note that an oversold/overbought condition can last for a long time, and therefore being oversold/overbought doesn't mean a price rally will come soon, or at all.
Like and subscribe and comment my ideas if you enjoy them!

USDCHF What Next? BUY!
My dear friends,
USDCHF looks like it will make a good move, and here are the details:
The market is trading on 0.7933 pivot level.
Bias -Bullish
Technical Indicators: Supper Trend generates a clear long signal while Pivot Point HL is currently determining the overall Bullish trend of the market.
Goal - 0.7953
About Used Indicators:
Pivot points are a great way to identify areas of support and resistance, but they work best when combined with other kinds of technical analysis
Disclosure: I am part of Trade Nation's Influencer program and receive a monthly fee for using their TradingView charts in my analysis.
———————————
WISH YOU ALL LUCK

NZDUSD My Opinion! BUY!
My dear subscribers,
This is my opinion on the NZDUSD next move:
The instrument tests an important psychological level 0.5755
Bias - Bullish
Technical Indicators: Supper Trend gives a precise Bullish signal, while Pivot Point HL predicts price changes and potential reversals in the market.
Target - 0.5771
About Used Indicators:
On the subsequent day, trading above the pivot point is thought to indicate ongoing bullish sentiment, while trading below the pivot point indicates bearish sentiment.
Disclosure: I am part of Trade Nation's Influencer program and receive a monthly fee for using their TradingView charts in my analysis.
———————————
WISH YOU ALL LUCK

EURUSD Set To Grow! BUY!
My dear subscribers,
EURUSD looks like it will make a good move, and here are the details:
The market is trading on 1.1709 pivot level.
Bias - Bullish
My Stop Loss - 1.1702
Technical Indicators: Both Super Trend & Pivot HL indicate a highly probable Bullish continuation.
Target - 1.1722
About Used Indicators:
The average true range (ATR) plays an important role in 'Supertrend' as the indicator uses ATR to calculate its value. The ATR indicator signals the degree of price volatility.
Disclosure: I am part of Trade Nation's Influencer program and receive a monthly fee for using their TradingView charts in my analysis.
———————————
WISH YOU ALL LUCK

USOIL Is Bullish! Long!
Take a look at our analysis for USOIL.
Time Frame: 1D
Current Trend: Bullish
Sentiment: Oversold (based on 7-period RSI)
Forecast: Bullish
The market is on a crucial zone of demand 56.495.
The oversold market condition in a combination with key structure gives us a relatively strong bullish signal with goal 60.210 level.
P.S
Please, note that an oversold/overbought condition can last for a long time, and therefore being oversold/overbought doesn't mean a price rally will come soon, or at all.
Like and subscribe and comment my ideas if you enjoy them!

fundamental NIKE analysis suggest long term upAfter massive price decrease NIKE is at a good level to buy into. Fundamentals are ok while the price dropped significantly. Showing negative correlation between low price and ok fundamentals.

USDCHF Will Move Higher! Buy!
Here is our detailed technical review for USDCHF.
Time Frame: 1h
Current Trend: Bullish
Sentiment: Oversold (based on 7-period RSI)
Forecast: Bullish
The market is approaching a significant support area 0.794.
The underlined horizontal cluster clearly indicates a highly probable bullish movement with target 0.795 level.
P.S
Overbought describes a period of time where there has been a significant and consistent upward move in price over a period of time without much pullback.
Like and subscribe and comment my ideas if you enjoy them!

Russell 2000 ~ Breakout Confirmed 3,000 Target On TrackRussell 2000 Technical Update
The Russell 2000 breakout from its multi year consolidation remains intact and is now confirmed by multiple monthly closes above former resistance. The anticipated pullback has played out as expected, providing validation of the breakout structure and keeping the measured move toward the 3,000 area firmly in play.
This update reviews what has developed since the original breakout signal and why the next leg higher remains the dominant path.
What Has Developed Since the Breakout
In October, the Russell 2000 recorded a monthly close above the November 2021 highs near the 2,450 area. This marked a confirmed breakout from a five year consolidation range.
At the time, a pullback to retest former resistance as support was expected. That scenario unfolded precisely.
Price retraced into the 2,280 to 2,350 zone, aligning with the 0.5 to 0.618 Fibonacci retracement levels. Buyers stepped in at support, and November closed back above the breakout level. December has continued to hold above this zone, reinforcing the validity of the move.
Two consecutive monthly closes above a five year resistance level typically signal institutional participation rather than a short term false breakout.
Current Technical Structure
Breakout Confirmation
Monthly closes remain above former resistance near 2,350. This area now acts as structural support.
Fibonacci Alignment
The pullback tested the 0.236 retracement near 2,280 and held. Price is currently trading above the 0.236 retracement, reinforcing bullish structure.
Trend Conditions
Long term moving averages are rising beneath price. Higher lows continue to form on the monthly timeframe. Volume has expanded on advances, supporting the breakout.
The initial breakout phase is complete. Price is now transitioning into the continuation phase.
Why the 3,000 Target Remains Valid
Measured Move Projection
The five year range spans roughly 1,640 to 2,481. Projecting this range from the breakout level produces an upside target above 3,300.
Conservative Targeting
Using approximately 80 percent of the measured move yields a zone near 3,150. Rounding to 3,000 provides a conservative target that accounts for volatility and market noise.
Fibonacci Extensions
Higher timeframe Fibonacci extensions cluster between 3,200 and 3,300, reinforcing the broader target zone.
From current levels near 2,400, the move to 3,000 represents approximately 25 percent upside.
Review of the November Pullback Entry
The outlined plan called for a pullback into the 2,280 to 2,350 area with invalidation below 2,150.
Price reached 2,282 in November, directly into the projected support zone. Buyers defended the level, price rebounded, and structure remained intact.
Risk to reward at entry was approximately 5 to 7 percent risk for 25 to 30 percent potential upside, producing a favorable asymmetric profile.
Why This Move Is Still Early
Cycle Timing
The breakout occurred recently on a monthly timeframe. Large structural breakouts often take 12 to 18 months to reach measured targets.
Institutional Rotation
Small caps underperformed for several years. Capital rotation into this segment typically unfolds gradually, not in a single move.
Participation Profile
Retail participation remains focused on large cap technology. Breakouts that are not yet widely discussed often offer the best continuation potential.
The breakout is confirmed, but it is not yet fully recognized.
Macro Environment
Interest Rate Outlook
Falling or stabilizing rates tend to favor small caps due to their higher sensitivity to financing costs.
Economic Backdrop
The absence of recession supports domestically focused companies that dominate the Russell 2000.
Valuation Context
Small caps continue to trade at a valuation discount relative to large caps, creating room for multiple expansion.
Technical structure and macro conditions are currently aligned.
Risk On Correlation With Crypto
Historically, sustained Russell 2000 breakouts coincide with improving liquidity conditions. These environments often support digital asset strength.
Bitcoin has already advanced meaningfully since the Russell held its breakout. Continued small cap strength would support a broader risk on regime.
This relationship is contextual rather than predictive and should be monitored rather than assumed.
Positioning Framework
Exposure Options
IWM ETF, RTY futures, or structured options depending on experience and risk tolerance.
Risk Management
A monthly close below 2,280 would weaken the breakout thesis. The 3,000 area remains the primary target, with 3,200 as an extended objective.
Time Horizon
This structure favors a medium to long term outlook rather than short term trading.
Monthly closes carry more weight than daily volatility.
Invalidation Risks
• Monthly close below 2,280
• Macro driven risk off events
• Unexpected policy tightening
• Broad market trend deterioration
If invalidated, losses remain defined and manageable relative to upside potential.
Psychology of Structural Breakouts
Early stages feel uncertain. Confirmation feels uncomfortable. Obvious trends tend to appear near the latter stages of a move.
This breakout is confirmed, but not yet crowded.
Summary
• Five year breakout confirmed with multiple monthly closes
• Support held at the anticipated retracement zone
• Measured move targets 3,000 to 3,200
• Upside approximately 25 to 30 percent from current levels
• Risk remains defined below structural support
The most difficult part of the trade was the breakout itself. The market is now in the follow through phase.
Important Disclaimer
This analysis is for educational purposes only and does not constitute financial advice. All markets involve risk, and technical patterns can fail. Always apply appropriate risk management, conduct independent research, and trade in alignment with your risk tolerance.

CADCHF: Bulls Will Push Higher
It is essential that we apply multitimeframe technical analysis and there is no better example of why that is the case than the current CADCHF chart which, if analyzed properly, clearly points in the upward direction.
Disclosure: I am part of Trade Nation's Influencer program and receive a monthly fee for using their TradingView charts in my analysis.
❤️ Please, support our work with like & comment! ❤️

EURGBP Massive Long! BUY!
My dear friends,
My technical analysis for EURGBP is below:
The market is trading on 0.8753 pivot level.
Bias - Bullish
Technical Indicators: Both Super Trend & Pivot HL indicate a highly probable Bullish continuation.
Target - 0.8766
About Used Indicators:
A pivot point is a technical analysis indicator, or calculations, used to determine the overall trend of the market over different time frames.
Disclosure: I am part of Trade Nation's Influencer program and receive a monthly fee for using their TradingView charts in my analysis.
———————————
WISH YOU ALL LUCK

EURUSD: Bullish Continuation is Expected! Here is Why:
The analysis of the EURUSD chart clearly shows us that the pair is finally about to go up due to the rising pressure from the buyers.
❤️ Please, support our work with like & comment! ❤️

ETH - at $8,000 – the biggest review on TradingView.COINBASE:ETHUSD BINANCE:ETHUSD CRYPTO:ETHUSD
Why will ETH cost $8,000? Let's figure it out.
The most comprehensive analysis of Ethereum on the TradingView platform. Cycles, metrics, patterns, technical analysis.
Let's break down the price of Ethereum by year, go back in time and use the PoC (Point of Control) tool to determine the bottom of each time period.
Let's switch to a weekly timeframe and drag the POC to April 2025 - what was the reaction from this level? Absolutely - long.
Next, we move closer to the current year. We pull up the PoC and see the following information: we are already close to the PoC level (at which there will be a 100% reaction!).
Now we start measuring everything by volatility (including time frames) and get the following picture.
I took into account all the momentum and time frames. I got a picture that, the cost of Ethereum by mid-2026 to early 2027 will be around $8,000.
ETH is currently forming a base, and it will continue to do so within this range (from $2,100 to $3,400).
Rising lows on the weekly timeframe:
Breaking through the daily downward trend line and testing it:
Bullish divergences on the daily timeframe:
Let's take a look at what Ethereum looks like on a weekly timeframe.
It's a large, huge 5-year sideways movement
Monthly timeframe:
Don't you think that the ETH has been drawing a beautiful structure for the past five years? The lows have been rising over the years! This is not a local 4-hour or daily timeframe, it is a monthly timeframe.
This tells me a lot.
A clear structure of an ascending triangle.
That's absolutely right. Important: That is not small timeframes, that is higher ones (weekly, monthly) - that says a lot! The higher timeframe always takes priority.
Let's move on to the metrics:
ETH.D - dominance, % of Ethereum's dominance over the entire crypto market.
What do we see? We are at the lower range, and there is enormous chance for growth.
ETHBTC — Ethereum/Bitcoin pair. The picture is similar. We see that we are at the lower limit. There is chance for growth.
USDT.D — stablecoin dominance in the current market phase. Weekly timeframe. Already in the overheated zone according to RSI. This means that in the coming months, the market will take a breath of fresh air, and stablecoins will pour into assets.
Conclusion:
- PoC zones. Globally, values are close to the bottom.
- Volatility confirming long-term growth prospects.
- Rising lows on the weekly TF along the trend. UP trend.
- Currently testing the daily trend (all locally).
- Bullish divergences on the daily timeframe, historically UP.
- Ascending triangle (weekly, 1-month timeframe).
- ETH dominance - practically at the bottom.
- ETH/BTC price - there is chance for growth.
- Cash dominance in the market is at a high level.
Historically, a fall in cash dominance in the market means UP (cash does not wait, cash flows into assets).
Of course, this is not financial advice or a recommendation. However, based on all the data, it is worth actively accumulating ETH at current prices ranging up to $2,100 per Ethereum coin.
As a bonus, here's a little psychology. The greed and fear index is at a critical point. Everyone is scared and uncertain. Historically, this is the best time to buy assets.
Ethereum: 2100-3000$
As a bonus, here's a little psychology. The greed and fear index is at a critical point. Everyone is scared and uncertain. Historically, this is the best time to buy assets.
Greed and Fear Index: 11

Extreme long on $TWTWe have formed a triangle after an upward movement. This usually occurs in the final move of wave V. We will review the chart if wave C is broken. So far, the scenario remains fully valid.
1 to 10 RR

Long Idea ON $MNTWe are currently in a downtrend from $2.87. This rise is therefore a correction within the overall falling trend. According to wave analysis, the potential target is $1.80, which gives a risk/reward ratio of approximately 1:2.5 or higher (depending on where you set your stop-loss). The setup remains valid until the high around $2.87 is updated.
Remember to manage your risks.

NZD/CHF BULLISH BIAS RIGHT NOW| LONG
Hello, Friends!
NZD/CHF is trending up which is evident from the green colour of the previous weekly candle. However, the price has locally plunged into the oversold territory. Which can be told from its proximity to the BB lower band. Which presents a beautiful trend following opportunity for a long trade from the support line below towards the supply level of 0.466.
Disclosure: I am part of Trade Nation's Influencer program and receive a monthly fee for using their TradingView charts in my analysis.
✅LIKE AND COMMENT MY IDEAS✅

BTC – Weak Rebound Below EMAs, Bias Still Toward CorrectionHello everyone, Domic here.
Looking at BTC on the H4 timeframe right now, the overall feeling is not panic — but there is certainly nothing reassuring either. Price is trading around 85,700 USD, sitting firmly below both the EMA34 and EMA89, and that alone already says a lot about the current market condition.
Since mid-month, a lower high – lower low structure has become fairly clear. The rebound we are seeing at the moment is essentially just a technical pullback after the prior sharp sell-off, as price attempts to climb back up and retest resistance. However, BTC has still failed to reclaim the EMA34, which shows that buying pressure is not strong enough to regain short-term control. At this stage, EMA34 acts as an overhead pressure ceiling, while EMA89 remains the key boundary defining the H4 trend. As long as price stays below both of these moving averages, the market should still be viewed from a defensive perspective.
On the macro and news side, BTC is not being driven by any crypto-specific shock, but rather by broader macro conditions and the risk-on / risk-off environment. The Fed continues to signal higher rates for longer, making it difficult for risk assets to attract fresh inflows. US Treasury yields remain elevated, pushing short-term capital toward the USD and bonds instead of crypto. US equities are undergoing a mild correction, and BTC, at this stage, is still moving quite in sync with the broader risk asset complex. In addition, inflows into spot Bitcoin ETFs have cooled significantly compared to the earlier surge, further weakening the price support.
From my perspective, as long as BTC remains below the EMA34, any upward move should still be treated as a rebound into resistance. And while price stays below the EMA89, the H4 trend remains in a corrective state.

NZDCAD Will Go Up From Support! Buy!
Here is our detailed technical review for NZDCAD.
Time Frame: 4h
Current Trend: Bullish
Sentiment: Oversold (based on 7-period RSI)
Forecast: Bullish
The market is approaching a significant support area 0.791.
The underlined horizontal cluster clearly indicates a highly probable bullish movement with target 0.797 level.
P.S
The term oversold refers to a condition where an asset has traded lower in price and has the potential for a price bounce.
Overbought refers to market scenarios where the instrument is traded considerably higher than its fair value. Overvaluation is caused by market sentiments when there is positive news.
Like and subscribe and comment my ideas if you enjoy them!
