SILVER Set To Grow! BUY!
My dear friends,
SILVER looks like it will make a good move, and here are the details:
The market is trading on 61.986 pivot level.
Bias - Bullish
Technical Indicators: Supper Trend generates a clear long signal while Pivot Point HL is currently determining the overall Bullish trend of the market.
Goal - 62.997
Recommended Stop Loss - 61.372
About Used Indicators:
Pivot points are a great way to identify areas of support and resistance, but they work best when combined with other kinds of technical analysis
Disclosure: I am part of Trade Nation's Influencer program and receive a monthly fee for using their TradingView charts in my analysis.
———————————
WISH YOU ALL LUCK
Long!!

BTCUSD My Opinion! BUY!
My dear friends,
Please, find my technical outlook for BTCUSD below:
The instrument tests an important psychological level 90211
Bias - Bullish
Technical Indicators: Supper Trend gives a precise Bullish signal, while Pivot Point HL predicts price changes and potential reversals in the market.
Target - 91445
About Used Indicators:
Super-trend indicator is more useful in trending markets where there are clear uptrends and downtrends in price.
Disclosure: I am part of Trade Nation's Influencer program and receive a monthly fee for using their TradingView charts in my analysis.
———————————
WISH YOU ALL LUCK

US100 Will Explode! BUY!
My dear subscribers,
My technical analysis for US100 is below:
The price is coiling around a solid key level -25181
Bias - Bullish
Technical Indicators: Pivot Points High anticipates a potential price reversal.
Super trend shows a clear buy, giving a perfect indicators' convergence.
Goal - 25400
About Used Indicators:
By the very nature of the supertrend indicator, it offers firm support and resistance levels for traders to enter and exit trades. Additionally, it also provides signals for setting stop losses
Disclosure: I am part of Trade Nation's Influencer program and receive a monthly fee for using their TradingView charts in my analysis.
———————————
WISH YOU ALL LUCK
SPY: Bullish Continuation & Long Signal
SPY
- Classic bullish formation
- Our team expects pullback
SUGGESTED TRADE:
Swing Trade
Long SPY
Entry - 681.71
Sl - 680.21
Tp - 684.46
Our Risk - 1%
Start protection of your profits from lower levels
Disclosure: I am part of Trade Nation's Influencer program and receive a monthly fee for using their TradingView charts in my analysis.
❤️ Please, support our work with like & comment! ❤️

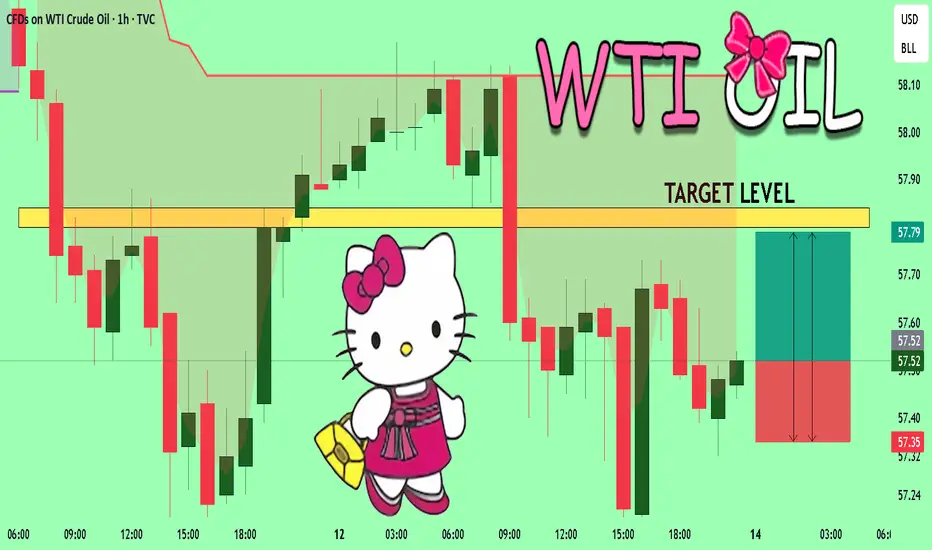
USOIL The Target Is UP! BUY!
My dear subscribers,
This is my opinion on the USOIL next move:
The instrument tests an important psychological level 57.52
Bias - Bullish
Technical Indicators: Supper Trend gives a precise Bullish signal, while Pivot Point HL predicts price changes and potential reversals in the market.
Target - 57.80
My Stop Loss - 57.35
About Used Indicators:
On the subsequent day, trading above the pivot point is thought to indicate ongoing bullish sentiment, while trading below the pivot point indicates bearish sentiment.
Disclosure: I am part of Trade Nation's Influencer program and receive a monthly fee for using their TradingView charts in my analysis.
———————————
WISH YOU ALL LUCK
BTCUSDT Long: Demand Strength Holds - Market Eyes 93,8K BreakoutHello, traders! The current BTCUSDT price action shows a constructive bullish structure as the market continues to respect the key Demand Zone and the rising Trend Line. After a series of reactions around demand, buyers have repeatedly defended this area, preventing further downside and maintaining the integrity of the broader upward trajectory. Earlier, the market traded inside a corrective Range, showing temporary consolidation before buyers stepped back in and pushed price away from the lower boundary. Even though BTCUSDT faced strong rejection from the Supply Zone near 93,800, the recent pullback retraced directly into a high-value demand region, where the Trend Line and horizontal support intersect. This confluence has already triggered bullish reactions in the past, signaling that buyers remain active and prepared to protect the current market structure. The presence of multiple breakout attempts and higher lows highlights sustained interest from long-side participants.
Currently, BTCUSDT is testing the Demand Zone again, holding firmly above the Trend Line while forming a potential launch point for another upward impulse. As long as buyers maintain control over this level, the market structure favors a continuation toward the upper Supply Zone at 93,800, which remains the primary upside target. A clean bullish move from demand would confirm continuation of the prevailing trend.
My scenario as long as price stays above the Demand Zone and respects the rising Trend Line, the expectation is for BTCUSDT to move higher toward the 93,800 Supply Zone. A strong reaction from demand could initiate a new bullish leg, and a confirmed breakout above 93,800 would open the path for further upside expansion. However, a decisive break below demand would invalidate this long scenario and signal deeper correction. Manage your risk!

USDCAD Is Bullish! Buy!
Here is our detailed technical review for USDCAD.
Time Frame: 1D
Current Trend: Bullish
Sentiment: Oversold (based on 7-period RSI)
Forecast: Bullish
The market is trading around a solid horizontal structure 1.377.
The above observations make me that the market will inevitably achieve 1.395 level.
P.S
We determine oversold/overbought condition with RSI indicator.
When it drops below 30 - the market is considered to be oversold.
When it bounces above 70 - the market is considered to be overbought.
Like and subscribe and comment my ideas if you enjoy them!

NG1! BULLS ARE GAINING STRENGTH|LONG
NG1! SIGNAL
Trade Direction: long
Entry Level: 4.099
Target Level: 4.647
Stop Loss: 3.733
RISK PROFILE
Risk level: medium
Suggested risk: 1%
Timeframe: 6h
Disclosure: I am part of Trade Nation's Influencer program and receive a monthly fee for using their TradingView charts in my analysis.
✅LIKE AND COMMENT MY IDEAS✅

USD/CHF BUYERS WILL DOMINATE THE MARKET|LONG
Hello, Friends!
The BB lower band is nearby so USD-CHF is in the oversold territory. Thus, despite the downtrend on the 1W timeframe I think that we will see a bullish reaction from the support line below and a move up towards the target at around 0.801.
Disclosure: I am part of Trade Nation's Influencer program and receive a monthly fee for using their TradingView charts in my analysis.
✅LIKE AND COMMENT MY IDEAS✅

NZDUSD: Dollar Weakness Meets Trend Support!!Hey Traders,
In today’s trading session, we are monitoring NZDUSD for a potential buying opportunity around the 0.57800 zone.
Technical structure:
NZDUSD remains in a well-defined uptrend and is currently undergoing a healthy corrective phase, pulling back toward the 0.57800 area — a key zone of confluence where trend support and prior demand overlap. This level represents a high-interest area for trend continuation if buyers step back in.
Macro backdrop:
On the fundamental side, the US Dollar continues to face headwinds. Recent data points to a cooling US labor market, increasing sensitivity around upcoming releases. With the Fed already having delivered a rate cut, any further signs of economic softening increase the probability of additional policy easing, keeping the USD vulnerable on rallies.
This broader bearish USD environment strengthens the bullish case for NZDUSD, particularly when aligned with a supportive technical structure.
What to watch:
Price reaction around 0.57800 will be key — sustained demand here could open the door for a continuation toward recent highs.
Trade safe,
Joe

BTSUSD: Growth & Bullish Forecast
Our strategy, polished by years of trial and error has helped us identify what seems to be a great trading opportunity and we are here to share it with you as the time is ripe for us to buy BTSUSD.
Disclosure: I am part of Trade Nation's Influencer program and receive a monthly fee for using their TradingView charts in my analysis.
❤️ Please, support our work with like & comment! ❤️

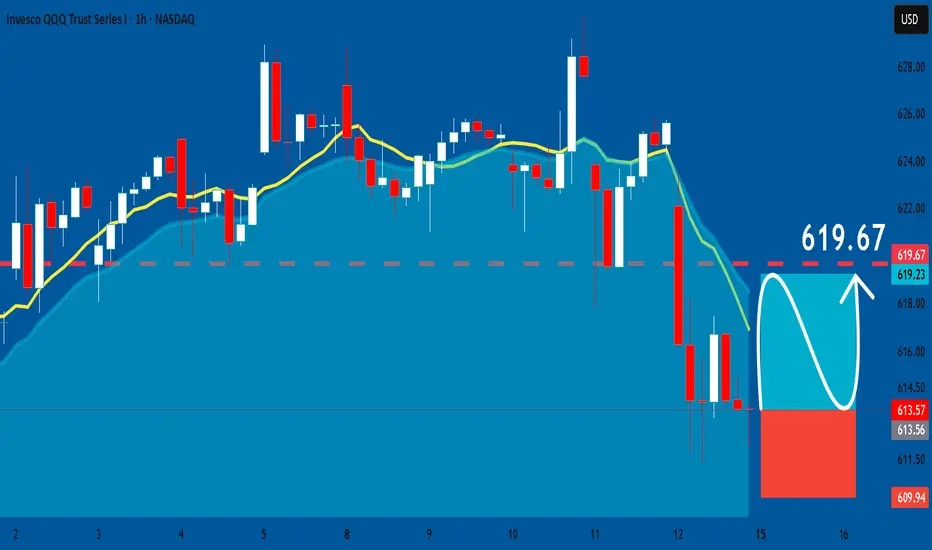
QQQ: Long Trading Opportunity
QQQ
- Classic bullish pattern
- Our team expects retracement
SUGGESTED TRADE:
Swing Trade
Buy QQQ
Entry - 613.57
Stop - 609.94
Take - 619.67
Our Risk - 1%
Start protection of your profits from lower levels
Disclosure: I am part of Trade Nation's Influencer program and receive a monthly fee for using their TradingView charts in my analysis.
❤️ Please, support our work with like & comment! ❤️
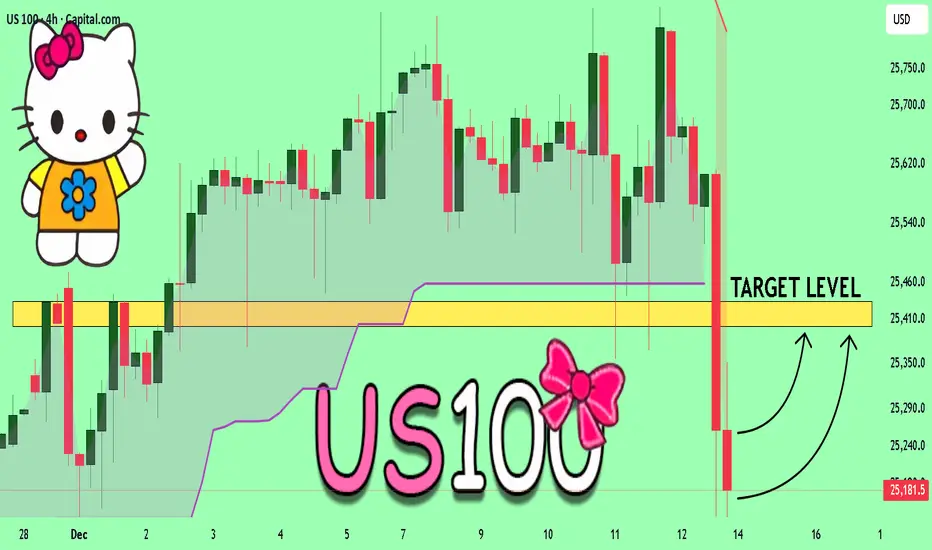
US100: Bullish Continuation is Highly Probable! Here is Why:
The recent price action on the US100 pair was keeping me on the fence, however, my bias is slowly but surely changing into the bullish one and I think we will see the price go up.
Disclosure: I am part of Trade Nation's Influencer program and receive a monthly fee for using their TradingView charts in my analysis.
❤️ Please, support our work with like & comment! ❤️

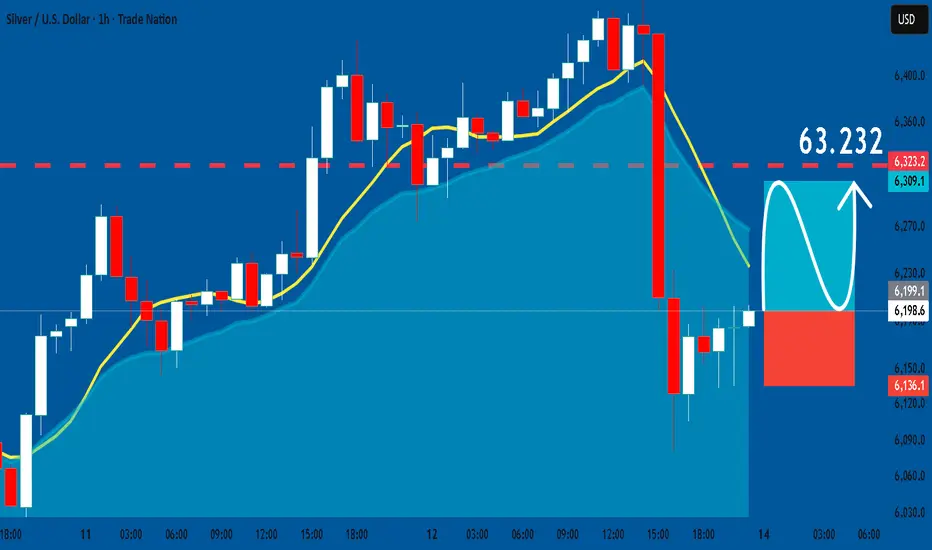
SILVER: Long Trade Explained
SILVER
- Classic bullish setup
- Our team expects bullish continuation
SUGGESTED TRADE:
Swing Trade
Long SILVER
Entry Point - 61.991
Stop Loss - 61.361
Take Profit - 63.232
Our Risk - 1%
Start protection of your profits from lower levels
Disclosure: I am part of Trade Nation's Influencer program and receive a monthly fee for using their TradingView charts in my analysis.
❤️ Please, support our work with like & comment! ❤️
SPY Will Explode! BUY!
My dear friends,
My technical analysis for SPYis below:
The market is trading on 681.74 pivot level.
Bias - Bullish
Technical Indicators: Both Super Trend & Pivot HL indicate a highly probable Bullish continuation.
Target - 684.43
Recommended Stop Loss - 680.39
About Used Indicators:
A pivot point is a technical analysis indicator, or calculations, used to determine the overall trend of the market over different time frames.
Disclosure: I am part of Trade Nation's Influencer program and receive a monthly fee for using their TradingView charts in my analysis.
———————————
WISH YOU ALL LUCK

AUDJPY Is Very Bullish! Long!
Please, check our technical outlook for AUDJPY.
Time Frame: 1h
Current Trend: Bullish
Sentiment: Oversold (based on 7-period RSI)
Forecast: Bullish
The market is on a crucial zone of demand 102.249.
The oversold market condition in a combination with key structure gives us a relatively strong bullish signal with goal 102.716 level.
P.S
Please, note that an oversold/overbought condition can last for a long time, and therefore being oversold/overbought doesn't mean a price rally will come soon, or at all.
Like and subscribe and comment my ideas if you enjoy them!

GOLD Is Bullish! Buy!
Take a look at our analysis for GOLD.
Time Frame: 4h
Current Trend: Bullish
Sentiment: Oversold (based on 7-period RSI)
Forecast: Bullish
The market is approaching a significant support area 4,188.16.
The underlined horizontal cluster clearly indicates a highly probable bullish movement with target 4,233.29 level.
P.S
Overbought describes a period of time where there has been a significant and consistent upward move in price over a period of time without much pullback.
Like and subscribe and comment my ideas if you enjoy them!

BITCOIN Is Very Bullish! Long!
Take a look at our analysis for BITCOIN.
Time Frame: 1h
Current Trend: Bullish
Sentiment: Oversold (based on 7-period RSI)
Forecast: Bullish
The market is testing a major horizontal structure 90,218.38.
Taking into consideration the structure & trend analysis, I believe that the market will reach 91,478.05 level soon.
P.S
Overbought describes a period of time where there has been a significant and consistent upward move in price over a period of time without much pullback.
Like and subscribe and comment my ideas if you enjoy them!

USOIL BULLISH BIAS RIGHT NOW| LONG
USOIL SIGNAL
Trade Direction: long
Entry Level: 57.53
Target Level: 59.96
Stop Loss: 55.93
RISK PROFILE
Risk level: medium
Suggested risk: 1%
Timeframe: 1D
Disclosure: I am part of Trade Nation's Influencer program and receive a monthly fee for using their TradingView charts in my analysis.
✅LIKE AND COMMENT MY IDEAS✅

GBPUSD: Long Trade with Entry/SL/TP
GBPUSD
- Classic bullish formation
- Our team expects growth
SUGGESTED TRADE:
Swing Trade
Buy GBPUSD
Entry Level - 1.3374
Sl - 1.3361
Tp - 1.3400
Our Risk - 1%
Start protection of your profits from lower levels
Disclosure: I am part of Trade Nation's Influencer program and receive a monthly fee for using their TradingView charts in my analysis.
❤️ Please, support our work with like & comment! ❤️

AUDCHF Sellers In Panic! BUY!
My dear subscribers,
This is my opinion on the EURAUD next move:
The instrument tests an important psychological level 0.5292
Bias - Bullish
Technical Indicators: Supper Trend gives a precise Bullish signal, while Pivot Point HL predicts price changes and potential reversals in the market.
Target - 0.5317
About Used Indicators:
On the subsequent day, trading above the pivot point is thought to indicate ongoing bullish sentiment, while trading below the pivot point indicates bearish sentiment.
Disclosure: I am part of Trade Nation's Influencer program and receive a monthly fee for using their TradingView charts in my analysis.
———————————
WISH YOU ALL LUCK

NZDCAD Massive Long! BUY!
My dear subscribers,
NZDCAD looks like it will make a good move, and here are the details:
The market is trading on 0.7986 pivot level.
Bias - Bullish
My Stop Loss - 0.7979
Technical Indicators: Both Super Trend & Pivot HL indicate a highly probable Bullish continuation.
Target - 0.7998
About Used Indicators:
The average true range (ATR) plays an important role in 'Supertrend' as the indicator uses ATR to calculate its value. The ATR indicator signals the degree of price volatility.
Disclosure: I am part of Trade Nation's Influencer program and receive a monthly fee for using their TradingView charts in my analysis.
———————————
WISH YOU ALL LUCK

AUD/CHF LONG FROM SUPPORT
Hello, Friends!
AUD/CHF pair is in the uptrend because previous week’s candle is green, while the price is evidently falling on the 4H timeframe. And after the retest of the support line below I believe we will see a move up towards the target above at 0.536 because the pair is oversold due to its proximity to the lower BB band and a bullish correction is likely.
Disclosure: I am part of Trade Nation's Influencer program and receive a monthly fee for using their TradingView charts in my analysis.
✅LIKE AND COMMENT MY IDEAS✅
