TLT - A long-term outlookIf price is moving up, we look for support structure, which in this case is a Real Swing Low (RSL).
An RSL is confirmed when the most recent Real Swing High (RSH) is broken.
What we’re seeing here is the beginning of a stair-step move to the upside, including short-term support.
Even the CIB has been broken, which suggests that a shift in market behavior is underway.
Our statistical probability of hitting the centerline is roughly 80%. That implies we can look for a longer-term play in TLT.
However, keep a close eye on the 1/4 line. It isn’t exactly friendly, as the rejections we’ve seen so far make clear.
I probably go with ITM LEAP options with a
Delta of around 70–80 and a over 120 DTE.
Happy profits, and for those in the U.S., wishing you a happy Thanksgiving.
Long-setup

If Nasdaq can crack the pressure line then...🔱 We have a Hagopian on the down-move. 🔱
Price was (so far) not able to reach the L-MLH of the red fork.
If buyers can eat through the pressure cheese, then the Long-Play is on.
Most often we see price breaking the pressure line and then coming back to it, scaring out the early longs, just to rush upwards again. So don’t panic if this happens. Place a proper stop and you're good.
As for targets, there is the red Centerline and the white Centerline.
On a break of the red CL, we have a high chance to see the same scenario as with the pressure line: UP-Down-MoreUp.
First snow in Switzerland arrived and Santa is preparing the reindeer to bring us some dough ;-)
Wish you all a profitable Friday.

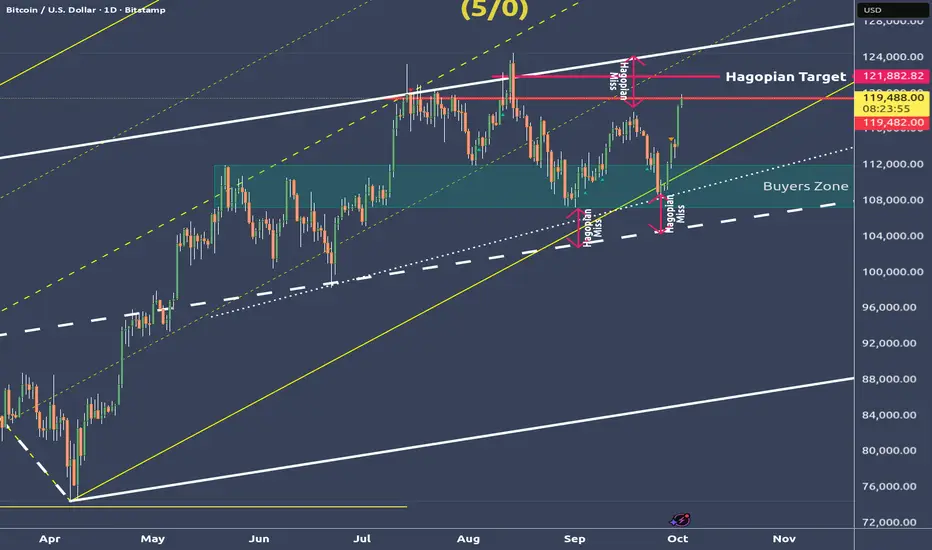
Bitcoin deep dive - We go up to the Hagopians line🔱 Up to the HAGOPIAN's line! 🔱
My last post showed what the possible moves are.
Bitcoin blew through both U-MLH's and is now on the way to the HAGOPIAN-Line.
I could imagine that we even tag the white U-MLH again.
That would be about where the confluence with the yellow forks 1/4 line is.
Because there is much more to say about this chart, I thought I'll do a video.
⛏️ I constructed the Chart from the ground up so you can see all the details and thoughts running through my Mycel Network §8-)
👉 Just check my SOM links.
🙏 Thanks you all for the Boosters I got lately. You all are absolutely awesom and I really appreciate it! 🙏
XAUUSD Has Left the buildingOn the way up, we first found support at the L-MLH (1).
Then the Centerline stepped in as resistance (2), but it eventually couldn’t hold price down.
Eating through the Centerline like a mouse through cheese, price found support again at (2) before blasting upward to the U-MLH — and quickly through it.
Once again, the U-MLH turned from prior resistance into fresh support.
From there, price mirrored (2), moving sideways before blasting off to the moon! 🚀
I’m surprised that WL1 offered no resistance at all.
Now that we’ve left WL1 behind, WL2 is the next target.
Watching the show patiently.

BTCUSD – Last Chance to Go HigherOver the weekend, price found support just outside the white L-MLH. That’s where I previously mentioned the red Centerline — the target for the earlier short trade.
Now, however, price has jumped back into the fork. Tthis could be the last chance to break out of the down-sloping yellow fork to the upside.
P3 would be my next level to watch for support after the break of the red Centerline.

Nasdaq Pre-Market Long CIB Trade🔱 Here comes the CIB Trade 🔱
Price came down in 5 waves.
The CIB line gives us a heads-up if price breaks through it, and it did!
Now everyone and it's Grandma is long on the breakout.
"...let's scare them out, let's hit their Stop!"
Then we take off upon a test of the CIB-Line, which in essence is the same as a test fo a U-MLH or L-MLH after a break.
We have a nice target with a chance to hit of about 80% at the Centerline, and a fantastic tiny stop below the test at the CIB line.
Let's watch how this unfolds.

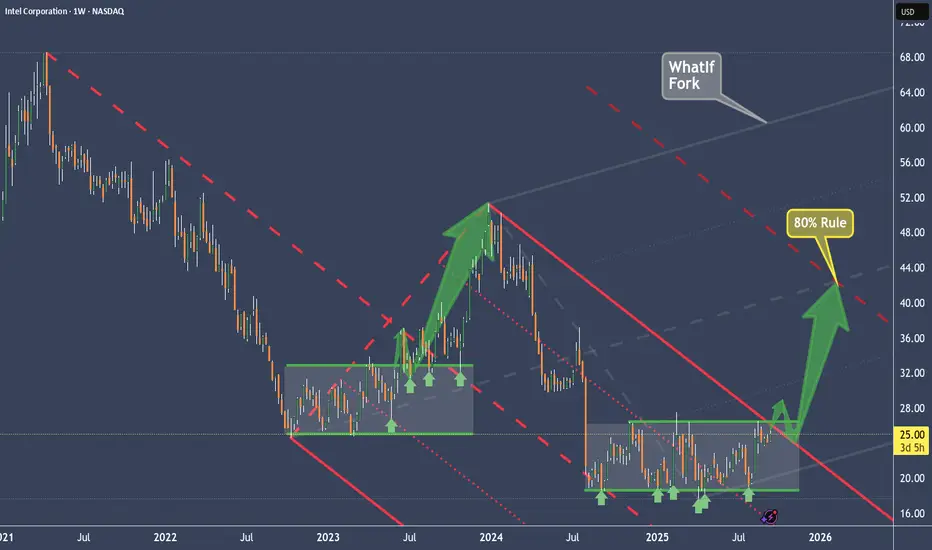
Intel (INTC) silent accumulation pattern and projection of priceThe last time INTC broke out of its sideways range, it re-tested support three times.
After that, price surged upward, pulled back to the Centerline (an 80% probability move), and then began accumulating again within a sideways coil — or “Battery,” as I like to call it (see the TSLA example).
This setup looks similar now.
In fact, we even have a stronger filter: Price must first break out of the downsloping red Fork. Once that happens, we can expect a re-test of the upper median line (U-MLH). That’s the point where I decide whether or not to take a position.
My target is the Centerline of the grey “What If Fork.”
I want to emphasize that the inventor of the Forks highlighted this idea in his original course: always project and think, “What if…?” That’s exactly what I do — and maybe it will help you as well.
Let’s see if Intel’s “Battery” gives us a solid trade. §8-)
GME §8-)OK boys and girls – a little weekend fantasy for you (sneaky giggle 😏).
See those pink zones?
Notice what happened every time the market broke out there?
Now look at the whole width of those zones (highlighted in green).
What if that entire fat chunk is actually one giant buy zone? A monster pit where smart money is scooping up loads… quietly, secretly…? 🤔💸
Alright, enough daydreaming:
Don’t FOMO 🚫🐑
Have a happy weekend 😎🎉

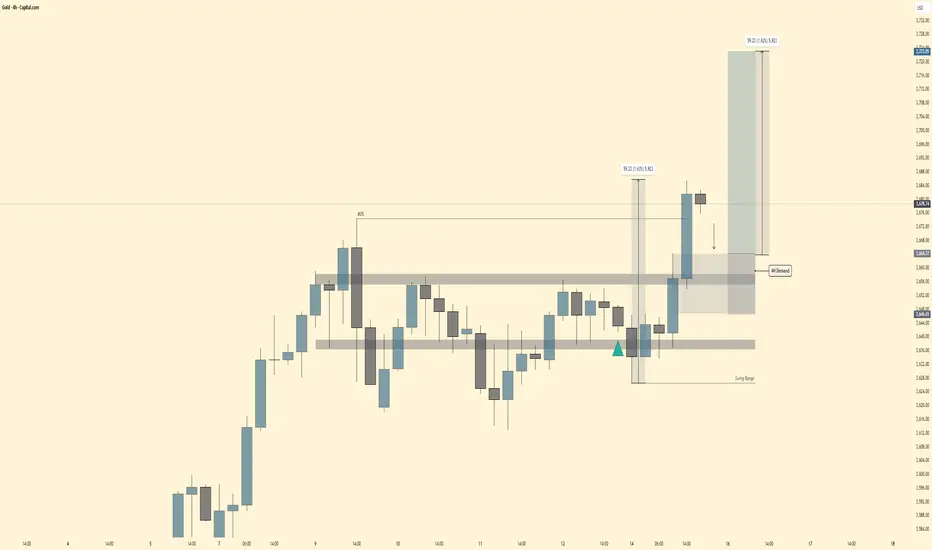
Gold Trade Setup🕰 Weekly Structure
Gold is still holding a bullish tone overall, with higher-timeframe demand zones supporting the structure. Momentum favors continuation as long as demand levels are respected.
📉 Daily View
Price recently broke structure (BOS) and confirmed buyers stepping in. The daily demand zone is aligned with the 4H block, adding confluence for bullish continuation.
⏱ 4H Breakdown
Price tapped into 4H demand around 3660–3670.
Clean rejection with a strong impulsive leg breaking above resistance.
Swing range remains intact with liquidity swept below before the move higher.
Upside target zone sits near 3730s, offering a solid risk-reward (around 1:6).
🔍 Outlook
Short-term pullbacks into 4H demand (3660–3680) = potential buy entries.
As long as demand holds, mid-term outlook remains bullish toward 3730+.
Failure to hold demand would re-open downside back into the swing range (~3640–3620).
Bias : ✅ Short-term pullback → Mid-term bullish continuation.
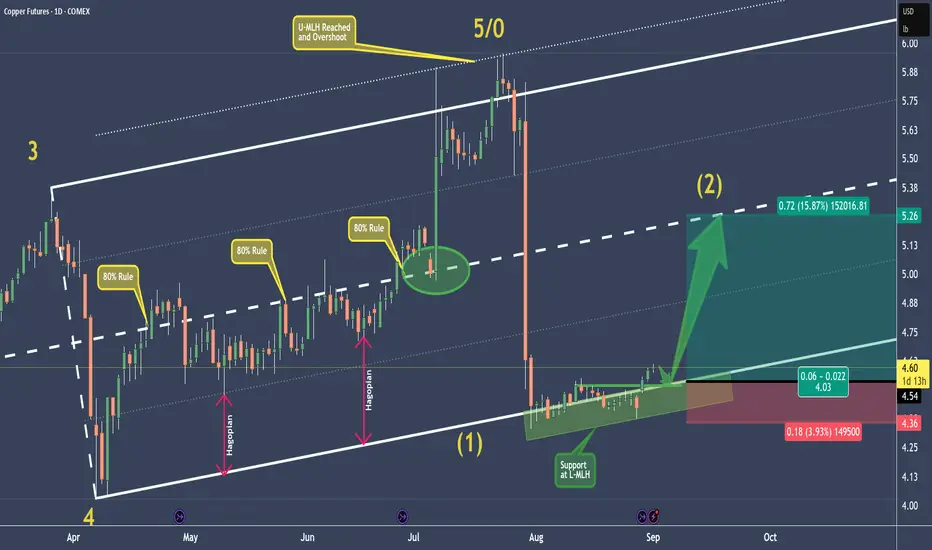
HG - Copper Setting Up For A Long Opprtunity At Extreme📊 Fundamentals first:
- Short-term: The copper market is turbulent—marked by sharp price spikes, crashes, and global shifts in stock levels.
- Medium-term: Despite forecasted surpluses from ICSG, technology innovations and steady demand (especially from China and green sectors) may underpin prices.
- U.S. risk factor: The tariffs remain a major wildcard, likely restructuring trade flows, increasing domestic input costs, and distorting global price differentials.
📈 Now the Chart:
P5/0 at the U-MLH marked the end, and price dropped into the void.
Now, at the L-MLH we see support has built up.
The momentum we see now will probably lead in a pullback before the potential massive run-up to the Centerline.
💡 If the trading God gives me a pullback, I am willingly risk my 0.5% in this trade to make at least 4x more. 🦊
Happy new week to all §8-)
CORN - Want some POP? Here it comes...maybe.Corn regained the orange Centerline.
Unfortunately I missed the retest.
But if we are lucky we get it again and then we can pull the trigger to get some nice crunchy Corn.
The Risk-Reward looks nice around the white Centerline.
BRB… off to the kitchen… 🌽🔥

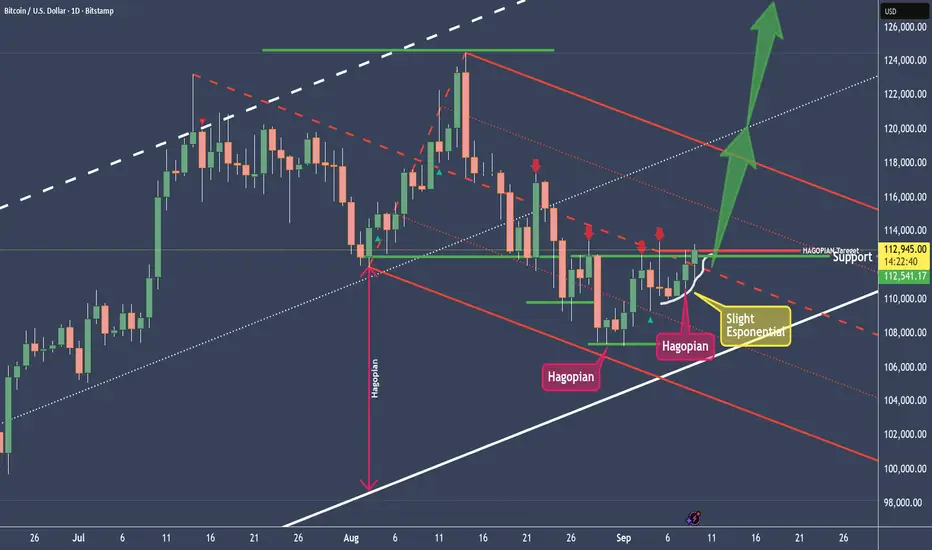
BTCUSD is moving exponential and here's the setupBecause BTCUSD couldn't reach the L-MLH of the red fork twice, we have 2 HAGOPIANs cooking. That means, that price will move further in the opposite direction than from where price came.
Price came from the Centerline, and that's where the high of the today's Candle peeked through. I expect more upside movement.
As for a trade, I want to see price holding above the centerline. From there, PTG1 is the U-MLH and beyond that it's the white Centerline again (...which looks like it's going to the Moon, like XRPUSD).
Of course, we seldom can eat the whole Cake. So we manage it and take partial profits on the way up.
🙏😊✨ Thanks for following and boosting folks. 🙏😊✨
XRPUSD is following our projectionThe red pressure line is broken.
After dabbling with the L-MLH, price decided to jump back into the fork, projecting a potential huge move ahead.
But not so fast!
The slope of the white fork is super steep.
In such situations I like to throw a Modified-Shiff-Fork, or a Shiff-Fork on the chart too. This gives me often more realistic profit targets.
The trade could be managed by using the light-grey fork's centerline as PTG1 and the rest of the position aims for the white mooning centerline §8-)
A second steak of the position could be loaded, after the yellow CIB-Line is broken. I like to wait for a test of it after the crack and jump-above. It's the same like a test/retest of a Medianline-Parallel if price broke out of it.
Let's have fun here §8-)

Crude Oil - Eye twinkle to go long?The Test/Retest was expected, and it was not that clean as it is mostly. Usually I don't want to see price trading back into the fork again.
This time, price managed to jump out of it again and opened above the U-MLH. If it can close outside the fork too, then this would be a good hint for me to load the boat.
The 80% target is the yellow Centerline, or even higher, since the drillers moan about a too low price (Fundamental Fact).
Let's see if we find some petro dollars.

WMT - Our profit target is near, secure some profitsWhen I posted the long trade on Aug. 29th, I did not expect it to run that quick.
Who of you guys or gals pushed it that quick? §8-)
However, I will trail my stop below the last red candles low.
We are not here to win a contest, so we secure some profit, just in case price drops before the Centerline is reached.
Don't forget to follow me and profit from further trades and educational content.

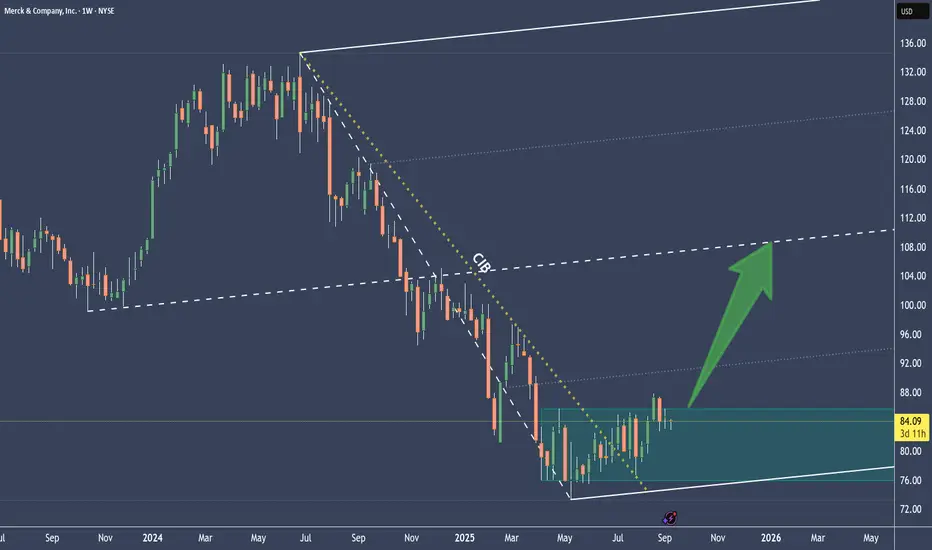
MRK is showing some breakout signsThe white fork is pointing slightly to the upside.
CIB is broken and signals a change in behavior. The pullback to it was very nice - a Eye twinkle? §8-)
Then price opened the door to the upside by peeking through the resistance of the consolidation, asking: "Anybody here to buy me?"...silence...so far.
OK, let's be patient and wait for another sign or hint.
Until the, stalking hat on, as my mentor Shane always said.
--> NO FOMO IN THIS CLASS! <--
EURJPY Long on EURJPY for next week as the price is short-term bearish. Don't try to call the highs or you will be down bad

Every breakdown is just a setup — if you know where the reaccumuPrice collapsed. But I didn’t flinch. Because beneath that move sits something most won’t look for: High-Volume Rebalancing (H RB), paired with a clean FVG structure that tells me exactly where Smart Money wants to reload.
The structure:
The breakdown into ~2483 wasn’t just a move — it was intentional. That candle didn’t just fall, it delivered into the H RB zone and paused. Below that? Nothing but inefficient space and a tightly engineered low.
Above? Three clear target zones:
TP1: 2528
TP2 : 2582
TP3: 2656
Final objective: 2762 — the origin of the final collapse
Every leg above is engineered to grab liquidity, rebalance inefficiency, and then clear out the next range. It’s a chain of fulfillment.
The trade:
Entry: 2483–2500 zone
SL: Below the H RB zone (~2470)
TP1: 2528
TP2: 2582
TP3: 2656
Optional extension: 2762
We aren’t buying because it’s “down.” We’re executing because it’s deliberate.
Final thought:
“Collapse isn’t the end. It’s the invitation.”

AUDUSD READY TO LAUNCH: HTF Bias + OB + FVG + PRIME SETUPBias:
We’re operating within a clear bullish higher time frame bias, confirmed by previous swing structure and continuous displacement to the upside. Price has consistently made higher highs and higher lows on the 4H and Daily chart.
Entry Zone:
✅ 4H Fair Value Gap (FVG) — a clean imbalance from prior bullish displacement. Price has now retraced into this inefficiency, a key area where smart money typically looks to re-accumulate.
✅ 1H Order Block (OB) — precisely overlapping the 4H FVG, strengthening the setup. This is the last bearish candle before the bullish move that created a market structure shift, now acting as a support zone.
This dual confluence—FVG + OB at a retracement level—marks a premium setup.

BTC — Bulls in Full Control | Next Stop $87K+?Bitcoin just smashed through the resistance around $84,300, and the bullish momentum is 🔥
Now we’re heading straight into the next key zone at $87,000–$88,765, which lines up perfectly with previous supply.
If bulls keep this pace — a clean push toward 87K looks very real in the coming sessions.
Entry: $84,500 – $85,500
TP: $86,800 – $87,000
SL: $83,500
More thoughts in my profile @93balaclava
Personally I trade on a platform that offers low fees and strong execution. DM me if you're interested.

ACT: Classic Range Accumulation with Breakout Potential#ACT is showing clean sideways movement with classic deviations—textbook accumulation. Horizontal volume is stacked right in the middle, confirming the range is solid.
This one’s coiling up for a move. Follow me so you’re in before it breaks out. 🚀
Entry: 0.052-0.0536
TP: 0.068
SL: 0.0463

Is This the Most Perfect Bollinger Band Breakout Ever?I’ve been keeping an eye on XCN/USDC, and this latest move is something else. After a sharp drop that looked like a liquidity grab, we’ve seen a stunning recovery and breakout above the upper Bollinger Band. Could this be the start of something huge?
This kind of setup has the potential to keep running, and I wouldn’t be surprised if we see new highs soon. Is this the strongest bounce we’ve seen in weeks, or do you think there’s more consolidation ahead?
Drop your thoughts, follow, and share for more insights like this. Let’s see where this takes us!

NVIDIA (NVDA): Targeting $166 amid AI momentumNVIDIA continues to dominate the AI and computing landscape, with a significant development in Japan: SoftBank’s telecom unit will soon receive Nvidia’s advanced Blackwell chip design for its supercomputers. The upcoming earnings report on November 20 is critical in sustaining NVIDIA’s exceptional growth trajectory.
CEO Jensen Huang’s company has projected third-quarter revenue of approximately $32.5 billion, propelled by substantial demand for Hopper and Blackwell GPUs. These GPUs are crucial for strengthening NVIDIA’s data center segment, which currently operates with an impressive 68% margin. Priced between $30,000 and $40,000, Blackwell chips are already seeing high demand, with production scaling in Q4 2024.
From a technical perspective, NASDAQ:NVDA still has room to grow, with a targeted area of $166 or higher in the short term. We are closely monitoring the stock for either a move into this target or a shift in market structure that could change the outlook.
Stay tuned for updates as we approach the earnings call and as NVIDIA continues to set new milestones in the tech space.
