GOOGLE WHERE THE MONEY IS### 🚨 GOOG Technical Analysis: Is Google Ready to Blast Off in 2026? 🚀
Hey traders! As of **January 4, 2026**, Alphabet (GOOG) sits at **$315.32** (up ~0.48% recently), fresh off a monster **65% rally in 2025** – its best year since 2009. Your TradingView chart nailed the long-term uptrend perfectly: from 2022 lows around $80-100, through a sharp 2025 dip, to new highs near $328. That green ascending trendline is pure gold, projecting toward **$400+** by 2027 if bulls stay in control.
THAT MEANS, IF YOU POSITION WELL, ARE PATIENT, FOLLOW TRENDS AND INDICATORS, and time it correctly (Which is difficult, meaning watch the numbers and indicators to time the move), you can ride the down wave, into the up wave long. AND MANY TRADES ALONG THE WAY!! This means there is a LOT of money for well placed trades.
But is this the calm before another moonshot... or a sneaky top? Let's break it down **clearly and step-by-step** – no fluff, just actionable insights to hook you in and keep you reading.
#### 1. **Current Price Snapshot** (As of Jan 4, 2026)
- **Price**: $315.32
- **Recent Range**: High ~$328 (Nov 2025), Low ~$310
- **52-Week Range**: ~$143 to $329
- **Market Mood**: Neutral sentiment, but AI hype is strong after 2025's blowout performance.
#### 2. **The Big Trend: Bullish Ascent Intact**
- **Primary Trend**: Strong uptrend since 2022 bear market bottom.
- **Key Driver**: That green ascending support line (from ~$83 in 2022) has held every major dip, including the 2025 pullback to ~$156-210.
- **Current Status**: Price hugging resistance at ~$315-322. Break above = acceleration; hold = consolidation.
- **Projection Match**: Your chart's line points to ~$380-400 by mid-2027 – aligns with optimistic analyst views if AI (Gemini, Cloud) delivers.
#### 3. **Critical Support & Resistance Levels** (Watch These Like a Hawk)
- **Immediate Resistance**: $322 (recent high) → $328-329 (all-time high)
- **Key Resistance**: $340-350 (next upside targets on breakout)
- **Immediate Support**: $310 → Green trendline (~$300 near-term)
- **Major Supports**: $262 (38.2% Fib), $220-240 (prior consolidation), $181 (deeper retrace)
- **Breakdown Risk**: Below $290-300 trendline = potential drop to $262 or lower (bear warning!).
#### 4. **Chart Patterns & Signals**
- **Overall Structure**: Series of higher highs/lows with bullish flags and V-bottom reversals (e.g., 2025 dip).
- **Recent Action**: Zigzag consolidation near highs – possible ascending triangle forming.
- **Earnings Markers**: Mostly green "E" beats in 2025 fueled rallies; watch Feb 3, 2026 report for the next catalyst.
- **Volume Note**: Low volume on recent moves – needs spike for conviction breakout.
#### 5. **Bull Case: Why GOOG Could YOLO to $400+**
- AI dominance (Gemini, Cloud growth >30%)
- Strong fundamentals: Search engagement up, massive Cloud backlog
- Analyst Consensus: Median target ~$330-340 (up 5-8% from here), some as high as $385-400
- Momentum: Best Mag7 performer in 2025 – carryover potential huge
#### 6. **Bear Case: Risks That Could Trigger a Crash Scenario**
- Heavy 2026 capex (~$114B on AI/data centers) pressuring margins
- Antitrust heat & competition (e.g., OpenAI, Bing threats)
- Valuation: ~30x forward P/E – rich if growth slows
- Technical Risk: Failure at $329 high = double-top, potential pullback to $280-300
#### 7. **Quick Trade Ideas**
- **Bullish Play**: Buy dip to green trendline (~$300-310), target $340-350. Stop below $290.
- **Bearish Play**: Short on failed breakout above $329, target $262.
- **Safe Play**: Wait for volume breakout – add alerts on TradingView!
This chart screams **uptrend with upside bias**, but respect the resistance – 2026 could be epic if AI pays off, or choppy if capex bites. What's your take: Moon or correction? Drop your thoughts or another chart – let's discuss! 📈🔥
Ghost feed may not be accurate, please only use as a projected guideline.
*(Not financial advice – DYOR, markets can moon or crater anytime.)*
Long-trade

Long Idea ON $MNTWe are currently in a downtrend from $2.87. This rise is therefore a correction within the overall falling trend. According to wave analysis, the potential target is $1.80, which gives a risk/reward ratio of approximately 1:2.5 or higher (depending on where you set your stop-loss). The setup remains valid until the high around $2.87 is updated.
Remember to manage your risks.

Nasdaq nearing critical balanceIn November, we observed a Hagopian pattern - the market failed to reach the centerline despite the high probability of doing so (see weekly chart left). MACD-V is in divergence since then. A sign to be especially cautious.
This led to the current rally lasting more than ten days without a single close below a prior low. It seems the Plunge Protection Team may be at work.
In any case, we are now approaching the yellow centerline, the market’s point of balance. From there, the market will determine whether we push once more above the yellow centerline toward the white U-MLH, or turn downward, producing a second Hagopian and falling back toward the white centerline.
If the second scenario unfolds, the path toward significantly lower prices would be wide open.
Let’s see what we get for Christmas…

Bitcoin TA and ALT coin TAHi guys,
I hope you enjoyed the video! Its going to be a very existing next 3 months!

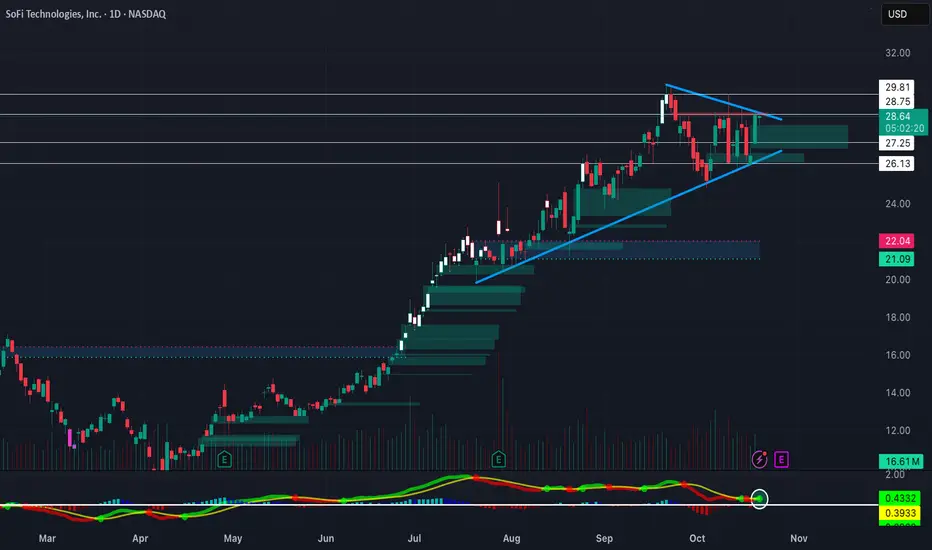
Triangle Break Heading into EarningsNASDAQ:SOFI Forming a big symmetrical triangle on the daily timeframe heading into earnings. EMA's are starting to curl upwards after NASDAQ:SOFI found some support on its 50-day SMA. Bullish long-term on NASDAQ:SOFI , so definitely will be watching this one closely
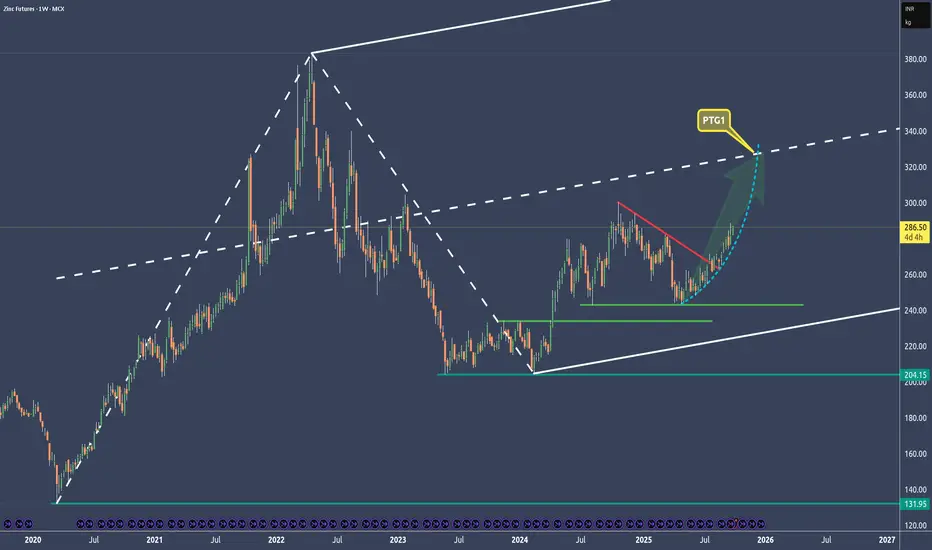
Zinc - Exponential Move To Profit Along With Copper🔱 I posted about copper and zinc on Sep 17. 🔱
Both are closely correlated, and now zinc is moving exponentially.
The target is at the centerline of course with around an 80% probability.
👉 If you think that these forks are doing a good job, then throw me booster please and check out my links. §8-)
#BTCUSDT.P (15m Chart)#BTCUSDT.P
(15m Chart)
🔹️ Update 🔹️
Entry zone (109,800 – 109,500) was not reached,
but Targets 1, 2, and 3 (111,000 – 112,400) have been hit ✅
⚠️ Bullish scenario played out, but no entry was triggered. Risk management first.
🆔 @Rasoolahmadi

ADBE LONGThis trade has reached the yearly low of 335 showing that there will be strong level of support.
It is against the trend however there is a bat pattern on H4 and daily
There is a double bottom on M30 and H1 showing divergence.
Stop loss below 333

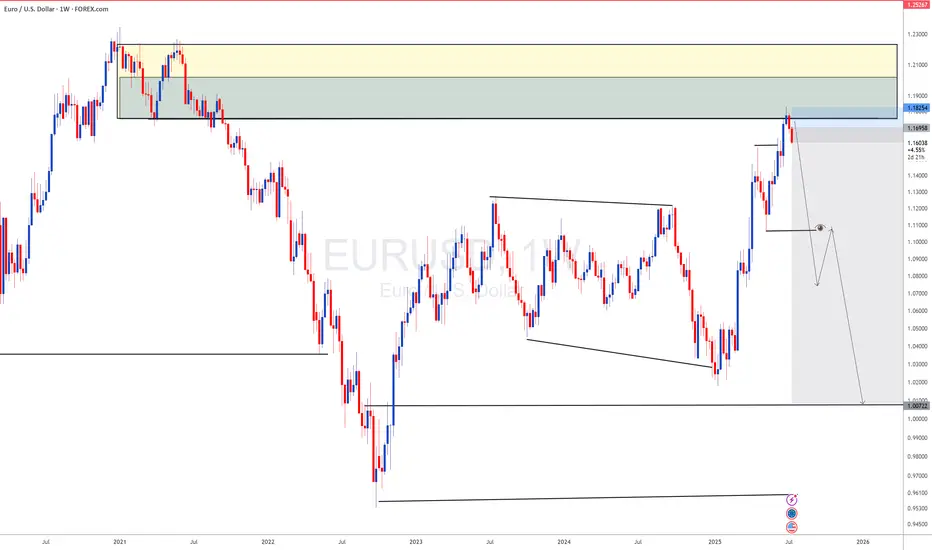
EURUSD as DXY s gaining momentum DXY has completed its long term downside now lets look for sell on EURUSD
Setup: Long on SOL/USDT🚀 Setup: Long on SOL/USDT Perpetual (15m timeframe)
📈 Context:
Strong divergence between Perp CVD (down) and Spot CVD (up).
_Top Traders accumulating long positions.
_Open Interest stable to slightly rising.
_More than 90% of positions are short — strong imbalance favoring a squeeze.
🎯 Trade Plan:
_Entry: around 148.20 USDT
_Stop-Loss: 145.70 USDT
_TP1: 150.38 USDT (partial profit)
_TP2: 152.30 USDT (full close)
🧠 Notes:
Plan to secure partial profits at TP1.
Will monitor for continuation if breakout occurs.

LIMIT ORDER - TUT/USDTLIMIT ORDER - $TUT/USDT
Direction: #Long 🟢
Entry Price: 0.02494
Stop Loss: 0.020896
Target 1: 0.028031
Target 2: 0.031122
Target 3: 0.034213
Target 4: 0.037304
Target 5: 0.040395

btc breakout happening as we speak, double div up to 108kbtc chart - double 4h div into breakout, i think is good chance for blaster

LTC - Loads more up to goI've had a lot of requests for custom analysis on LTC. Its looking strong within the channel and there's potential for lots more up to complete the X wave, which would still look corrective in a very straightforward looking ABC. I actually don't like LTC too much. It's slow, sluggish, doesn't keep up with market trends. But, it's looking strong for some more up. Follow and share for more.

Binance stalled, but will go higherBinance coin is stalled undertaking a long-term inverted head and shoulders pattern. There is likely to be a bit more down, before busting through the upper trend line on to new all time highs. Keep a close eye on it, as it's buffeting nicely. I'd take a long trade once there's confirmation of the upper trend line being decisively breached. Else, we might see a failed head and shoulders. Keep a close eye and follow for more.

Short idea on $BTC In the local setup, I see a good opportunity for execution, with a risk/reward ratio of 1 to 5, which is very favorable. However, the risks here are quite high, so I will enter with a small portion. Reasons for entry. Based on the structure, it’s clear that we are retracing to 0.382 or 0.618 and then heading down. You can check this yourself. Since my portfolio is long, I won’t have any significant losses. If we drop, I’ll reinvest part of it.Reasons for entry. Based on the structure, it’s clear that we are retracing to 0.382 or 0.618 and then heading down. You can check this yourself. Since my portfolio is long, I won’t have any significant losses. If we drop, I’ll reinvest part of it.

Short idea on $TONAfter analyzing the TON/USDT chart, it is clear that a higher-degree correction is currently underway, with potential to reach $3. I am incorporating a 1 to 2 ratio into the chart (not ideal), but I will allocate a small balance to this idea


Premium Long Trade Setup: DUSKUSDTToday, I’m excited to share our premium long trade setup for DUSKUSDT. Let’s start by focusing on the critical $1.45 support level, where we observed a clean rejection of the 161.8% Fibonacci support. This rejection is a strong positive signal, indicating a potential trend reversal for DUSK.
Currently, we see the completion of a 5-wave move to the upside, which confirms that this rally is not merely an ABC correction. With the 5-wave structure complete, it’s logical to anticipate an ABC correction to the downside.
We’ve strategically placed our buy limit order at $0.2211, offering a robust 1:3 risk-reward opportunity. Additionally, we’ve set three upside targets. Upon reaching the first target, we plan to secure 50% of the profit and simultaneously eliminate the trade’s risk. This approach allows us to manage the trade with confidence, knowing that we’re in a strong position for potential gains.
Let’s monitor this setup together and enjoy the process. Happy trading!

Consider Buying Bank Nifty at 50,438.30 using SMCWe have identified an opportunity to enter Bank Nifty at 50,438.30. This trade setup leverages the Smart Money Concept (SMC) and takes advantage of a Fair Value Gap (FVG) above a Demand Zone.
Trade Details:
Entry Price: 50,438.30
SL: 49,616.75 (-1.63%)
TP: 53,248.25 (+4.05%)
Fair Value Gap (FVG): An FVG represents a quick price move with little trading volume, often driven by institutional activity. It can serve as a support or resistance area, making it a strategic entry point.
Demand Zone: Positioned below the entry price, this zone indicates strong buying interest, suggesting that institutional investors may support the price at this level.
Stop Loss (SL): Placed at 49,616.75, just beneath the FVG, to limit risk at 1.63%. This safeguard helps protect against unfavorable price movements.
Take Profit (TP): Targeting 53,248.25, with a potential gain of 4.05%, aiming for a supply zone where selling pressure might emerge.
This approach is designed to align with institutional activities by identifying critical market zones. Always remember, trading involves risks. Stay updated and adjust your strategy accordingly. 📊💼
Like and follow for more trading insights, and share this with your network! 🔔👥

BITCOIN TRADING ANALYSIS!I hope you guys enjoyed the video! If you have any questions or comments feel free to Ask!

Long idea on DOTok, I need to describe the damn thing, I came in, I just believe in the high season now (I will duplicate the description in coins that I will take)

Long Idea on LDOok, I need to describe the damn thing, I came in, I just believe in the high season now (I will duplicate the description in coins that I will take)

Long Idea on SANDok, I need to describe the damn thing, I came in, I just believe in the high season now (I will duplicate the description in coins that I will take)
