Gold is accumulating and increasing in price.⭐️GOLDEN INFORMATION:
The latest FOMC Minutes showed that most Federal Reserve officials favor further rate cuts if inflation continues to ease, though divisions remain over the timing and magnitude. Meanwhile, Fed funds futures imply an roughly 82% probability of a rate hold at the January 27–28 meeting, per CME FedWatch. Expectations of lower rates continue to underpin Gold by reducing the opportunity cost of holding the non-yielding asset.
⭐️Personal comments NOVA:
Gold prices continue their upward trend – amid a weakening DXY and caution regarding risky assets at the start of 2026.
⭐️SET UP GOLD PRICE:
🔥SELL GOLD zone: 4544 - 4546 SL 4551
TP1: $4530
TP2: $4515
TP3: $4500
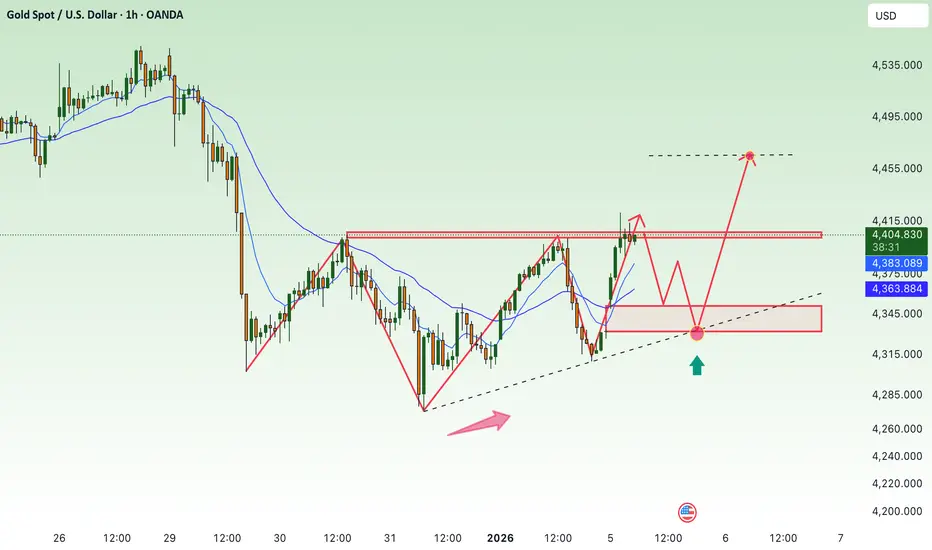
🔥BUY GOLD zone: 4402 - 4400 SL 4395
TP1: $4415
TP2: $4430
TP3: $4445
⭐️Technical analysis:
Based on technical indicators EMA 34, EMA89 and support resistance areas to set up a reasonable BUY order.
⭐️NOTE:
Note: Nova wishes traders to manage their capital well
- take the number of lots that match your capital
- Takeprofit equal to 4-6% of capital account
- Stoplose equal to 2-3% of capital account
Longposition

Gold prices rose back above 4400.⭐️GOLDEN INFORMATION:
Gold (XAU/USD) advances to around $4,370 in early Asian trading on Monday, supported by a sharp rise in geopolitical risk following reports that the United States has captured Venezuelan President Nicolás Maduro. The escalation has reinforced safe-haven demand, while markets closely track further developments and await the release of the US ISM Manufacturing PMI later in the session.
According to CNN, the Trump administration authorized a large-scale strike against Venezuela and detained President Maduro without congressional approval, with President Trump stating that the US would oversee Venezuela during a transitional period—adding a fresh layer of uncertainty to global markets.
⭐️Personal comments NOVA:
Gold prices broke through the 4400 resistance level, consolidated and traded sideways before continuing their recovery.
⭐️SET UP GOLD PRICE:
🔥SELL GOLD zone: 4464 - 4466 SL 4471
TP1: $4450
TP2: $4435
TP3: $4420
🔥BUY GOLD zone: 4334 - 4332 SL 4327
TP1: $4345
TP2: $4360
TP3: $4375
⭐️Technical analysis:
Based on technical indicators EMA 34, EMA89 and support resistance areas to set up a reasonable BUY order.
⭐️NOTE:
Note: Nova wishes traders to manage their capital well
- take the number of lots that match your capital
- Takeprofit equal to 4-6% of capital account
- Stoplose equal to 2-3% of capital account
Gold prices recovered to around 4400.⭐️GOLDEN INFORMATION:
The minutes from the Federal Open Market Committee’s December 9–10 meeting revealed that most policymakers see scope for additional interest-rate cuts, contingent on inflation continuing to trend lower, though there was less consensus on the timing and magnitude of further easing. Expectations of lower policy rates tend to compress yields and reduce the opportunity cost of holding non-interest-bearing assets, providing a supportive backdrop for Gold.
Beyond monetary policy, elevated geopolitical risks remain a key tailwind. The ongoing Israel–Iran conflict, alongside persistent tensions between the United States and Venezuela, continues to underpin safe-haven demand. In periods of heightened uncertainty, investors typically gravitate toward assets that can preserve value, reinforcing Gold’s role as a traditional store of wealth.
⭐️Personal comments NOVA:
Gold prices are recovering at the beginning of 2026, breaking through the H1 trendline, and are recovering in the Asian session.
⭐️SET UP GOLD PRICE:
🔥SELL GOLD zone: 4443 - 4445 SL 4450
TP1: $4435
TP2: $4420
TP3: $4400
🔥BUY GOLD zone: 4276 - 4278 SL 4271
TP1: $4295
TP2: $4310
TP3: $4330
⭐️Technical analysis:
Based on technical indicators EMA 34, EMA89 and support resistance areas to set up a reasonable BUY order.
⭐️NOTE:
Note: Nova wishes traders to manage their capital well
- take the number of lots that match your capital
- Takeprofit equal to 4-6% of capital account
- Stoplose equal to 2-3% of capital account

EUR/USD: a good price level to buy on the 1-hour timeframe.1. On the Daily timeframe: EURUSD formed a peak on April 17, 2025 at 1.1900 (this was also a strong selling level around September 2021) and was pushed down sharply by sellers within one day, leaving a long wick. Currently, EURUSD is moving sideways within a parallel channel, gradually rising to retest the 1.1900 resistance zone.
2. On the 4H timeframe: EURUSD is trading above the 78 EMA and 21 EMA, indicating the bullish momentum is still intact. Price has completed a test of the 1.1800 resistance and is now undergoing a pullback.
If EURUSD breaks below the 1.1710 support, price could drop sharply to the next support at 1.1620.
Conversely, if EURUSD holds above 1.1710, price may retest the 1.1900 resistance zone.
Trading strategy (EUR/USD):
Buy: 1.1771
Target (TP): 1.1866
Stop loss (SL): 1.1695
Risk/Reward (R/R):
Potential gain: 0.0095 (≈ 95 pips)
Potential risk: 0.0076 (≈ 76 pips)
R/R = 1.24
Analysis by: Leevermore

EUR/USD: a good price level to buy on the 1-hour timeframe.EUR/USD:
Buy: 1.1771
Target: 1.1866
Stoploss: 1.1695
R/R Ratio = 1.24

READY TECH HOLDINGS LTDREADY TECH HOLDINGS LTD made double with divergence along MACD cross over and RSI UPTICK. We can go long with first target of $2.77 and Final target of $3.5 in short tern view.
We can seen minor support level at $2.9.
PLease make your own analysis before taking any trade. ASX:RDY

DOT/USD SSL taken → ( upside )Potential bullish expansion
A pullback into supply is expected for mitigation
This is a long-term expectation, anticipated by early 2026 (Q1)
(This is not financial advice. Trade at your own risk)

GBPCHF remains in a bearish market structure.Price is approaching the lower Fibonacci support zone, where a bullish reaction is expected.
Buying from this lower Fibonacci area is reasonable if price shows confirmation, as this level aligns with a strong retracement support.
A bullish response from this zone could initiate a corrective move upward.
Always wait for confirmation and manage risk properly.
61.8%
0.75%
FOREXCOM:GBPCHF
OANDA:GBPCHF FX:GBPCHF FPMARKETS:GBPCHF

$MSTR ..Houston we’ve found a support NASDAQ:MSTR , MSTR went from trading at 400 times bitcoin value to less than 1(slightly) book to value. And it Happened suspicously while hitting the volume profile point of control.

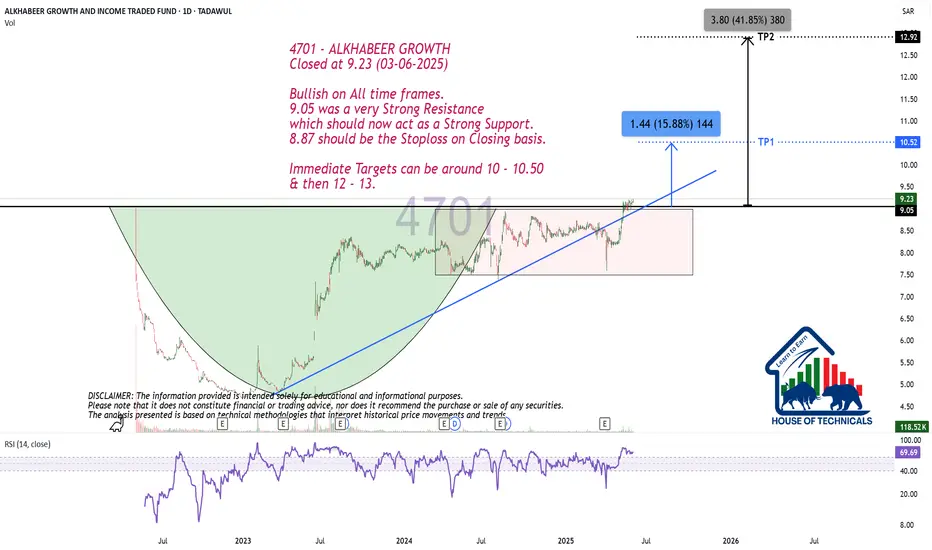
Bullish on All time frames.
Closed at 9.23 (03-06-2025)
Bullish on All time frames.
9.05 was a very Strong Resistance
which should now act as a Strong Support.
8.87 should be the Stoploss on Closing basis.
Immediate Targets can be around 10 - 10.50
& then 12 - 13.
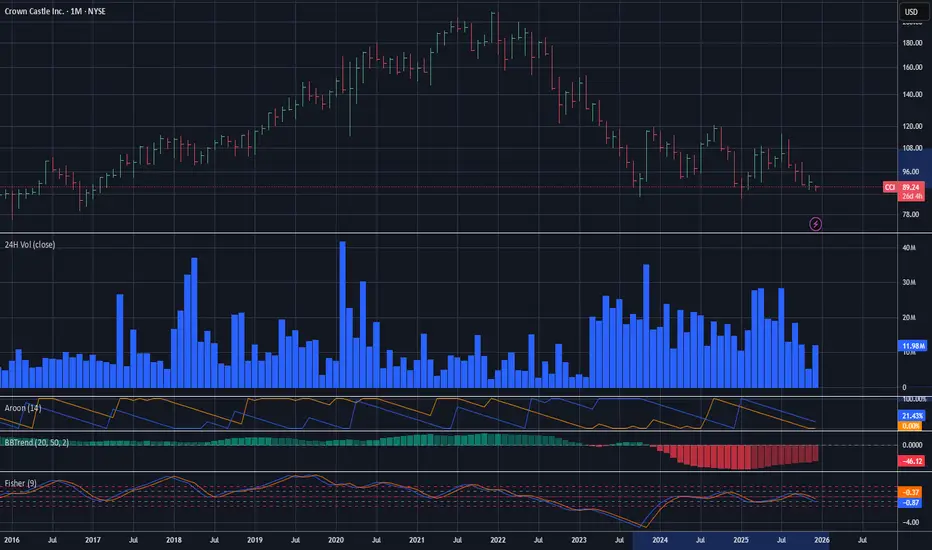
Crown Castle - Next Long Target $95Bearish trendline support seems to be breaking. The patterns look like a possible retracement could be soon. As always, none of this is investment or financial advice. Please do your own due diligence and research.
Accumulated price increase - bulls expect rate cut⭐️GOLDEN INFORMATION:
Expectations of further Fed rate cuts and inflation still above target continue to underpin gold and silver, said David Meger, director of metals trading at High Ridge Futures.
However, China’s physical gold demand has weakened at elevated price levels, which could weigh on the metal. According to the Financial Times, major retail chains have scaled back their presence in mainland China this year, while smaller sellers report that soaring prices and higher taxes have severely hurt sales.
⭐️Personal comments NOVA:
Gold price took H1 4193 breakout liquidity and reacted bullishly, still maintaining the uptrend, continuing to expect December rate cut
⭐️SET UP GOLD PRICE:
🔥SELL GOLD zone: 4274 - 4276 SL 4281
TP1: $4260
TP2: $4245
TP3: $4230
🔥BUY GOLD zone: 4145 - 4143 SL 4138
TP1: $4160
TP2: $4175
TP3: $4190
⭐️Technical analysis:
Based on technical indicators EMA 34, EMA89 and support resistance areas to set up a reasonable BUY order.
⭐️NOTE:
Note: Nova wishes traders to manage their capital well
- take the number of lots that match your capital
- Takeprofit equal to 4-6% of capital account
- Stoplose equal to 2-3% of capital account

TCS: SMA 200 for long positionHello traders,
The stock we are going to watch is $NSE:TCS. This stock is related to IT sector. This stock is mostly moving in an upward direction. Currently, it is taking some additional support of SMA200 in 4h time frame. This stock can shoot upwards at anytime.
If you're a option trader, consider buying the premium which is having the liquidity. Consider exiting near 4100 to protect your profits.
Thanks & regards,
Alpha Trading Station

$UPRO Long - My New Favorite ETF - $150+ Long Term TargetAMEX:UPRO is one of those indexes that beats the S&P quite regularly and is a good way to diversify a retirement account or portfolio. In my opinion, it is one of my favorite ETFs out there and may become a new part of my investment strategy, if not already. As always, none of this is investment or financial advice. Please do your own due diligence and research.

EUR/USD Bounces From Support – Bulls Showing StrengthOn the EUR/USD 10-minute chart, price has reacted cleanly from the 1.1579 support zone, forming a bullish bounce after a sharp decline. If buyers maintain momentum, the pair could push back toward the recent highs around 1.1605–1.1615. This support level has held multiple times, making it a key zone to watch. A sustained move above current structure may confirm further upside, while a break below 1.1579 would invalidate the bullish scenario. Patience and confirmation remain essential.

ARPL, 1D - Bullish divergence with volumes supportingARPL, 1D,
Bullish divergence with volumes supporting the move. Now RSI is also showing momentum.
Investment item (Enjoy Dividends too) :)
Arsalan Anwer
Stags

Airbnb - Long Strong Volume Support Zone
The largest volume cluster is between $120–122, exactly where the stock is currently sitting.
This shows a major accumulation zone, meaning institutions and traders are defending that level.
Demand Zone Rejection
Each time ABNB drops into the $120 region, buyers step in and push the price back up — a clear sign of support strength.
The recent candle also shows rejection wicks from below, suggesting buying pressure returning.
Healthy Correction Inside Range
The price is in a sideways consolidation between roughly $120 (support) and $131 (resistance).
This range allows accumulation before a possible breakout — classic base-building behavior after a pullback.
Low-risk entry zone
Entering near $121–122 gives an excellent risk/reward ratio since stop loss can be placed just below $118, minimizing downside exposure.

Gold price corrected below 4100 according to the trendline✍️ NOVA hello everyone, Let's comment on gold price next week from 11/17/2025 - 11/21/2025
⭐️GOLDEN INFORMATION:
Gold (XAU/USD) slid nearly 2% on Friday but rebounded after hitting a daily low of $4,032, as rising expectations of a Fed pause followed hawkish remarks from policymakers. Despite the intraday recovery, the metal remains under $4,100, down 1.72%
⭐️Personal comments NOVA:
Gold price has a big correction below 4100, still maintained in the uptrend line H3, H4. Accumulating and recovering
🔥 Technically:
Based on the resistance and support areas of the gold price according to the H4 frame, NOVA identifies the important key areas as follows:
Resistance: $4149, $4247
Support: $4015, $3925
🔥 NOTE:
Note: Nova wishes traders to manage their capital well
- take the number of lots that match your capital
- Takeprofit equal to 4-6% of capital account
- Stoplose equal to 2-3% of capital account
- The winner is the one who sticks with the market the longest

Generational Wealth | Precious Metals Super Cycle | Palladium Strategy: Impulse Correction
Direction: Bullish
Moving Average: Blue above Red
Fib Retracement: 38.2 reached
MACD > 0
Support : Finding additional confluence, as the weekly bounces off a massive support structure.
Alongside this, we can see that a reverse pattern is becoming clear with additional support illustrated by the support level in the form of the rectangular red box.
1st Target = 1678
2nd Target = 1836
3rd Target = 2039
Lots: 0.1 (Plan to pyramid into this one)
INSIGHTS: Precious metals continue to show strength with a weakening dollar. Pay attention to the DBC commodity Index which is indicating strength across the commodity complex. Alongside this, the DXY is sitting at an interesting level. Lets see whether will bounce at this level off a multiyear trend or whether the dollar will give way to lower lows in the coming months.

HOW-TO: Analyze Support, Resistance & Short-Term DirectionHOW-TO: Analyze Support, Resistance & Short-Term Direction Using Volume Scope Pro (1H Example)
Introduction
This HOW-TO explains how to use the Volume Scope Pro — Order Flow Volume Analysis indicator to identify support and resistance, interpret order-flow signals such as absorption and distribution, evaluate buyer/seller strength, and determine a short-term market bias on the 1-hour timeframe.
1 — Chart Settings & Data Inputs
• Main timeframe: 1H
• LTF (Low-Timeframe data): 15-second volume blocks
• LTF coverage: ~115 bars
• Instrument: MES1! (CME Micro E-mini S&P 500)
This setup provides a high-resolution view of order flow behind each hourly candle by aggregating ultra-low timeframe volume behavior.
2 — Buy & Sell Volume Behavior
BUY Side:
• Buy Current Amount ≈ 18.539K
• 20-period Buy Average ≈ 54.044K
→ Buyers are significantly below their normal activity level.
→ Interpretation: Buyers are NOT supporting current price levels.
SELL Side:
• Sell Current Amount ≈ 17.073K
• 20-period Sell Average ≈ 50.857K
→ Sellers are also below average, but buyer weakness is far more pronounced.
Summary:
In higher timeframes like 1H, lack of buyer activity is often more important than strong selling. Here, buyers are too weak to create a sustained bottom.
3 — Trend Angle Convergence & Divergence (Trend θ)
BUY:
• Price vs Buy Volume (3 and 20 periods) = Divergent
→ Price attempts to hold or bounce are NOT backed by buyer aggression.
SELL:
• Price vs Sell Volume (3-period) = Convergent
→ Short-term movement is driven by sellers, strengthening the bearish bias.
4 — Delta Analysis
• Current Delta ≈ +1.46K
• Global Delta (100 candles):
– Positive Δ Sum ≈ 273.812K
– Negative Δ Sum ≈ 225.671K
Interpretation:
Although short-term delta is positive and long-term delta slightly favors buyers, the price structure does NOT reflect bullish dominance.
This type of delta behavior often indicates absorption rather than a trend shift — meaning buyers are active but ineffective at moving price.
5 — Support & Resistance Zones (SR Engine)
Volume Scope Pro identifies two main zones:
• Resistance Zone: 6880.75 ~ 6885.25
• Support Zone: 6707.75 ~ 6766.75
Current Position:
Price is holding inside the upper boundary of the Support Zone.
There was a minor bounce, but the reaction lacked strength and failed to break structural highs.
6 — Order-Flow Overlay Signals (OB / Distribution / Absorption)
• Multiple OB and Distribution labels appear near upper structure → clear signs of supply, selling pressure, and exhaustion at highs.
• OS and ABS signals at support did not result in meaningful continuation → weak follow-through from buyers.
Combined with weak buy volume, the market shows bearish intent.
7 — Short-Term Projection
Given:
✓ Weak buy volume compared to averages
✓ Sellers showing short-term dominance
✓ Converging sell-side angles
✓ Price reacting weakly to support
✓ Strong supply clusters above
✓ Delta showing ineffective buying
→ Short-term bearish continuation is the more probable scenario.
As shown on the chart, the Short Position tool highlights:
• Entry around the upper support boundary
• Stop above the minor pullback high
• Target near the lower support boundary
This forms a clear, structured bearish setup with defined R:R.
Disclaimer
This publication is for educational purposes only. Volume Scope Pro does not guarantee profit or certainty of market direction. Traders must perform independent risk management and verification at all times.

Gold price continues to recover, accumulating above 4200⭐️GOLDEN INFORMATION:
Gold (XAU/USD) trades higher near $4,185 in early Asian hours on Friday, supported by expectations that the reopening of the US government will resume economic data releases and strengthen bets on additional Fed rate cuts.
The longest shutdown in US history ended on Thursday after President Trump signed a funding bill, which passed the House in a 222–209 vote with broad Republican support and a few Democratic votes. Investors now expect upcoming post-shutdown data to show labor market softness, potentially pressuring the US Dollar (USD) and providing near-term support for the USD-priced metal.
⭐️Personal comments NOVA:
Gold price is still in an uptrend, recovering above 4200. Liquidity scan of H1 breakout price zone 4147 completed and recovered.
⭐️SET UP GOLD PRICE:
🔥SELL GOLD zone: 4288 - 4286 SL 4293
TP1: $4270
TP2: $4255
TP3: $4240
🔥BUY GOLD zone: 4100 - 4102 SL 4095
TP1: $4115
TP2: $4130
TP3: $4145
⭐️Technical analysis:
Based on technical indicators EMA 34, EMA89 and support resistance areas to set up a reasonable BUY order.
⭐️NOTE:
Note: Nova wishes traders to manage their capital well
- take the number of lots that match your capital
- Takeprofit equal to 4-6% of capital account
- Stoplose equal to 2-3% of capital account

Gold price recovers to 4250, nearest target⭐️GOLDEN INFORMATION:
Gold (XAU/USD) extends its rally to around $4,195 during the early Asian session on Thursday, marking its highest level since October 21. The metal gains ground as investors await a crucial US House vote to end the record-long government shutdown, which could bring economic clarity and shape the Federal Reserve’s (Fed) next policy steps. Later in the day, Fed officials Neel Kashkari, Alberto Musalem, and Beth Hammack are scheduled to speak.
The House of Representatives is expected to vote on the Senate-approved funding bill, backed by Democrats, to reopen the government and restore federal operations through January 30.
⭐️Personal comments NOVA:
Bulls are positive, expecting the final cut in December. Gold prices return to the above 4200 price zone.
⭐️SET UP GOLD PRICE:
🔥SELL GOLD zone: 4252 - 4250 SL 4257
TP1: $4240
TP2: $4220
TP3: $4200
🔥BUY GOLD zone: 4148 - 4146 SL 4141
TP1: $4160
TP2: $4175
TP3: $4190
⭐️Technical analysis:
Based on technical indicators EMA 34, EMA89 and support resistance areas to set up a reasonable BUY order.
⭐️NOTE:
Note: Nova wishes traders to manage their capital well
- take the number of lots that match your capital
- Takeprofit equal to 4-6% of capital account
- Stoplose equal to 2-3% of capital account

Gold price recovered around 4100⭐️GOLDEN INFORMATION:
Gold (XAU/USD) holds near a three-week high during the Asian session on Wednesday, with bulls eyeing a breakout above the $4,150–4,155 resistance zone for further upside. Market sentiment remains supported by expectations that delayed US economic data will reveal weakness amid the ongoing government shutdown, reinforcing bets on another Federal Reserve (Fed) rate cut in December. This dovish outlook keeps the US Dollar (USD) near a two-week low, providing additional support for the non-yielding metal.
⭐️Personal comments NOVA:
Gold price recovers, accumulates around 4100. Buying force is forming wave 4 according to Elliott.
⭐️SET UP GOLD PRICE:
🔥SELL GOLD zone: 4198 - 4200 SL 4205
TP1: $4190
TP2: $4175
TP3: $4160
🔥BUY GOLD zone: 4090 - 4092 SL 4085
TP1: $4105
TP2: $4120
TP3: $4135
⭐️Technical analysis:
Based on technical indicators EMA 34, EMA89 and support resistance areas to set up a reasonable BUY order.
⭐️NOTE:
Note: Nova wishes traders to manage their capital well
- take the number of lots that match your capital
- Takeprofit equal to 4-6% of capital account
- Stoplose equal to 2-3% of capital account
