XAG/USD - H4 - Long in green areas!Silver is near value area for Long positions.
Between green areas ( 23.100$ - 22.400$ ) you can set your buy limit positions.
Manage your RISK!!!
Do not enter any positions by your whole margin
Longposition

ZIL Perfect 0.702 Fib Confirmation! Not many know about OTE ;)Zilliqa USDT
OTE stands for Optimal Trade Entry. It's our secret weapon.
OTE is the Fib level between 0.786 and 0.618. It is 0.702 and it has been my best friend in trading for a long time (apart from John lol).

Is GOLD Ready to Rip?! Long Term Breakout Looming
It's a pretty clear long-term horizontal range in gold.
The break of a downtrend line suggests another test of the range top.
Here is a bullish scenario for what follows.
The Trade- enter at the breakout, add more on the pullback, cut losses if price moves back into the range or add more on the break of the high formed after the break - then ride it to 2200 and more...

EURCAD This position is continuously making a strong momentum uptrend and thereby increasing my potential gain to 3%.
Hope this continuous but so far so am happy with the outcome should it hit my SL.

Video - Powerful EUR Fundamentals - AI suggests Technicals AlignGreetings, fellow investors, and welcome traders!
I t's a video tutorial to share the knowledge behind my charts. If you're tuned, I'll continue sharing follow-up AI and FOREX content because there's much to learn from each other.
T oday, I'm excited to share with you a fascinating generative chart I've created using a deep learning neural AI. This advanced technology enables us to analyze historical price data and identify potential future price movements.
I t's a bullish trend, with daily candles aligned in an upward trajectory. I've initiated a long position at the support level, and our AI analysis indicates the potential for further growth up to the resistance level.
While we might encounter a slight pullback below the double resistance, it's important to note that investor sentiment doesn't suggest any significant bearish signals.
S tay tuned for follow-up content where we'll delve into more trading scenarios and strategies.
It's not an investment advice.
Kind regards,
Ely

The bulls have a major advantage⭐️ Smart investment, Strong finance
⭐️ GOLDEN INFORMATION:
Gold: The next milestone to watch out for is the 2023 high, reaching approximately $2070.
The price of gold continued to rise towards the end of last week, ultimately closing above the important threshold of $2000 per troy ounce. However, this increase in value was accompanied by a decrease in open interest, indicating the possibility of a correction in the near future. Meanwhile, the next significant resistance level for gold is expected to be the peak of $2067 reached in 2023 on May 4th.
⭐️ Personal comments NOVA:
The beginning of the week witnessed great FOMO among bulls. Gold price is approaching the strong resistance zone in 2020. This is the period when Gold price creates a new peak this year.
⭐️ SET UP GOLD PRICE:
🔥BUY GOLD zone: $2001 - $2003 SL $1997 scalping
TP1: $2009
TP2: $2014
TP3: $2020
🔥BUY GOLD zone: $1990 - $1992 SL $1982
TP1: $2000
TP2: $2012
TP3: $2020
⭐️ Technical analysis:
Based on technical indicators EMA 34, EMA89 and support resistance areas to set up a reasonable BUY order.
⭐️ NOTE:
Note: Nova wishes traders to manage their capital well
- take the number of lots that match your capital
- Takeprofit equal to 4-6% of capital account
- Stoplose equal to 2-3% of capital account
- The winner is the one who sticks with the market the longest

The cup and handle formation XRPUSDTHow Did the Cup and Handle Pattern Form?
The cup and handle formation appears when there has been an upward movement pattern. This is a bullish upward continued pattern.
The trend is confirmed as cup and handle formation only when the stock price surpasses the resistance level and shows an upward movement. Only then can a trader get a confirmation that the higher price stock movement is going to sustain.
When a stock begins to move upwards and shows a bullish pattern, traders continue to invest in the stock’s growth and positive trend. As the stock breaches high levels, investors who came in at the beginning of the uptrend start booking profits. At this level, the upward trend halts, and the price falls with selling pressure. At this stage, the cup formation curves downwards in a bowl shape. As traders and investors continue to book profits, the cup moves lower, indicating a temporary downward cup.
At these levels, savvy investors, traders, and institutions begin to pump funds into the stock at attractive levels due to the fundamentals of the stock or value buying. At these low price levels, buying comes in, and with buying pressure, the cup curvature starts moving up to reach the resistance line. At this stage, an entire curved bowl-shaped cup is seen.
The handle emerging here is interesting to note and indicates human psychology. The trader who had invested at the peak of the resistance line before the stock dipped is eager to take his capital back as the stock moves up. Moment stock touches the resistance level, and this trader sells. Also, the traders who started buying at the bottom of the cup look at the resistance point as a safety level to book profits. There is selling pressure at resistance levels, and the upward cup shape is halted.
The volume of stocks also identifies the cup and handle at the beginning of formation at the end of the cup curve. The volume of shares is low at the end of cup formation as the selling is not heavy here. The investors who bought at the previous resistance level their capital and sell. Short-term traders without a fundamental view sell at the seeming peak of the stock.
The institutions and experienced investors hold on to the stock bout at cup bottom. The selling volumes are low and don’t push the stock price down. The buying also continues, and if large volumes of buying hold, the stock breaks the resistance level, and upward trends emerge, making a handle pattern.

NZD/ CHF !! Aiming for higher highs during the week✍️ NOVA hello everyone, Let's comment on gold price next week from , Last week of November
🔥 Identify:
Prices are in a long-term upward trend at the end of the year. During the week, the price will adjust downward after reaching the resistance area but will continue to increase to reach a new peak
🔥 Technically:
Based on the resistance and support areas of the gold price according to the H4 frame, NOVA identifies the important key areas as follows:
Resistance: 0.53950
Support : 0.53350, 0.52900
🔥 NOTE:
Note: Nova wishes traders to manage their capital well
- take the number of lots that match your capital
- Takeprofit equal to 4-6% of capital account
- Stoplose equal to 2-3% of capital account
- The winner is the one who sticks with the market the longest

SMGR completed wave and in progress of ABC waveSMGR look to complete the ABC wave.
I'm not export in wave, just share my personal ideas only.
Hope it works out.

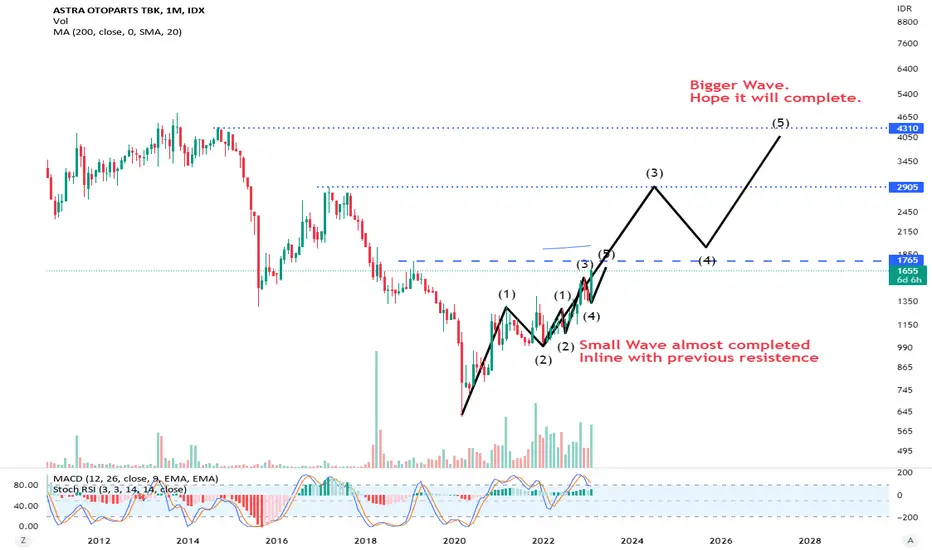
AUTO journey to complete next wave. See previous post as wellAs stated in previous posting, AUTO has completed the small wave and looking for bigger wave completion.
Still long journey but hope for the best.
GBPJPY Long 3/8 Trap Monthlylooks like a bullish outlook on the monthly charts considered executing a position for long term profits.

Hercules Hoists Breaking All Time High? Wait for Confirmation Seems like Hercules Hoists is breaking the all-time-high resistance at Cmp 360.
It just need the next candle to close above the resistance zone.
+ it also lacks the volume.
Aur kuchh puchhna hai to aao 8800611235

USDCAD local longOn the USDCAD chart, we can observe an open interest in local growth.
The price decisively carried out a liquidity sweep and received a reaction with the prospect of further growth.
I consider updating the maximum at the mark - 1.3777 as the nearest goal.
Keep your risks and act according to your own trading system

A Clean Breakout Candidate Can u analyze and tell me how it's a good candidate to watch out for tomorrow?

AUDCHFLINKUSDT is trading in descending channel and printing consistent HH HLs. Recently the price is broken the important support zone and now retesting the broken level, which is also the 50% Fib retracement level.
If the sell momentum continues the next target could be 0.5900followed by 0.6000 region.
What you guys think of this idea?

I'll Go To The Moon (ALGOUSDT)ALGO has been trading in an ascending broadening wedge pattern since 19th October.
In that time it has risen by ~67% and is once again trading above all EMA's. The market is shaky at the moment and any drops in BTC are causing bigger drops in alts, but any increase in BTC is not necessarily increasing alts much.
In any case, despite the very recent downward pressure ALGO found support around $0.13 and is looking to push up to the top of the channel for a short-term 20% increase. In the mid-term, if a breakout of the channel occurs we can target the $0.20 range.
If there is any major downward pressure, ALGO could fall considerably to $0.10, but that seems unlikely for now.
It has been a while since ALGO has shown some strength, now that it has the explosion should be big.
Please note I am not a financial advisor and this is not financial advice. All ideas are for educational purposes only.
Please feel free to leave your comments and thoughts below!

Tata Motors on Weekly Chart Looking Good for Mid Term InvestmentAre you looking for a Breakout Stock? It's right here.
What - Tata Motors on Weekly Chart
Why - Just Broke Out of Resistance.
How - I used Fibonacci Retracement to spot Exact Levels.
What's your view on this? Please share.
Contact 8130724243 for Stock Market Courses from NSE Academy. We are affiliated with Empirical F&M Academy and NSE Academy.
Hope this post adds valuable insights to your trading/investment journey.
Don't forget to share with your friends. (*Bcz as your friends join you will have someone like-minded with whom you can share and discuss and bring clarity to your learning and life.*)
***
Disclaimer:
Please note that this is only for Study Purpose and not a recommendation.
So please do your own research before investing in market.
#BreakoutStock #TradingStrategies #StockMarket #Nifty #chartpatterns #indicators

Btc buy signal Btc buy signal long trade
U can use it with 1% stop loss
Best indicator ever
For any questions u can write me

USD/JPY Bullish Trade Setup: Buy Limit at 149.5This USD/JPY trade strategy capitalizes on the currency pair's strong uptrend as identified from the monthly, weekly, and daily charts. The current price near 149.5 presents a compelling entry point for a bullish position. The setup involves:
Entry Point: A buy limit order at 149.5, positioned just below the current market price, aiming to capture potential upward momentum.
Stop Loss: Set at 148.5, below a recent swing low on the daily chart, providing a safeguard against unexpected downward movements.
Take Profit: The initial target is 151.5, just below the key resistance level of 152.0. This level is chosen based on the price’s historical performance, where it has yet to break this significant barrier.
The trade is backed by an overarching bullish trend, reflected in the higher highs and lows observed across all three timeframes. While the fundamental outlook indicates the USD's strength, particularly with better-than-expected retail sales data, the high sell sentiment in the market suggests a possibility of a short squeeze, further supporting a bullish approach.

HD Expectations (FLAG)Home Depot (HD) exhibits several bullish indicators that suggest a potential upward trajectory. Firstly, the company consistently demonstrates robust financial performance, with strong revenue growth driven by increased consumer spending on home improvement. Additionally, HD's market dominance, extensive store network, and successful online presence position it favorably to capitalize on evolving consumer trends.
Furthermore, the housing market's resilience and ongoing demand for home improvement projects, coupled with the company's proactive strategies in adapting to changing consumer preferences, create a favorable environment for HD's continued growth. Analysts' positive sentiment, coupled with the company's solid fundamentals, make a compelling case for a potential upward trend in HD's stock price.

BTC/USDT 3D Long wayExecuse me!
That's all I'd like to share in short. The trend is rising on the 3-day view. In my opinion, after a retest, the price may start to rise slowly.
Write down what you think!?
Is this analysis possible?

Prism Johnson Ltd ( LTP : 156 )Go long for prism Johnson forming inverse head and shoulder with rsi support buy on dips for the target of 250-255 holding period 1/1.5 years

Render (RNDR) ultra long, mega bullishA daily close above 2.75 and RNDR looking hot hot. Could this be the start of a mega break out, that you could hold for the whole bull run - I think so.
Either way, here's a set up for a potential 30% trade.
Zoom in on daily timeframe or just remove the noice and look have beautiful this chart is on weekly timeframe.
RNRD is risky - but it could be huge next year - non financial advice.
A potential pull back can happen (after the explosion today), but I think the time for a good entry is start to running out. Play it with your risk tolerance.
RLong
