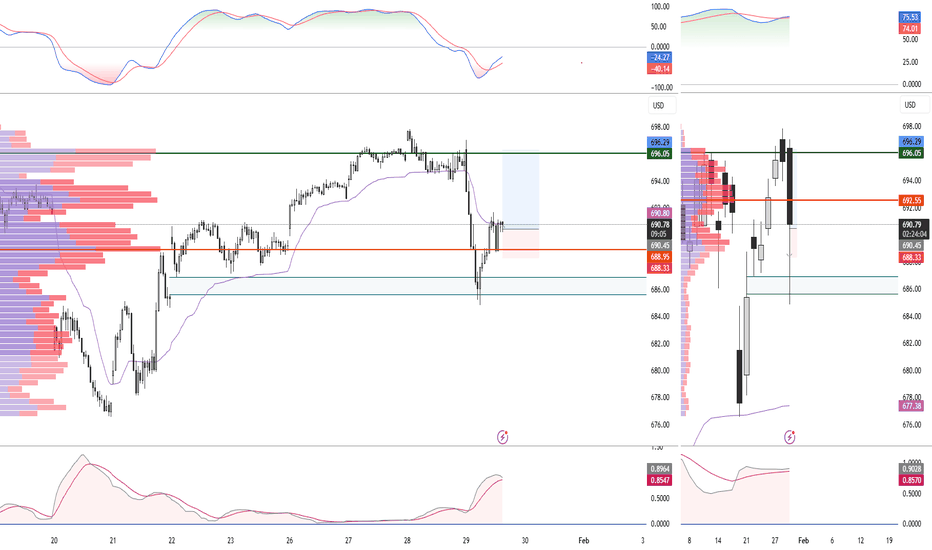
LIVE Trading on Lam Research (LRCX)LIVE Trading on Lam Research (LRCX)
Price is currently positioned at the lower boundary of its valid channel, while at the same time two valid divergences are present on the MACD and RSI. In addition, all the specific conditions of one of my personal trading systems have been met.
Follow proper risk and money management.
This is just my personal view, so please trade based on your own strategy and trading system.
Follow me on TradingView for more analyses and live stock trades.
NASDAQ:LRCX
Longsetup
USDJPY - "Look for Longs" Positioned At A Powerful IntersectionThe chart shows a bullish continuation setup based on a high-probability "confluence" zone. Here is the short breakdown:
The Setup: Price has retraced to a major intersection where a long-term ascending trendline meets a horizontal support zone (formerly resistance) around the 151.00 - 152.00 level.
The Strategy: Traders are looking for a "bounce" here. The goal is to enter long positions, betting that the historical support will hold and push the price back up toward the recent highs (158.00+).
The Risk: If the price breaks and closes below the blue trendline, the bullish thesis is cancelled, suggesting a deeper trend reversal is underway.
EURUSD - Price Is Retesting A Break Of Structure On DailyEURUSD is in an uptrend within an ascending channel, approaching the upper resistance boundary near 1.06–1.08.
Price is pulling back to test this resistance; if it holds as support with bullish confirmation (higher lows), enter longs targeting channel extension higher.
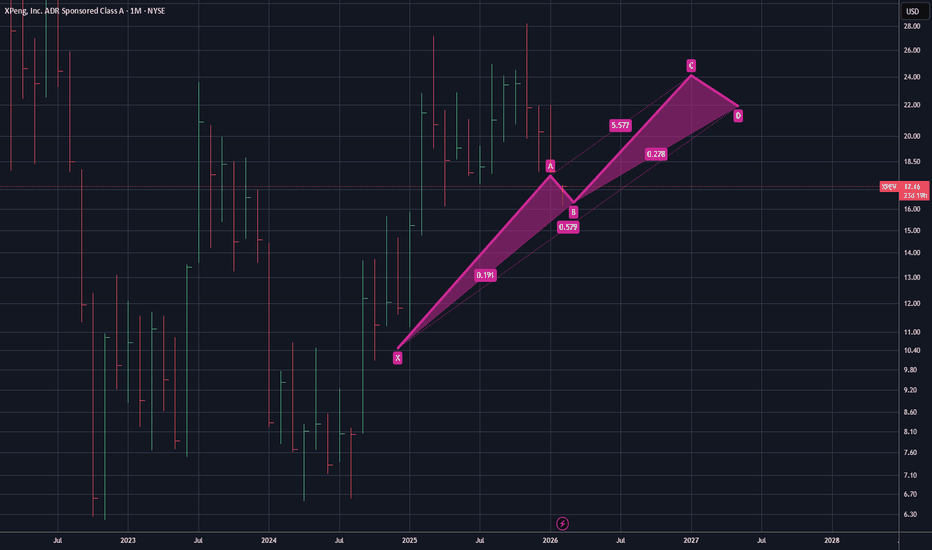
$XPEV - Next Leg Up? $24 Target by 2027XPEV's correlation seems to be bottoming out the bearish leg. I believe that with enough bullish support, the next wave up seems to be trending to $24 by the year 2027. If that is true, that sets up a decent step-in for a long. As always, none of this is investment or financial advice. Please do your own due diligence and research.
Gold Breaks Its Trend – Sellers Take ControlAfter a sharp rally to record highs, XAUUSD has officially entered a structural weakening phase , no longer just a normal corrective pullback. Pressure from a stronger USD, expectations that the Fed will maintain a hawkish stance, and aggressive profit-taking in the derivatives marke t have all combined to drain gold of its short-term bullish momentum.
On the chart, the downtrend is becoming increasingly clear . Price has been rejected repeatedly at higher resistance zones, forming a sequence of lower highs, while the descending trendline continues to act as a key ceiling. The fact that price is trading below the Ichimoku cloud signals that sellers are firmly in control of the short- to medium-term trend.
The current rebound toward 4,850 is purely technical in nature. If price fails to break above this area and gets rejected again, selling pressure is likely to resume . In that case, the 4,350 zone becomes the next logical target, where the market may pause and react.
Overall, both the news backdrop and price structure are aligned to the downside . In this environment, the more appropriate strategy is to prioritize trend-following trades, patiently waiting for pullbacks to look for sell opportunities, rather than trying to catch a falling knife while sellers remain dominant.
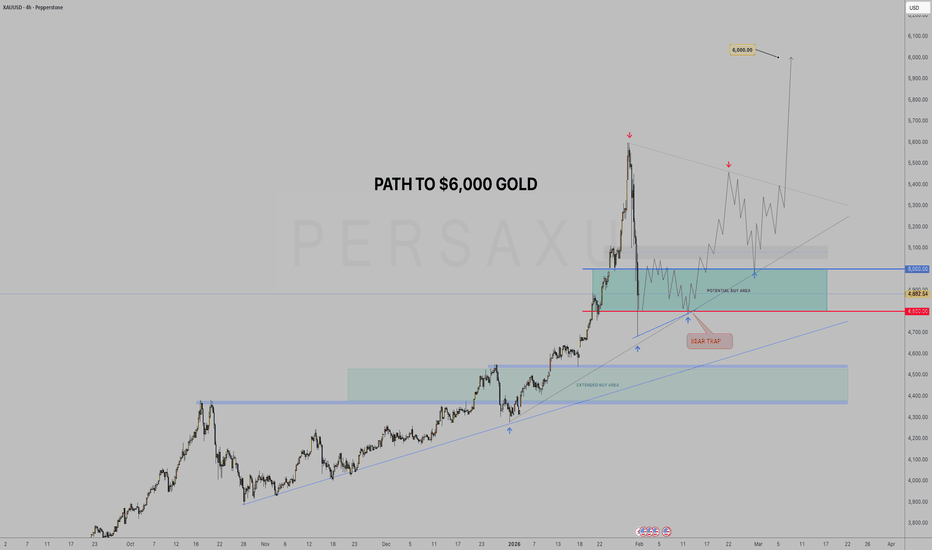
Correction - Accumulation below 5000⭐️GOLDEN INFORMATION:
Gold (XAU/USD) retreats more than 4% on Monday after the US President Donald Trump announced his pick to lead the Federal Reserve (Fed) in succession to the Fed Chair Jerome Powell. Economic data in the US paint an optimistic outlook as manufacturing activity improves. At the time of writing,XAU/USD trades at $4,681.
XAU/USD sinks below $4,700 as markets reprice a firmer Fed outlook and US manufacturing hits multi-year highs
Since last Friday, Gold price tumbled by over 14%. Although the nomination of Kevin Warsh was seen as one of the catalysts behind the precious metals rout. Economic activity in the manufacturing sector improved the most, reaching levels last seen in 2022, according to the Institute for Supply Management (ISM).
⭐️Personal comments NOVA:
Gold prices continue to consolidate below 5000 - selling pressure cools down the market, leading to greater stability.
⭐️SET UP GOLD PRICE
🔥SELL GOLD zone: 4996 - 4998 SL 5003
TP1: $4980
TP2: $4965
TP3: $4950
🔥BUY GOLD zone: 4400 - 4398 SL 4393
TP1: $4415
TP2: $4444
TP3: $4470
⭐️Technical analysis:
Based on technical indicators EMA 34, EMA89 and support resistance areas to set up a reasonable SELL order.
⭐️NOTE:
Note: Nova wishes traders to manage their capital well
- take the number of lots that match your capital
- Takeprofit equal to 4-6% of capital account
- Stoplose equal to 2-3% of capital account
Beautiful retracement!DHI Analysis (Nasdaq)
CMP 149.64 (02-02-2026)
Beautiful retracement till Golden Pocket Zone around 113 - 115.
Bullish Divergence appearing on Weekly tf.
Crossing & Sustaining 195 may lead it towards 245 - 247.
However, if 113 is broken in any case,we may witness further selling pressure.
Bitcoin Ethereum and Solana show bullish structureBTC , SOL , and ETH are all three coins most likely to show growth, as BTC is expected to rebound from the resistance line we reached (~$74,450 and ~$78,000)
We also collected all the main liquidity from the bottom, leaving behind a huge volume of liquidity now higher
BTC also failed to break the trend line and formed a structure, with the low above the previous one (by ~0.13%), so we are still in an upward trend
The resistance line has not been broken, and even if it is, with the formation of a descending structure, there will still be a price rebound and a small upward rebound
The unemployment data is expected in the coming days. The index is likely to drop from 4.4% to 4.5%, which will have a positive impact on the market, as this is not a critical increase. This means investors will expect a Fed rate cut, which will create additional liquidity and will be more likely to buy back
Globally, we have also formed the right shoulder of the Head and Shoulders pattern, which I wrote about last year.
Forming the right shoulder is always a sign of success. The bullish flag pattern is the originating pattern
We also see ABC correction waves formed, after which a 5-stage growth cycle usually begins
It's too early to take a more global view of the scenario...
Full breakdown with levels and graphs on the website
Trading Gold Without a Stop Loss: A Slow Suicide1️⃣ No Stop Loss Is Not Courage
Many traders believe that trading gold without a Stop Loss shows confidence, toughness, or the ability to withstand volatility.
In reality, it often means the opposite.
Not using a Stop Loss usually comes from one simple reason: an unwillingness to admit being wrong. When price moves against the position, instead of accepting a controlled loss, traders choose to hold and convince themselves that gold will eventually come back.
The problem is that the market does not operate on personal belief.
Not having a Stop Loss does not make you stronger.
It only makes your mistakes harder to fix.
2️⃣ In Gold Trading, No Stop Loss Means No Brakes
XAUUSD is a high-volatility market that reacts aggressively to news and capital flows.
Price can move far and fast — sometimes within minutes.
Trading gold without a Stop Loss is like driving downhill without brakes.
At first, it may feel manageable.
But once momentum accelerates, you no longer have a choice.
Gold does not care where you entered.
And it will not stop just because your account is in pain.
3️⃣ A Trade Without a Stop Loss Rarely Kills You Instantly
The real danger is that it kills you slowly.
It starts with a small drawdown.
Then a deeper one.
Until you no longer have the emotional clarity to exit.
What began as a trade becomes:
- A holding position
- A hope trade
- A prayer trade
At that point, it is not just your account at risk — your discipline and mental control are already gone.
And once emotions take over decision-making, the outcome is usually inevitable.
4️⃣ Long-Term Traders Are Not the Ones Who Win the Most
They are the ones who lose with limits.
A Stop Loss is not there to be hit.
It exists so you always know:
- Where you are wrong
- How much you are willing to lose
- And whether you can come back tomorrow
In gold trading, a Stop Loss is not a personal preference.
It is the price of staying in the game.
Without it, sooner or later, the market will teach you this lesson — with real money.
BTCUSD making head and shoulder pattern.One time oppurtunity.Head and shoulder pattern is likely to form in weekly pattern if 74500 holds.
If it breaks 74500 abondon this idea..
A successful H&S can take the price to 22.5K
Presently right shoulder formation is likely possible upto 108K.
Dont loose this oppurtunity to go long now till 108k and then short from 108k.
play safe with required leverage.you can turn 1k to 10k or more with this kind of patterns.
BTCUSD: Is Every Pullback a Trap?BTCUSD is currently trading within a clearly defined bearish trend , as both news flow and technical structure favor the sellers . Short-term capital has become more cautious, buying momentum has weakened after the prior strong rally, and there is no sufficiently strong catalyst to trigger a genuine trend reversal.
From a news perspective, the macro backdrop remains risk-off . The USD stays relatively stable, while expectations for policy easing remain uncertain, leaving Bitcoin without the momentum needed for a sustainable upside move. As a result, current rebounds are mostly technical in nature, rather than signals of a new bullish trend.
On the chart, the bearish structure remains intact, with a consistent sequence of Lower Highs and Lower Lows. Price continues to respect the descending trendline and has been repeatedly rejected on rallies, confirming that sellers are still in control. The Ichimoku cloud above price acts as dynamic resistance, further limiting recovery attempts.
The 84,900 zone stands out as the nearest and most critical resistance. This area represents a confluence of the descending trendline and a technical pullback zone , making the probability of renewed selling pressure relatively high. On the downside, 80,600 remains a strong support level, where price may react or form a short-term technical bounce.
Overall, BTCUSD is in a controlled bearish phase . As long as price fails to break and hold above the descending trendline , rebounds should be viewed as sell-the-rally opportunities, rather than reasons to rush into expecting a long-term bottom.
Correction - Gold begins to fall✍️ NOVA hello everyone, Let's comment on gold price next week from 02/02/2026 - 02/06/2026
⭐️GOLDEN INFORMATION:
Since the announcement, Gold prices have reaccelerated their losses, while the Greenback recovered, despite being poised to sustain losses of over 1.42% in January, based on the US Dollar Index (DXY).
The DXY, which measures the US currency performance versus six peers, surges 0.74% to 96.87, a headwind for Bullion prices.
Long-dated US Treasury yields are rising in a sign that speculators see fewer odds that Warsh could cut rates “indiscriminately” to please the White House. The US 10-year Treasury note yield is up one-and-a-half basis points at 4.247% as of writing.
⭐️Personal comments NOVA:
Gold prices have begun a major downward correction, falling below 5000 due to profit-taking pressure.
🔥 Technically:
Based on the resistance and support areas of the gold price according to the H4 frame, NOVA identifies the important key areas as follows:
Resistance: $4995, $5164, $5453
Support: $4675, $4532
🔥 NOTE:
Note: Nova wishes traders to manage their capital well
- take the number of lots that match your capital
- Takeprofit equal to 4-6% of capital account
- Stoplose equal to 2-3% of capital account
- The winner is the one who sticks with the market the longest
Buy Signal Given on HOODTrading Fam,
Keeping this trade simple here with low risk. Received a "BUY" signal from my Pivot Zones Indicator and I'm entering the trade. We are above the 200-day SMA. I want to shoot for that fairly recent gap down that was made at the end of last year as a target. I will exit if we drop much below that 200-day SMA. At entry, this trade was a 1:5.4 rrr.
✌️Stew
Live trading on AdobeLive trade on Adobe
The primary analysis can be found in the linked post
Follow proper risk and money management.
This is just my personal view, so please trade based on your own strategy and trading system.
Follow me on TradingView for more analyses and live stock trades.
NASDAQ:ADBE
USDJPY: Is Every Bounce a Trap?When viewing USDJPY through a calm and disciplined lens , the market is currently sending a very clear message: the bearish move is not over yet .
From a news perspective, the focus is no longer on whether the USD is strong or weak, but rather on the growing fear of potential intervention from Japan . Each time the pair attempts to bounce, market sentiment immediately turns cautious . This hesitation drains momentum from upside moves, while JPY gets bought as a defensive response. This creates a controlled bearish environment, where no major negative headline is needed — persistent pressure alone is enough to push price lower.
Looking at the chart, the bearish structure is forming cleanly . After the sharp drop, USDJPY attempted a recovery but failed to break above the 153.2–153.3 resistance zone, while being rejected by the descending trendline and the Ichimoku Cloud. This rebound appears technical rather than accumulative, signaling that buyers are not truly stepping in.
With price repeatedly rejected from this area, the most logical scenario remains trend continuation to the downside , rather than a reversal. On the lower side, the 150.8 zone stands out as the first area where the market may attempt to find a reaction. Until this structure is clearly invalidated, expecting a sustainable bullish move remains premature.
XAG/USD – A Market That Refuses to Go LowerThere is one thing that stands out very clearly on XAG/USD right now:
the market has absolutely no intention of moving lower.
The news flow is quiet, with no major shocks — and paradoxically, that is exactly what favors the BUY side. The Fed is not hawkish enough to choke precious metals, real yields are failing to create pressure , and defensive sentiment remains quietly present beneath the surface.
For silver, the narrative is even stronger than gold: it is both a safe-haven asset and an industrial metal. Capital inflows are not speculative hit-and-run trades — this is hold, push, and accumulate behavior.
Looking at the chart, price is clearly advancing within a clean and steep ascending channel. Every pullback is disciplined and controlled — p rice taps the lower trendline and immediately reacts upward. No panic, no aggressive sell-offs.
This is a textbook sign that smart money is in control, not a market driven by FOMO.
Ichimoku may only be playing a supporting role here — but it is an extremely reliable one. Price is firmly above the cloud, the cloud itself is sloping upward, and the distance between price and the cloud confirms that bullish momentum still has room to run. There are no signs of exhaustion or distribution at this stage.
The 112.7 zone is not a level to fear — it is a trend-validation boundary. As long as price holds above this area, every retracement should be viewed as an opportunity for the market to reload. And once momentum is fully rebuilt, a move toward 124.3 becomes a matter of time, not doubt.
Prices are constantly rising - 5652⭐️GOLDEN INFORMATION:
Gold price (XAU/USD) surges to a fresh record high of $5,579 before retreating to around $5,500 in early Asian trading on Thursday. The rally of the precious metal is bolstered by strong safe-haven demand amidst persistent geopolitical tensions, economic uncertainty, and a weaker US Dollar (USD).
Geopolitical tensions persisted after US President Donald Trump issued fresh warning to Iran on Wednesday. Trump urged Iran to “come to the table” and negotiate a “fair and equitable deal” that would prohibit the development of nuclear weapons or the next US attack would be far worse. Meanwhile, Iran responded with a threat to strike back against the US, Israel and those who support them.
⭐️Personal comments NOVA:
With tariffs combined with the risk of another US government shutdown, gold continues to show its current overwhelming appeal. The price increase is too sharp.
⭐️SET UP GOLD PRICE:
🔥SELL GOLD zone: 5652 - 5654 SL 5659
TP1: $5640
TP2: $5620
TP3: $5600
🔥BUY GOLD zone: 5402 - 5400 SL 5395
TP1: $5420
TP2: $5440
TP3: $5460
⭐️Technical analysis:
Based on technical indicators EMA 34, EMA89 and support resistance areas to set up a reasonable BUY order.
⭐️NOTE:
Note: Nova wishes traders to manage their capital well
- take the number of lots that match your capital
- Takeprofit equal to 4-6% of capital account
- Stoplose equal to 2-3% of capital account
XAU/USD: Uptrend Still Alive — Do You Agree?Hello traders, by combining the current news backdrop with the H1 chart, I still assess that XAU/USD is trading within a clear and well-controlled uptrend.
Do you agree with this view?
To explain this bullish outlook, starting with the fundamental side , gold continues to be supported by expectations that the Fed will maintain a cautious stance. Real yields are not creating meaningful pressure , while safe-haven demand remains quietly present . This keeps capital flowing into the market, and there is currently no reason for the BUY side to step aside in the short term.
From a technical perspective, price is moving cleanly within an ascending channel. After a strong breakout, the market pulled back to retest the immediate support zone around 5,150 — an area where the rising trendline and dynamic support converge. The way price reacts here confirms that buyers remain proactive , and that the pullback is technical in nature rather than a sign of distribution.
Therefore, as long as price continues to hold above this support area, the bullish structure remains intact. In a favorable scenario, after a brief consolidation phase, price has a solid basis to extend the uptrend toward the 5,350 area, in line with the momentum of the primary trend.
Thank you for reading, and wish you all successful trading!
Weak USD, EURUSD Ready to Push HigherIn the short term, the US dollar is lacking strong bullish momentum as markets move into a wait-and-see mode ahead of the Fed , while recent US economic data has failed to trigger fresh USD buying. As a result, USD weakness remains largely technical in nature, indirectly allowing EURUSD to maintain its upward momentum.
From a technical perspective, the market structure is clearly bullish , with higher highs and higher lows firmly in place. The ascending trendline continues to be respected, and each pullback is quickly met with strong buying interest, confirming that c apital is still flowing on the BUY side.
At the moment, the 1.1850 level is acting as a key short-term support. Price consolidating above this zone suggests the market is pausing to build strength rather than distributing. If bullish momentum holds, the next upside target for EURUSD lies around 1.1930, where a higher-timeframe H4 resistance is located.
Combining both fundamental and technical factors, EURUSD shows no clear signs of reversal at this stage. In this environment, the most logical approach remains trading in the direction of the uptrend, looking for buy-on-dip opportunities and avoiding counter-trend SELL positions as long as the bullish structure stays intact.
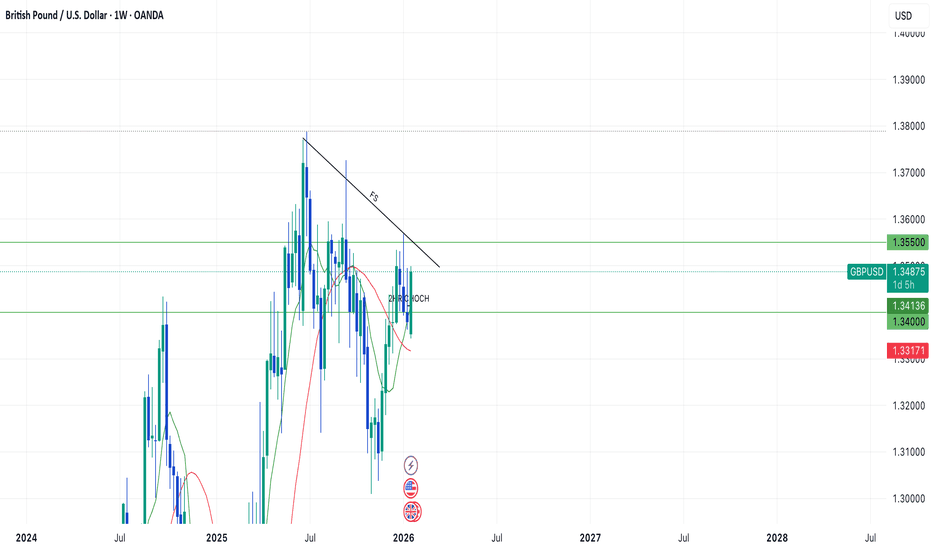
GBPUSD Swing Trade In ProgressHi Traders!
Three days ago I wrote a mind about swinging GU. As I do my top down analysis, here is my trade plan...
Based off of the weekly, GU looked to me that it is in a retracement phase giving a low at 1.30200 then progressing to the upside. With the 3 small candles printed from Monday Dec. 29th to January 12th, GU has then been in progress to make a new bullish engulfing candle (Closing in 1 day).
Moving down to the daily, within the 3 weekly candles, price seemed to be in another retracement dipping into the 50% zone at 1.33500 from the high of around 1.35700. If the 1.33500 higher low is true, then I am looking for price to continue to fill in the weekly wicks.
Furthermore, as I began to look for my entry moving down to the 2HR TF, price came down to a 2HR CHOCH zone bouncing off 1.34000. With no close below and continuation, this gave me the opportunity to fill my order around 1.34500.
My swing targets are 1.35500, and potentially into 1.36000. Based off of my TP targets, I'm looking for price to continue to fill in weekly wicks. Depending on how price reacts to 1.35500/Resistance and if price can stay above 1.35500 with signs of continuation, then I'd consider holding longer.
However, with everything said, I am still taking into consideration that price is in a failed swing, and anything below 1.34000 would invalidate my swing plan.
Entry: 1.34500
TP 1: 1.35500/1.35600
SL: 1.34000
~1:2 RR
*DISCLAIMER: I am not a financial advisor. The ideas and trades I take on my page are for educational and entertainment purposes only. I'm just showing you guys how I trade. Remember, trading of any kind involves risk. Your investments are solely your responsibility and not mine.*


