Usd/Chf - Buy From Liquidity To The Target Current Market Situation:
Current Price: 0.79579
Location: Just above the support zone and below the Order Block (OB).
Recent action: Price rejected strongly from support, showing bullish candles.
Structure: Forming a potential higher low (HL) after a BOS.
How Price Could Reach the Target From Here:
Minor Pullback Expected (Optional):
Price may first dip slightly to retest the immediate support area around 0.79530–0.79500.
This would allow for a higher low (HL) formation and trap early sellers.
Bullish Momentum Kicks In:
After the HL forms, we expect bullish continuation.
Price could form a bullish internal CHoCH or BOS (on 1m–5m TF), signaling aggressive buying from smart money.
This move would target the imbalance / inefficiency left above, which aligns with the OB zone.
Target Hit at OB / Liquidity Zone:
The projected target zone is around 0.79700–0.79750, just beneath the resistance.
This area holds liquidity above recent swing highs, making it attractive for a liquidity sweep or partial mitigation of the OB.
This is also where trapped sellers’ stop-losses might be sitting — a common smart money target.
Exit / Reversal Likely After Target:
Once price hits the OB / Target zone, it may:
Reverse (if this was just a retracement in a larger bearish trend), or
Consolidate before making a decision (continuation vs rejection).
Why It Can Reach the Target from Here:
Price has already shown a bullish reaction from the demand zone.
The structure has shifted bullish (BOS + HL forming).
There's clear inefficiency above — price often seeks to fill that imbalance.
Liquidity pool above the recent highs is a magnet for price.
In Short:
From the current level (0.79579), price is expected to:
Either dip briefly into the support (~0.79500–0.79530) or push directly,
Gain bullish momentum,
Break above short-term highs,
Tap into the target zone (~0.79700–0.79750), completing the planned move.
Longsetup

Long Opportunity From Bullish OrderBlockMarket Structure:
Recent Break of Structure (BOS) confirms bearish intent.
Change of Character (CHoCH) signals a possible shift in trend to the upside.
Price retraced into premium levels near resistance (supply zone), forming a weak high.
Order Block (OB) Zone:
Marked in red — this is a potential bullish order block (demand zone) where institutions may step in.
Entry anticipated near 1.34277, within the OB for a potential long trade.
Trade Setup:
Entry: Around 1.34277 (within OB)
Stop Loss: Just below OB, near 1.34108 (strong low)
Target: Previous resistance zone near 1.34585 — aiming to break the weak high
Bias: Bullish (Long Setup)
Expecting price to mitigate the OB and push up toward the weak high.
This setup follows Smart Money Principles: Liquidity grab + OB mitigation + BOS confirmation.
Watch For:
Clean reaction from the OB.
Break of weak high will validate continuation.
Avoid early entries; wait for confirmation or bullish PA in OB zone.

BRX Stock Going UP, Bullish Momentum ConfirmedHello,
Ayrfolio trade ideas are based on weekly charts and momentum, so remember to be patient! No day trades here unless the stock soars up intraday. Today we’re covering:
COMPANY: Brixmor Property Group, Inc.
STOCK SYMBOL: BRX
POSITION: Long
TP1 Risk-Reward Ratio: 1.54
TP2 Risk-Reward Ratio: 3.09
Stop Loss: must wait AFTER daily candle closes to exit trade (regular candle, NOT Heiken Ashi)
Ultimate Stop Loss: can exit IMMEDIATELY if price reaches this level during any trading hours
EXPLANATION: Weekly momentum increased and confirmed on Tuesday 9/2/25 at $28.20/share. Although the stop losses are listed on the chart, if momentum has been lost then we can exit before the price reaches the stop loss.
DISCLAIMER: Please do your own due diligence before making any decisions. I am not an investment advisor, and I do not personally trade these stocks. These posts are stock trade ideas that follow my same weekly momentum strategy. Past results are not indicative of future performance.
P.S. - Stocks can soar. YOU can soar. Soaring is possible!
-Ayrfolio

BROS RALLY IMMINENTIncreasingly 'high likelihood' of return opportunity is upon us. BROS is very oversold and prime for a bounce, fundamentally it's prime for a run back to all time highs, but let us take baby steps here and first target a relief rally before a larger run.
Short interest has been high for this stock for the month of September.
The rally may not come at the next market open, and it may even move EVEN lower first, but this rally will be fast and strong. Institutions are still buying by the millions, consumer spending is coming in better than expected, and BROS continues to be a disruptor in their market.
Always manage your risk... good luck all!

SUI — Critical $3 ZoneSince completing its 5-wave impulse on July 28, SUI has been in a corrective phase for the past two months. The structure remains clean, with invalidation zones well-defined.
Looking ahead, there’s potential for an ascending triangle formation but for that to play out, it’s crucial that SUI holds the $3 psychological level.
Support Zone ($3.11–$2.93)
0.618 Fib retracement: $3.115
0.702 Fib retracement: $2.934
60 Weekly EMA $2.93 / SMA $3.036
Potential ascending triangle lower support line
📌 This is the last key support zone for bullish momentum. Losing it would break structure, holding it keeps the bullish case alive.
Resistance Zone ($4.12–$4.59)
Yearly Open (yOpen): $4.122 → key level bulls must reclaim
Swing Highs: $4–$4.5
0.786 Fib retracement: $4.59
15B Market Cap: $4.2
This area is loaded with resistance confluence and will act as the major target zone for longs.
🟢 Long Setup
Entry Zone: Between current price and $2.9 → ladder down into support
Stop-Loss: Below 0.702 Fib retracement
Take Profits: TP1 → $3.49, TP2 → $3.89, TP3 → $4.12 (yOpen)
R:R: ~1:4+
Potential Gain: +35%
This is a make-or-break zone for SUI. The $3 level is stacked with support confluences and must hold to keep the bullish structure intact. If bulls reclaim the yearly open at $4.122, momentum could carry toward $4.6.
🔍 Indicators used
DriftLine — Pivot Open Zones → For identifying key yearly/monthly/weekly/daily opens that act as major S/R reference points
Multi Timeframe 8x MA Support Resistance Zones → to identify support and resistance zones such as the weekly 60 EMA/SMA.
Fair Value Trend Model → Calculates a regression-based fair value curve
➡️ Available for free. You can find it on my profile under “Scripts” and apply it directly to your charts for extra confluence when planning your trades.
_________________________________
💬 If you found this helpful, drop a like and comment!

USOIL: Waiting for resistance rejection & buying at support zonePlease refer to my previous higher-timeframe analyses to better follow my current outlook on USOIL.
* Trend: assessed using at least three trend indicators, with market structure as the primary guide.
** Weak or Reversal Signals: Assessed based on one of our criteria for trend reversal signals.
*** Support/Resistance: Selected from multiple factors – static (Swing High, Swing Low, etc.), dynamic (EMA, MA, etc.), psychological (Fibonacci, RSI, etc.) – and determined based on the trader’s discretion.
**** Our advice takes into account all factors, including both fundamental and technical analysis. It is not intended as a profit target. We hope it can serve as a reference to help you trade more effectively. This advice is for informational purposes only and we assume no responsibility for any trading results based on it.
Please like and comment below to support our traders. Your reactions will motivate us to do more analysis in the future 🙏✨
Bulls continue to increase prices, creating new ATH⭐️GOLDEN INFORMATION:
With little on the US calendar, Fed officials dominated headlines on Monday. St. Louis Fed President Alberto Musalem repeated his hawkish stance, warning that inflation expectations remain elevated despite rising risks of labor market weakness. New York Fed President John Williams noted that policy is restrictive enough to pressure inflation lower, while the labor market shows gradual signs of softening. Meanwhile, Cleveland Fed President Beth Hammack stressed that inflation is still too high and blamed tariffs for stalling the disinflation process.
⭐️Personal comments NOVA:
Markets are positive, rising after expectations of a rate cut in October increased.
⭐️SET UP GOLD PRICE:
🔥SELL GOLD zone: 3900- 3902 SL 3907
TP1: $3890
TP2: $3880
TP3: $3870
🔥BUY GOLD zone: $3819-$3817 SL $3812
TP1: $3828
TP2: $3840
TP3: $3850
⭐️Technical analysis:
Based on technical indicators EMA 34, EMA89 and support resistance areas to set up a reasonable BUY order.
⭐️NOTE:
Note: Nova wishes traders to manage their capital well
- take the number of lots that match your capital
- Takeprofit equal to 4-6% of capital account
- Stoplose equal to 2-3% of capital account
Gold price increase - towards 3825⭐️GOLDEN INFORMATION:
Gold (XAU/USD) hovers near $3,800 in Monday’s Asian session, supported by in-line US inflation data that reinforced expectations of further Fed rate cuts this year. Geopolitical uncertainty also underpins safe-haven demand, though upcoming remarks from several Fed officials could sway the Dollar and limit gains for bullion.
⭐️Personal comments NOVA:
continue to rise - above 3790 and hit 3825 resistance today
⭐️SET UP GOLD PRICE:
🔥SELL GOLD zone: 3825- 3827 SL 3832
TP1: $3817
TP2: $3808
TP3: $3792
🔥BUY GOLD zone: $3759-$3757 SL $3752
TP1: $3770
TP2: $3780
TP3: $3790
⭐️Technical analysis:
Based on technical indicators EMA 34, EMA89 and support resistance areas to set up a reasonable BUY order.
⭐️NOTE:
Note: Nova wishes traders to manage their capital well
- take the number of lots that match your capital
- Takeprofit equal to 4-6% of capital account
- Stoplose equal to 2-3% of capital account

#BTCUSDT.P (15m Chart)#BTCUSDT.P
(15m Chart)
🔹️ Bitcoin Futures Analysis 🔹️
✅ Entry Zone: 109,800 – 109,500
❌ Stop Loss: 108,000
🎯 Targets:
🔰 Target 1: 111,000
🔰 Target 2: 111,800
🔰 Target 3: 112,400
🔰 Target 4: 113,600
🔰 Target 5: 114,500
📌 Based on the current conditions of Bitcoin and USDT dominance, I expect a bullish move in the market this week.
📍 This is the setup I expect to play out for Bitcoin.
⚠️ Important Notes:
Keep leverage below 10.
Follow risk management strictly.
Do not place pending orders. I’m monitoring the market myself, and if the entry zone is reached and conditions look good, I’ll announce the entry.
🆔 @Rasoolahmadi

Gold price accumulates around ATH 3790✍️ NOVA hello everyone, Let's comment on gold price next week from 09/29/2025 - 10/03/2025
⭐️GOLDEN INFORMATION:
Gold climbs as PCE data reinforces Fed easing bets, with the core index holding below 3%. Market sentiment stays upbeat despite weaker Michigan Consumer Sentiment, as inflation expectations point to gradually easing price pressures and lingering concerns over the labor market.
⭐️Personal comments NOVA:
The bulls continue to try to break through ATH and increase the price. The momentum of interest rate reduction in the next rounds in 2025
🔥 Technically:
Based on the resistance and support areas of the gold price according to the H4 frame, NOVA identifies the important key areas as follows:
Resistance: $3812, $3832
Support: $3727, $3697
🔥 NOTE:
Note: Nova wishes traders to manage their capital well
- take the number of lots that match your capital
- Takeprofit equal to 4-6% of capital account
- Stoplose equal to 2-3% of capital account
- The winner is the one who sticks with the market the longest

#ADAUSDT (4H Chart)#ADAUSDT
(4H Chart)
🔹️ Cardano Short-Term Analysis 🔹️
🟡 The current price is holding above the yellow support box, and from this area, we expect growth.
🔴 Target is the red box in the 0.88 – 0.90 USD range.
🟢 After touching the red box, a correction toward the green box is expected.
🔰 The green box is the best support for Cardano and a strong level for spot buying.
🚀 After touching the green box, the final target for Cardano will be a new high around 4 USD.
📌 Summary: Bullish Scenario ✅
Move towards the red box, correction to the green box, and then a rally toward a new all-time high.
🆔 @Rasoolahmadi

LONG ON BITCON BTC/USDBitcoin has started its (New Downtrend) after it completed a change of character on the Daily on Aug 25th.
I am looking to catch the pullback to the next key level of supply before turning around and selling bitcoin to the next swing low.
On this buy trade I will be looking to make 5000 points.

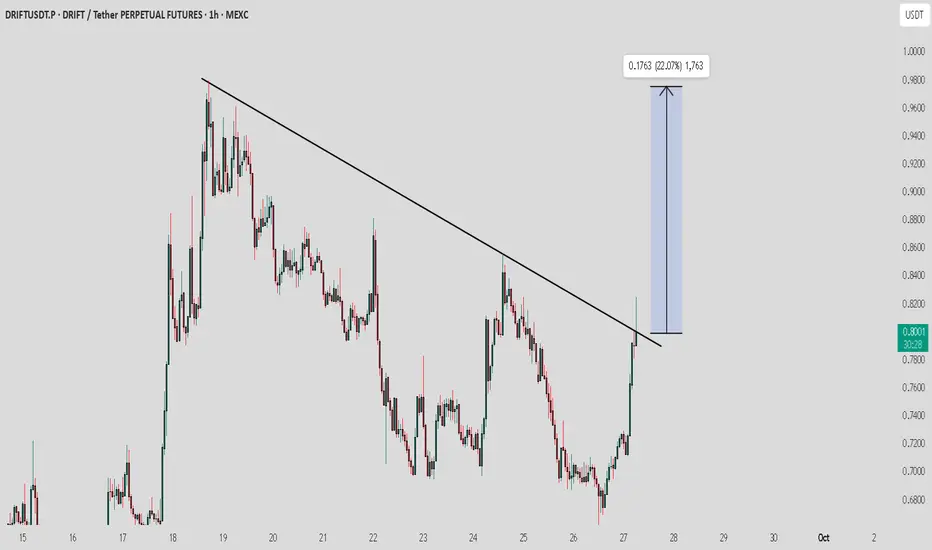
DRIFT / USDT : Trying to breakout with potentialDRIFT / USDT is breaking out from trend line resistance with strong potential. If momentum holds, we could see a sharp short-term rally of 20–30%.
Always manage risk properly and wait for confirmation of the bullish move.
NEAR — Prime Swing Setup at $2.5NEAR is shaping up for a high-probability swing trade, and the chart is lining up beautifully. The $2.5 zone is packed with confluence, making it one of the most attractive long opportunities on NEAR in a while.
Confluence Support Zone
Previous Monthly Open (Key Level): $2.535
0.786 Fib Retracement: $2.506
Liquidity Pocket: Sitting right at this zone
📌 Together, these factors make the $2.53–$2.50 area a critical support level to watch.
🟢 Long Setup
Entry: $2.53–$2.50 zone
Stop-Loss: Below monthly open at $2.366
Target: $4 (major resistance + TP zone)
Potential Gain: ~+50% if played to target
R:R 1:7+
Trade Outlook
If NEAR reacts strongly off the $2.5 zone, this setup could unfold into a powerful swing trade. The structure suggests this could be the launchpad for the next leg higher.
As always, confirmation is key: I’ll be watching closely for a clean reaction before committing fully. Profit-taking decisions will be refined as price action develops, but the $4 level stands out as the main TP zone.
Indicators used
DriftLine — Pivot Open Zones → For identifying key yearly/monthly/weekly/daily opens that act as major S/R reference points
➡️ Available for free. You can find it on my profile under “Scripts” and apply it directly to your charts for extra confluence when planning your trades.
_________________________________
💬 If you found this helpful, drop a like and comment!

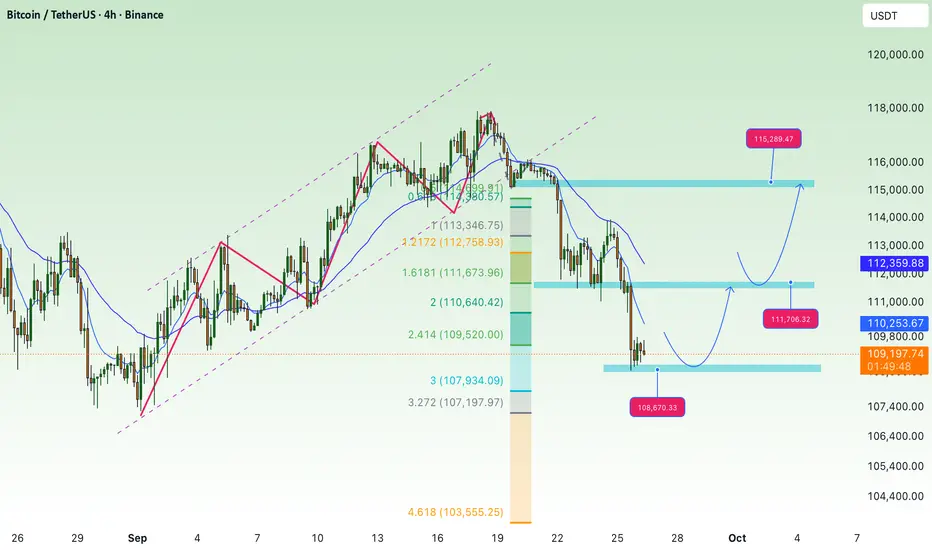
waiting for BTC to recover, accumulate above 107KBTC Technical Analysis (4H Chart):
After breaking down from the rising channel, BTC has confirmed a bearish structure, forming lower highs and lower lows.
Price recently bounced from the 108,800–109,000 support zone, which aligns with the 2.618 Fibonacci extension. This is a key short-term support area to watch.
If buyers can hold this support, BTC may retest the 111,600–111,700 resistance zone. A breakout above could open the path toward the higher resistance at 115,300–115,400.
On the downside, if the 109,000 zone fails, the next bearish targets lie at 105,900 and deeper Fibonacci projections around 104,200–103,100.
Trend Outlook:
Short-term: Possible recovery toward 111,600 or even 115,300 if demand holds above 109,000.
Medium-term: Still bearish-biased as long as price stays under the 200 EMA (~114,000).
Key Levels to Note:
Resistance: 111,600 – 111,700, 115,300 – 115,400
Support: 109,000, 105,900, 104,200 – 103,100
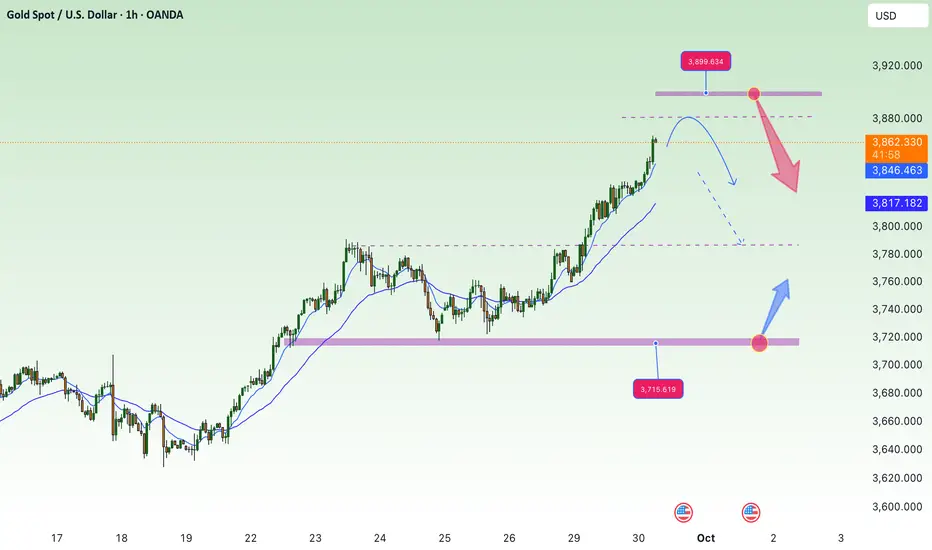
PCE Core Drops, Is XAUUSD Ready to Explode?Hello traders!
Today, I'll share with you a detailed analysis of XAUUSD, combining important economic news and the current market trend .
The US core PCE index for this month is forecasted at 0.2%, lower than the previous 0.3%, indicating a decrease in inflation. This could lead the Fed to maintain low interest rates , which is favorable for gold. When interest rates are low, holding gold becomes cheaper, thus boosting demand and driving gold prices higher .
The XAUUSD chart shows a strong upward trend within the price channel. Gold is trading in an ascending channel , with support at 3,715.000 and a target at 3,800.000 . If support holds, the price of gold may continue to rise to higher levels.
With support from both fundamental and technical factors , the upward trend of XAUUSD is currently very strong. Wishing you successful trades and always finding great opportunities!

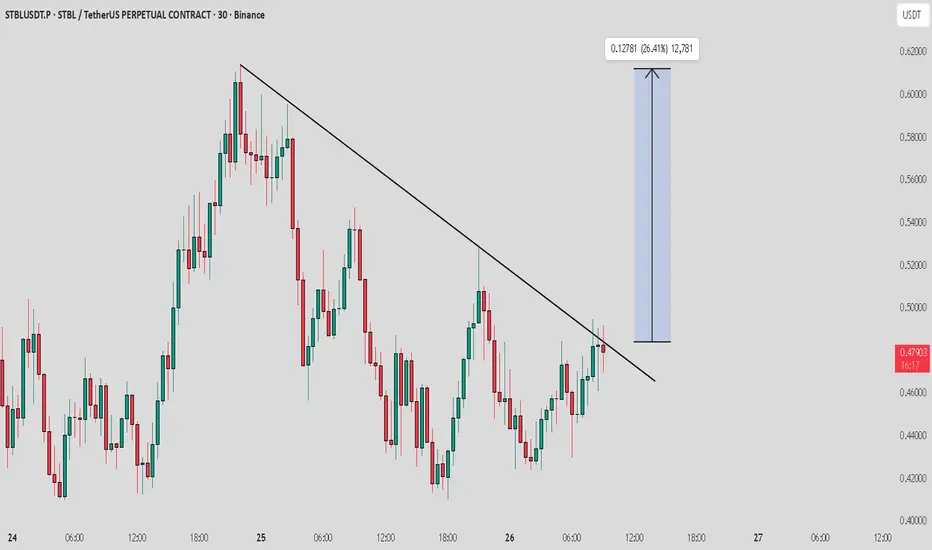
STBL / USDT : Short term rally expected if breakout doneSTBL / USDT is attempting to break out from trend line resistance. Keep it on your watchlist—if the breakout confirms, we can expect a strong short-term rally.
Always wait for confirmation before entering and manage risk properly.
DOGEUSDT Slightly Up, Targeting New HighsIn recent days, DOGEUSDT has seen a slight increase, recovering after hitting its lowest point in several weeks. The growth of DOGE is mainly driven by buying activity at lower levels and improved market sentiment, although the USD remains strong due to positive economic data from the US.
The DOGEUSDT chart is currently trading within a clear upward price channel . The price has found strong support at 0.1950 and is showing signs of recovery. If DOGE can continue to break through the resistance at 0.2730, there is a high likelihood of reaching the target of 0.2730 or higher in the short term.
DOGEUSDT has the potential to continue rising due to the current recovery and strong technical support. Keep an eye on market confirmation to capitalize on trading opportunities.

EUR/USD Slightly Up, Waiting for PCE to Determine the TrendHello traders, today, EUR/USD has seen a slight recovery, rising to 1.1682 after hitting a three-week low. This recovery is largely driven by buying activity at lower levels, although the USD remains strong due to positive economic data from the US. However, the next trend for this pair will depend heavily on the PCE data from the US on September 27.
Technically, EUR/USD is trading within a price channel. After finding strong support at 1.1640, the price has recovered and is now facing important resistance at 1.1743. If the price can break through this level, the opportunity for EUR/USD to continue moving upward will be significant, with the next target at 1.1743 and potentially 1.1800.
Keep a close watch on the PCE data from the US to seize trading opportunities in the coming days. Thanks for listening, traders!

GBP/JPY - Short-Term Bearish TrendHello traders, according to the September PMI data from the UK, there has been a decline in both the manufacturing and services sectors, raising concerns about economic growth. This could lead the BoE to maintain high interest rates, negatively impacting GBP and creating expectations for a short-term decline in the GBP.
Looking at the GBP/JPY chart, we can see that the pair is trading within an upward channel, but there are signs of a potential correction. A key level to watch is 200.300, where a price rejection could occur, followed by a return to a strong support level at 198.500. If the price fails to hold above 200.300 and continues to correct, the pair may test the 198.500 support level.
With the negative impact from the PMI data and the possibility of high interest rates from the BoE, GBP/JPY could move down towards the 198.500 area in the short term.
The short-term bearish trend is likely, but it's essential to closely monitor the upcoming factors to confirm the trend.

DOT — Key Levels Reclaimed, Breakout Ahead?DOT has been in sideways chop for 222 days, but things are finally getting interesting. Price is now sitting above the yearly level ($4.309), the daily 233 EMA/SMA, and the weekly 21 EMA/SMA. Even better, it reclaimed the POC of the entire 222-day range.
Why $4 Is So Important
Yearly level → $4.309
Daily 233 EMA → $4.37 / Daily 233 SMA → $4.21
Weekly 21 EMA → $4.15 / Weekly 21 SMA → $4.05
POC of 222-day range → $4
0.618 Fib retracement (current move) → $4
That’s a whole lot of support stacked at one zone.
Where It Gets Exciting (Targets)
First major target is the monthly 21 EMA/SMA ($5.3–$5.5), which also lines up with the range highs. That’s the first real test. The swing target zone sits around $6–$6.5, with multiple layers of confluence:
Key Level → ~$6
Fair Value Trend Model Line → ~$6.5
0.382 Fib retracement of the downtrend → ~$6.19
0.618 Fib speed fan → ~$6.2 (October projection)
1.618 trend-based Fib extension → $6.308
Market Cap Confluence: 10B market cap at $6.18
Yearly Open: $6.642 → the overall target and an additional layer of resistance
📌 This creates a solid resistance cluster between $6–$6.6, ideal for taking profits and potentially looking for shorts.
🟢 Long Trade Idea
Entry: Ladder longs from $4.36 down to $4
Stop: Below $4 (clear invalidation)
Take Profit: If $4 holds, DOT’s path is clear: first stop $5.3-$5.5, then $6.0–$6.6 as the macro target with the yearly open at $6.642 marking the final resistance.
Key Levels
Support → $4.36–$4
Resistance → $5.3–$5.5, then $6.2–$6.6 (10B market cap $6.18 + yearly open $6.642)
🔍 Indicators used
LuxAlgo — Liquidity Sentiment Profile (Auto-Anchored)
DriftLine — Pivot Open Zones → For identifying key yearly/monthly/weekly/daily opens that act as major S/R reference points
Multi Timeframe 8x MA Support Resistance Zones → to identify support and resistance zones such as the monthly 21 EMA/SMA.
Fair Value Trend Model → Calculates a regression-based fair value curve
➡️ Available for free. You can find it on my profile under “Scripts” and apply it directly to your charts for extra confluence when planning your trades.
_________________________________
💬 If you found this helpful, drop a like and comment!
WAFD Stock Going UP, Bullish Momentum ConfirmedHello,
Ayrfolio trade ideas are based on weekly charts and momentum, so remember to be patient! No day trades here unless the stock soars up intraday. Today we’re covering:
COMPANY: WaFd, Inc.
STOCK SYMBOL: WAFD
POSITION: Long
TP1 Risk-Reward Ratio: 1.79
TP2 Risk-Reward Ratio: 3.59
Stop Loss: must wait AFTER daily candle closes to exit trade (regular candle, NOT Heiken Ashi)
Ultimate Stop Loss: can exit IMMEDIATELY if price reaches this level during any trading hours
EXPLANATION: Weekly momentum increased and confirmed on Monday 8/18/25 at $31.73/share. Although the stop losses are listed on the chart, if momentum has been lost then we can exit before the price reaches the stop loss.
DISCLAIMER: Please do your own due diligence before making any decisions. I am not an investment advisor, and I do not personally trade these stocks. These posts are stock trade ideas that follow my same weekly momentum strategy. Past results are not indicative of future performance.
P.S. - Stocks can soar. YOU can soar. Soaring is possible!
-Ayrfolio

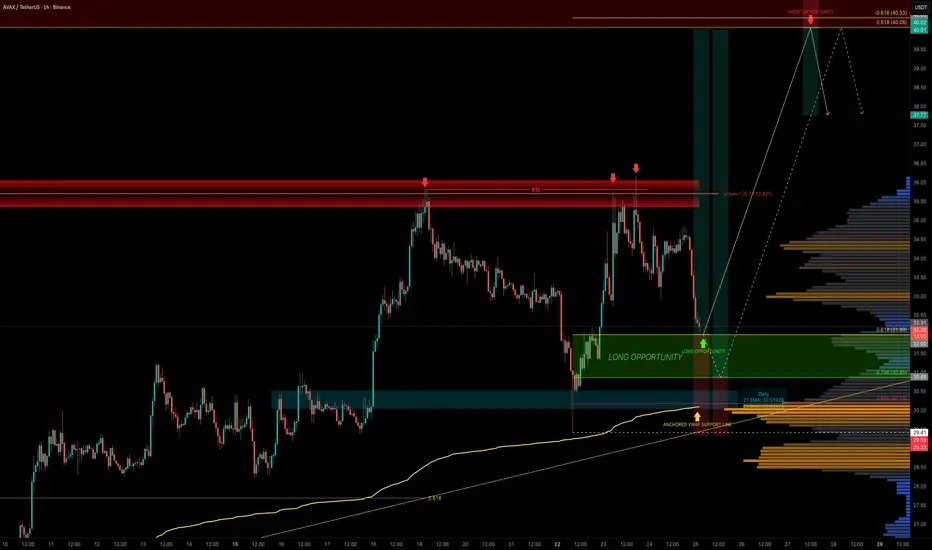
AVAX — Next Stop $40?AVAX has been one of the stronger high-cap performers recently, but the yearly open at $36 has proven to be a tough ceiling. Price has rejected this level three times already, each time offering short opportunities. This level also aligns with the 15B market cap, making it a key resistance zone.
Now, AVAX is retracing into a prime area for long setups, retracing part of the recent 5-wave impulse.
🟢 Long Entry Zone
0.618 Fib retracement: $32 → first bounce zone
0.786 Fib retracement: $30.85 → deeper entry opportunity
0.886 Fib retracement: $30 → highest confluence long entry
Invalidation: Below $29.41 (origin of the impulse)
Confluence at $30
The $30 level is the strongest support cluster, backed by multiple technical factors:
POC of this trading range
0.886 Fib retracement of the impulse
21 EMA/SMA (daily timeframe)
Anchored VWAP support
$30 psychological round number
0.618 Fib speed fan support
This makes laddering entries from $32 down to $30 the most optimal approach.
Targets
First Target: $36 yearly open → retest of major resistance (fourth attempt)
Main Target: $40 resistance cluster → 0.618 Fib retracement, negative -0.618 Fib extension
R:R: 1:3 up to 1:6 depending on entry
Educational Insight
When analysing trades, confluence is king. A single indicator may provide a signal, but when multiple tools align at the same level the probability of that zone holding increases significantly.
The $30 zone for AVAX is a great example of confluence stacking. This doesn’t guarantee success, but it gives traders a defined edge with a clear invalidation point. The same logic applies to resistance: at $40, multiple technical layers align, making it a high-probability take-profit zone.
Quick Take
AVAX is pulling back into a stacked support zone. With solid confluence at $30–$32, this zone sets up the fourth attempt at breaking the $36 yearly open resistance.
And as the saying goes in trading: the 4th touch often breaks. If it does, AVAX could quickly rally toward the $40 resistance cluster, where multiple confluences align.
Indicators used
DriftLine — Pivot Open Zones → For identifying key yearly/monthly/weekly/daily opens that act as major S/R reference points
Multi Timeframe 8x MA Support Resistance Zones → to identify support and resistance zones such as the Daily 21 EMA/SMA.
LuxAlgo — Liquidity Sentiment Profile (Auto-Anchored)
➡️ Available for free. You can find it on my profile under “Scripts” and apply it directly to your charts for extra confluence when planning your trades.
_________________________________
💬 If you found this helpful, drop a like and comment!