AVAX — 220-Day Range Broken, Next Stop $35?After 220 days of consolidation, AVAX has finally broken out of its trading range. The key resistance at $27 was cleared, and price quickly pushed into the $30 psychological level, where it faced rejection. Currently, AVAX is consolidating just below, around $29.
So, what’s next? Now all eyes are on the retest to confirm $27 as the new launchpad.
Support Confluence (Long Entry Zone)
3M/Quarterly level: $27.71 → major support
0.382 Fib retracement: $27.65 (low $23.87 → $30)
0.5 Fib retracement: $26.93 → perfectly aligned with $27 zone
Swing High: $27.38 → could be retested
4H 21 EMA: $27.71
4H 21 SMA: $27.41
Weekly VWAP: $27.41
Fair Value Gap (FVG): imbalances in this zone
📌 With all these layers of confluence, the $27.7–$27.4 zone is the ideal long entry area.
Resistance Confluence (Take Profit Zone)
0.5 Fib retracement of the entire downtrend: $35.22
15B Market Cap resistance: $35.5
Yearly Open: $35.7 → major target
3M/Quarterly level: $35.71
TPO resistance cluster: $35.22–$37.28
📌 Together, these levels form a stacked resistance zone at $35–$37, making it both the ideal take-profit area and a potential short setup.
Zoomed-Out View:
TPO Chart Reference:
🟢 Long Trade Setup
Entry Zone: $28.0 → $27.4 (DCA best approach)
Stop-Loss: Below $26 (to be adjusted after reversal confirmation)
Take Profit: $35
Potential Gain: +25%
R:R: 1:4+
Technical Insight
After 220 days of sideways compression, the breakout above $27 marks a shift in market structure.
A retest of this level would validate it as new support and provide a high-probability swing long setup.
The $35–$37 zone, reinforced by the yearly open at $35.7, stands out as the major resistance cluster, making it both the ideal profit target and a potential reversal area.
Key Levels to Watch
Support Zone: $28–$27
Resistance Zone: $35–$37
🔍 Indicators used
DriftLine — Pivot Open Zones → For identifying key yearly/monthly/weekly/daily opens that act as major S/R reference points
Multi Timeframe 8x MA Support Resistance Zones → to identify support and resistance zones such as the 4H 21 EMA/SMA.
➡️ Available for free. You can find it on my profile under “Scripts” and apply it directly to your charts for extra confluence when planning your trades.
_________________________________
💬 If you found this helpful, drop a like and comment!
Longsetup

Hype's path to $55BYBIT:HYPEUSDT.P is currently forming a wedge shape pattern, is it indicating that it will break out and follow Path A, the blue path? I'm not so sure, I am sure we'll hit $55 either way.
If we take the red path, Path B, we'll come down to some heaviy support which could give us the fuel needed to get to $55
Out of all of the oscillators I was using, all except the chop zone on the daily mind you, were in bearish mode. So logically one would choose the red Path B right?
I can't wait to see how this plays out, shall we dip some and buy some more BYBIT:HYPEUSDT.P on Path B or experience more of a continuation of the current trendline to $55?
Let me know what you think in the comments, that'ls all for today, let's go HYPE!!! straight to $55!

continued price increase, buying power GOLD⭐️GOLDEN INFORMATION:
Gold (XAU/USD) holds modest gains near $3,685 in early Asian trading on Monday, supported by the Fed’s 25 bps rate cut at its September meeting—the first of 2025. The move, driven by a cooling labor market and rising employment risks despite sticky inflation, lowers the opportunity cost of holding bullion. Traders now await fresh cues from Fed officials later in the day.
⭐️Personal comments NOVA:
Gold price continues to increase after short-term correction, approaching ATH 3700 price zone
⭐️SET UP GOLD PRICE:
🔥SELL GOLD zone: 3717- 3719 SL 3724
TP1: $3710
TP2: $3700
TP3: $3690
🔥BUY GOLD zone: $3658-$3660 SL $3653
TP1: $3670
TP2: $3680
TP3: $3690
⭐️Technical analysis:
Based on technical indicators EMA 34, EMA89 and support resistance areas to set up a reasonable BUY order.
⭐️NOTE:
Note: Nova wishes traders to manage their capital well
- take the number of lots that match your capital
- Takeprofit equal to 4-6% of capital account
- Stoplose equal to 2-3% of capital account

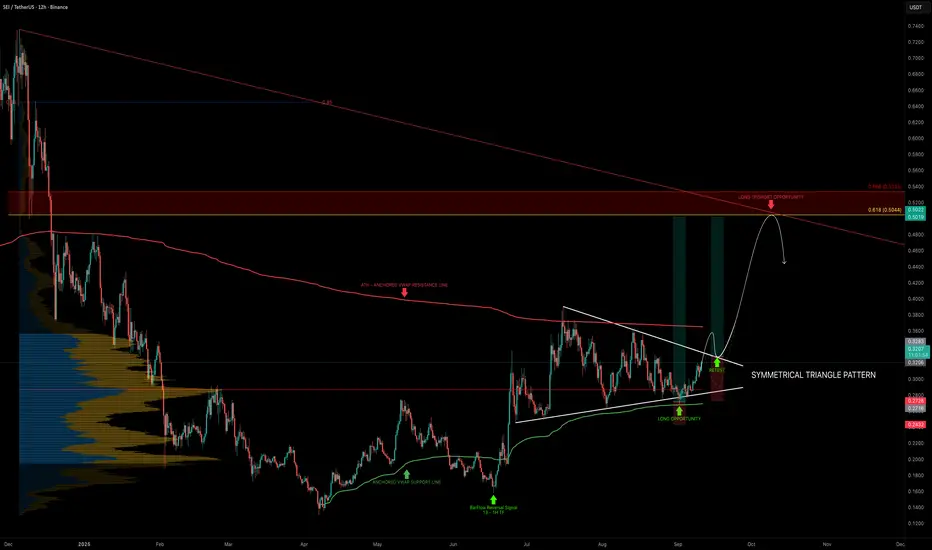
SEI — Triangle Pattern Breakout Ahead?SEI has been consolidating in a symmetrical triangle for the past 78 days, now reaching the apex, signaling that a big move is coming soon.
Price has been trading between two anchored VWAPs:
From the $0.13 low → acting as support (currently ~$0.27)
From the ATH → acting as resistance (currently ~$0.365)
The POC of the 280-day trading range sits at $0.287, a key pivot level to watch.
Support Confluence
Anchored VWAP (from $0.13 low): ~$0.27 (long entry zone already tested)
POC (280-day range): $0.287 → key stop-loss reference
Symmetrical triangle breakout retest: ~$0.33 → potential re-entry after breakout
Fib Speed Resistance Fan 0.618: ~$0.27 → reinforcing support at the anchored VWAP
Resistance Confluence
0.618 Fib retracement: $0.5044 → aligns with $0.5 key level
3B Market Cap resistance: ~$0.505
Fair Value Gap (FVG): sitting around $0.5
Trend-Based Fib Extension 1.0: $0.5 → major target confluence
🟢 Long Trade Setup
Entry Zone: Retest around $0.33 after breakout
Stop-Loss: Below $0.287 (POC), to be adjusted after seeing a clear reversal sign.
Target (TP): $0.50
Potential Gain: ~+50%
Timeframe: Could take ~1 month to play out
Technical Insight
SEI has been compressing for over two months, and volatility is about to expand.
The ideal entry at $0.27 (anchored VWAP support) has already triggered.
The next opportunity lies in a triangle breakout + retest around $0.33.
The $0.50 level stands out as a high-confluence target, combining Fib levels, market cap, FVG, and extension symmetry.
_________________________________
💬 If you found this helpful, drop a like and comment!
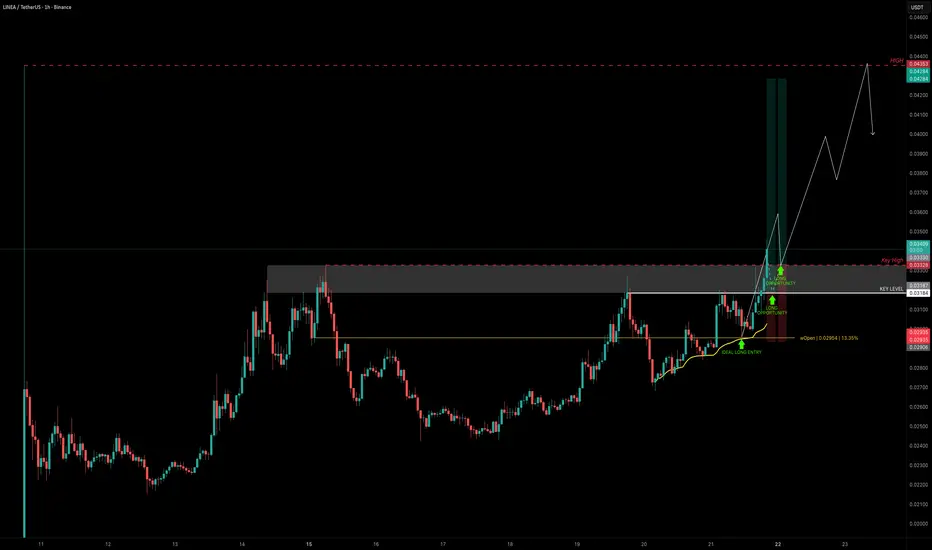
LINEA — $0.033 Key Break Could Unlock Big UpsideLINEA is starting to look interesting. Currently trading around $0.032 (~500M market cap), this level acts as resistance that needs to be broken for bullish continuation.
Earlier today, we already had a clean long setup from $0.03 support, in confluence with the weekly open ($0.02954) and anchored VWAP (yellow line), which held and gave a solid bounce.
Next Long Setup Idea
Entry 1: Watch for a breakout above the key high at $0.03328, then retest for confirmation.
Entry 2: Alternatively, a hold above $0.032 could offer a safer re-entry.
Stop-Loss: Below $0.03 support for now.
Targets
TP1: $0.036
TP2: $0.04
TP3: $0.043
Final Target: $0.065 (aligns with 1B market cap resistance)
This setup could yield:
+30% gain if exited around $0.043
+100% potential if momentum drives price into the $0.065 zone
Quick Take
A breakout and retest of $0.03328 would open the path toward the $0.036–$0.043 zone. If momentum continues, the 1B market cap resistance at $0.065 becomes a realistic macro target.
🔍 Indicators used
DriftLine — Pivot Open Zones → For identifying key yearly/monthly/weekly/daily opens that act as major S/R reference points
➡️ Available for free. You can find it on my profile under “Scripts” and apply it directly to your charts for extra confluence when planning your trades.
_________________________________
💬 If you found this helpful, drop a like and comment!
AEVO — 230 Days of Accumulation, Breakout AheadAEVO has been consolidating for the past 230 days in what looks like a Wyckoff accumulation between the 100M–150M market cap range. AEVO is now on the verge of breaking its long-term bear trend.
🟢 Long Setup Idea
Entry Zone: $0.13–$0.12
Stop-Loss: Below $0.11
Target: ~$0.35
Key Resistance Levels
Yearly Dynamic VWAP → $0.1384 → current resistance / key S/R zone
Anchored VWAP (Dec 7, 2024 high at $0.6549) → ~$0.17 → key resistance in confluence with the key highs → A clean break above this = bullish
150M Market Cap → $0.164 → major breakout level
Once cleared, significant upside potential opens up.
Higher Timeframe Targets
$0.35 Zone → Primary long target (POC of the 2024 trading range, yearly Open at $0.3614, 0.5 Fib retracement of the downtrend at $0.359)
$0.43 Zone → 0.618 Fib retracement of the downtrend, in confluence with the 400M market cap
$0.50 Zone → Anchored VWAP resistance + psychological level
$0.53 Zone → 0.786 Fib retracement
$0.55 Zone → 500M market cap resistance
Key Levels
Support → $0.12–$0.13
Resistance → $0.1606–$0.17 → $0.35 → $0.43–$0.55
🔍 Indicators used
DriftLine — Pivot Open Zones → For identifying key yearly/monthly/weekly/daily opens that act as major S/R reference points
➡️ Available for free. You can find it on my profile under “Scripts” and apply it directly to your charts for extra confluence when planning your trades.
_________________________________
💬 If you found this helpful, drop a like and comment!

USD/JPY: Is the Bear Coming Back?Hello traders, USD/JPY is still under the influence of the latest news from the BOJ . The Bank of Japan kept interest rates at 0.5% but started selling ETFs and REITs, showing they are gradually moving away from their ultra-loose policy. This is a hawkish signal that supports the yen. In addition, 2 out of 9 BOJ board members even wanted to raise rates to 0.75% , increasing market expectations that the JPY will become even stronger in the near future. Meanwhile, the Fed is in a rate-cutting cycle , leaving the USD weaker against the JPY.
From a technical perspective, USD/JPY has just touched the resistance area around 148.200 and bounced down. The downtrend line continues to act as pressure. The market structure is also forming lower highs, reinforcing the bearish outlook. The 148.200 level is a strong supply zone, difficult to break without unexpected news.
The preferred scenario is to look for sell entries around the resistance zone , with a near-term target at 147.000 and a further target at 146.000 – a key support level overlapping with the demand zone. A stop-loss should be placed above 148.500 to avoid false breakouts.
Overall, both fundamentals and technicals support a bearish move for USD/JPY . The dominant trend is bearish, and the effective strategy is to wait for pullbacks to sell with the trend.

WLFI / USDT : Attempting breakout from horizontal resistanceWLFI/USDT is attempting to break out from horizontal resistance. If the breakout is confirmed, a short-term bullish rally towards $0.25 – $0.30 can be expected.
Always wait for confirmation before entering and manage risk properly.

Strong uptrend, above ATH 3700 next week ✍️ NOVA hello everyone, Let's comment on gold price next week from 09/22/2025 - 09/26/2025
⭐️GOLDEN INFORMATION:
Gold (XAU/USD) rebounds on Friday, snapping a two-day losing streak and climbing 0.69% to $3,670 during the North American session, despite broad USD strength. Buyers stepped in near weekly lows at $3,630, lifting the metal higher. The move follows the Fed’s 25 bps cut and signals of two more reductions this year, though Powell’s “risk-management cut” remarks were viewed as hawkish. Still, bullion’s outlook remains constructive, supported by a low-rate environment and resilient Asian demand.
⭐️Personal comments NOVA:
Gold prices recovered and continued to maintain a strong upward trend, thanks to optimism about interest rate cuts this year.
🔥 Technically:
Based on the resistance and support areas of the gold price according to the H4 frame, NOVA identifies the important key areas as follows:
Resistance: $3702, $3719, $3745
Support: $3646, $3593
🔥 NOTE:
Note: Nova wishes traders to manage their capital well
- take the number of lots that match your capital
- Takeprofit equal to 4-6% of capital account
- Stoplose equal to 2-3% of capital account
- The winner is the one who sticks with the market the longest

EUR/USD: Mild Uptrend, Awaiting Breakout of ResistanceCurrently, EUR/USD is in a mild uptrend, supported by both macroeconomic and technical factors. Let's analyze the key influences and suitable trading strategies in this article.
With the Fed cutting interest rates and stable economic indicators from the Eurozone, EUR/USD may continue to rise if it breaks through the 1.18300 level, targeting 1.18600. The nearest support is at 1.17400. If the price holds above this support, the uptrend is likely to continue. However, a strong break of support or resistance levels could shift the trend.
Keep a close eye on the upcoming developments and prepare your strategy to capitalize on market opportunities.

XAUUSD: Current Sideway Trend, Breakout Opportunity Ahead?Hello traders, in this analysis, we will examine XAUUSD (gold) in the current context, with a sideway trend that could continue over the next few sessions.
At the moment, the market does not have any significant news impacting it immediately. Gold may continue to move within the range between the support at 3,650 USD and the resistance at 3,700 USD. The stable trading volume indicates a lack of strong momentum. Gold might continue sideway within this range until there is a clear signal from the market.
While the likelihood of a sideway movement in gold is high in the coming days, we must also prepare for a potential breakout if strong signals emerge from macroeconomic events.
Keep a close eye on the developments ahead and always maintain a proper risk management strategy.

DOT / USDT : Momentum building for a strong rallyDOT/USDT is showing strong momentum and looks ready for a rally. If momentum continues to build, the next upside targets are $5 – $6.
Always manage risk and wait for confirmation before entering.

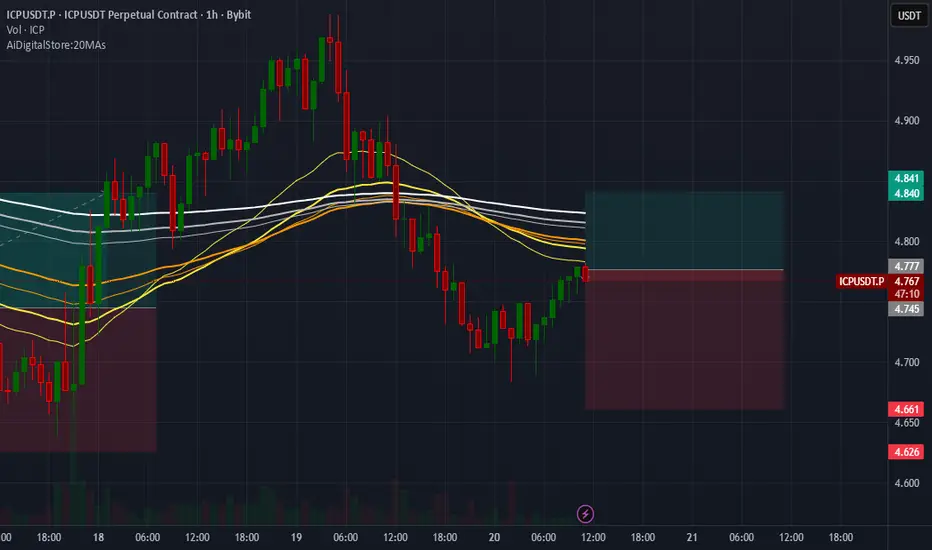
ICPUSDT.P LONGICPUSDT.P LONG
An uptrend of up to 200 MA is possible in the market
Price: 4.777 $
Main target 4.841 $
SL 4.661 $
JOE ANALYSIS📊#JOE Analysis
✅There is a formation of Descending triangle pattern on daily chart🧐
Pattern signals potential bullish movement incoming after a small retest 📉
👀Current Price: $0.1944
🚀 Target Price: $0.2370
⚡️What to do ?
👀Keep an eye on #JOE price action and volume. We can trade according to the chart and make some profits⚡️⚡️
#JOE #Cryptocurrency #TechnicalAnalysis #DYOR

TGKA 5M Long Aggressive CounterTrend DayTradeAggressive CounterTrend Trade
- short impulse
+ biggest volume T1
+ volumed 2Sp+ ?
- T2 level
- resistance level
Calculated affordable virtual stop loss
1 to 2 R/R expandable to swing take profit
1H CounterTrend
"- short impulse
+ biggest volume T1
+ support level
+ volumed interaction bar
- reaction bar went lower"
1D Trend
"+ long impulse
+ biggest volume expanding T2 level
+ support level
+ below 1/2 correction
+ volumed interaction bar"
1Y no context

EURUSD – Upcoming Bearish Trend: Seize the Opportunity!Hello traders! Today, we will analyze EURUSD and make a forecast on the bearish trend ahead, based on the chart and key fundamental factors influencing this pair.
The Fed cut interest rates to 4.25% as expected, but it did not exceed expectations, which means USD has not weakened. This creates downward pressure on EURUSD as USD maintains its strength.
The unemployment claims data came in lower than expected, indicating a strong labor market , which supports USD, further increasing pressure on EURUSD.
The chart shows that EURUSD is in an uptrend channel, but it is now showing signs of reversing when encountering resistance at 1.1880. If the price fails to break this level, EURUSD could drop to 1.1830, and continue to fall to lower levels. Specifically, if the price breaks below 1.1830, the next target will be 1.1750.
With a clear downward trend and supporting market factors, EURUSD could continue to adjust downwards in the near term. Keep an eye on support and resistance levels to take advantage of effective trading

CADJPYLong Calll
D. Bottom Structure Bouncig from support
Bullish .DIV
Manage risk Book profits timely

GBPUSD: Decline from Resistance LevelHello traders! Looking at the chart, we can see that GBPUSD is in an ascending wedge , but it has encountered strong resistance at 1.3650. If it fails to break through this level, the price could reverse and head lower, with a target at 1.3600.
The reason for the decline in GBPUSD is due to the USD strengthening slightly on Thursday after the Federal Reserve cut interest rates . This created upward pressure on USD, leading to a slight decrease in GBPUSD.
At the same time, GBP dropped slightly ahead of the Bank of England's policy meeting , which increased uncertainty and put downward pressure on GBPUSD.
With support from both fundamental and technical factors , can GBPUSD continue its decline? Let us know your thoughts!

Tesla on Track – Golden Zone Respect Leading to $867 TargetAs we discussed in the earlier setup, Tesla retraced beautifully into the golden zone (62–79% retracement area) after sweeping sell-side liquidity. This zone aligned with a higher-timeframe order block, providing strong confluence for a bullish reaction.
The price has since respected that golden zone, confirming buyers stepped in aggressively and validating the bullish bias. From here, the market structure points toward continuation to the upside, with immediate targets at prior buy-side liquidity pools, eventually extending toward the $867 region, a level that aligns with the 100% Fibonacci projection and liquidity resting above previous highs.
This setup illustrates a textbook ICT/SMC play:
Liquidity Sweep ✅
Golden Zone Respect ✅
Strong Bullish Reaction ✅
Clear Buy-side Targets Ahead ✅
If momentum holds, Tesla remains positioned for a multi-month expansion leg toward the $867 target zone.
⚠️ DYOR: Not financial advice. Always confirm setups with your own framework and risk management.

XAUUSD: 3.700 USD Resistance, Strong Decline Ahead?Hello traders, let’s dive into the next short-term trend for XAUUSD!
As you can see on the chart, XAUUSD is currently facing a strong resistance at 3,700 USD . After touching this level, the price of gold has corrected downward and is now testing the support zone at 3,600 USD . If gold fails to hold above 3,600 USD and breaks this level, there is a high likelihood that gold will continue its decline towards deeper support levels at 3,580 USD.
With the forecasted unemployment claims dropping to 241K , the US economy is recovering, which is strengthening the USD. This, in turn, puts downward pressure on gold . A stronger USD makes gold more expensive for investors holding other currencies.
Given the strength of the USD and the technical signals showing potential for a break in support, the downward trend of XAUUSD may continue in the near future.
Can gold maintain above the 3,600 USD support, or will it continue its strong decline to lower levels? Share your thoughts!

BTCUSDT.P LONG#BTCUSDT.P LONG
An uptrend in the market
Price: 117595 $
Main target 119182.0 $
SL 114714.0 $

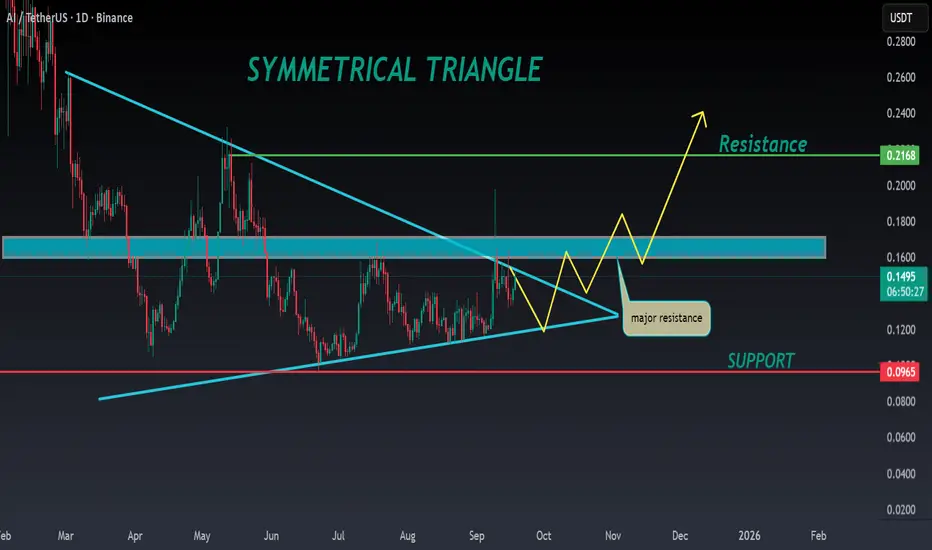
AI ANALYSIS🔮#AI Analysis 💰💰
#AI is trading in a symmetrical triangle in a weekly time frame and if it breakouts with high volume then we can see a bullish momentum in #AI. Before that we will see little bit bearish movement .
🔖 Current Price: $0.1490
⏳ Target Price: $0.2100
⁉️ What to do?
- We can trade according to the chart and make some profits in #AI. Keep your eyes on the chart, observe trading volume and stay accustom to market moves.💲💲
#AI #Cryptocurrency #Pump #DYOR
HTH Stock Bullish Momentum ConfirmedHello,
Ayrfolio trade ideas are based on weekly charts and momentum, so remember to be patient! No day trades here unless the stock soars up intraday. Today we’re covering:
COMPANY: Hilltop Holdings Inc.
STOCK SYMBOL: HTH
POSITION: Long
TP1 Risk-Reward Ratio: 1.34
TP2 Risk-Reward Ratio: 2.68
Stop Loss: must wait AFTER daily candle closes to exit trade (regular candle, NOT Heiken Ashi)
Ultimate Stop Loss: can exit IMMEDIATELY if price reaches this level during any trading hours
EXPLANATION: Weekly momentum increased and confirmed on Monday 8/18/25 at $34.68/share. Although the stop losses are listed on the chart, if momentum has been lost then we can exit before the price reaches the stop loss.
DISCLAIMER: Please do your own due diligence before making any decisions. I am not an investment advisor, and I do not personally trade these stocks. These posts are stock trade ideas that follow my same weekly momentum strategy. Past results are not indicative of future performance.
P.S. - Stocks can soar. YOU can soar. Soaring is possible!
-Ayrfolio
