BTC recovers, maintains long-term growth💎 MIDWEEK BTC PLAN UPDATE (20/08)
BTC Technical Outlook (Daily)
Current Trend:
BTC is in a corrective phase after failing to break above the 120,000 – 120,500 zone. The price has tested the key support area around 112,000 – 113,000, where it converges with the 200 EMA and the 0.5 Fibonacci retracement.
Main Scenario:
If the 112,000 – 113,000 zone holds, BTC is likely to rebound, first targeting 116,000 – 117,500, and then 120,000 – 120,500. This will be a strong resistance area to watch.
Alternative Scenario:
If 112,000 breaks, BTC could drop deeper to the 108,000 – 109,000 zone, and potentially further down to 104,000 (Fibo 0.786).
Key Levels to Watch:
• Resistance: 116,000 – 117,500 and 120,000 – 120,500
• Support: 113,000 – 112,000 and 108,000 – 109,000
Overall Outlook:
BTC is currently at a sensitive level. If the 112k support holds, the bullish trend remains intact, but a deeper break below this zone could extend the downside risk toward 108k and lower.
Longsetup

AZN Stock Going UP, Confirmed Monday 8/11/25Hello,
Ayrfolio trade ideas are based on weekly charts and momentum, so remember to be patient! No day trades here unless the stock soars up intraday. Today we’re covering:
COMPANY: Astrazeneca PLC
STOCK SYMBOL: AZN
POSITION: Long
TP1 Risk-Reward Ratio: 1.67
TP2 Risk-Reward Ratio: 2.0
Stop Loss: must wait AFTER daily candle closes to exit trade (regular candle, NOT Heiken Ashi)
Ultimate Stop Loss: can exit IMMEDIATELY if price reaches this level during any trading hours
EXPLANATION: Weekly momentum increased and confirmed on Monday 8/11/25 at $79.17/share. Although the stop losses are listed on the chart, if momentum has been lost then we can exit before the price reaches the stop loss.
DISCLAIMER: Please do your own due diligence before making any decisions.
P.S. - Stocks can soar. YOU can soar. Soaring is possible!
-Ayrfolio
ALong

Long Trade Idea: EURUSD (Buy Setup)Market Analysis:
• Overall Trend: Bullish, supported by a clean Break of Structure (BOS) confirming upward momentum.
• Clean inducement identified
• Recent Price Action: The last bullish leg failed to clear the previous swing high and associated liquidity.
As a result, I anticipate a temporary downside move to sweep buy-side liquidity below current levels.
This pullback should create an optimal entry point for a long position, aligning with the broader bullish structure.
Trade Expectation:
Price is expected to dip lower to clear stops and liquidity before resuming the uptrend, providing a high-probability buy opportunity. Monitor for confirmation signals such as a reversal pattern or bullish divergence at lower levels.
Risk Disclaimer:
This is not financial advice. Market prices can move unpredictably due to various factors, including economic data releases, central bank speeches, interest rate decisions, geopolitical events, and policy updates. Always trade responsibly—only risk capital you can afford to lose, and employ sound risk management strategies such as stop-loss orders and position sizing.

XAUUSD: Key Support Under ThreatXAUUSD is currently trading in a clear downward channel. After failing to break the strong resistance at 3,375, the price has reversed and is now testing the important support at 3,330. If this support level is broken, the bearish trend is likely to continue towards the next targets at 3,320 and 3,280.
The market structure indicates that selling pressure is dominant, with the price consistently forming lower highs and lower lows. A break of 3,330 will confirm a strong decline, opening up selling opportunities with targets at lower support levels.
Traders should keep an eye on the support at 3,330; if broken, a sell order should be prioritized, with the next targets at 3,320 and 3,280.

EURO Breakout Alert- Long Setup In Play EUR/USD is currently trading around 1.1660, showing strong bullish momentum after holding key support levels. The pair is forming higher lows, indicating sustained buying pressure. If price action maintains above 1.1650, the next upside target is 1.1700, with a potential extension towards 1.1730. Euro strength is driven by positive market sentiment and weakness in the dollar index. Watch for a clean breakout above 1.1675 for confirmation of further upside. Ideal buy entry remains around 1.1660 with stop loss below 1.1640. Short-term trend remains bullish as long as the pair stays above 1.1640.

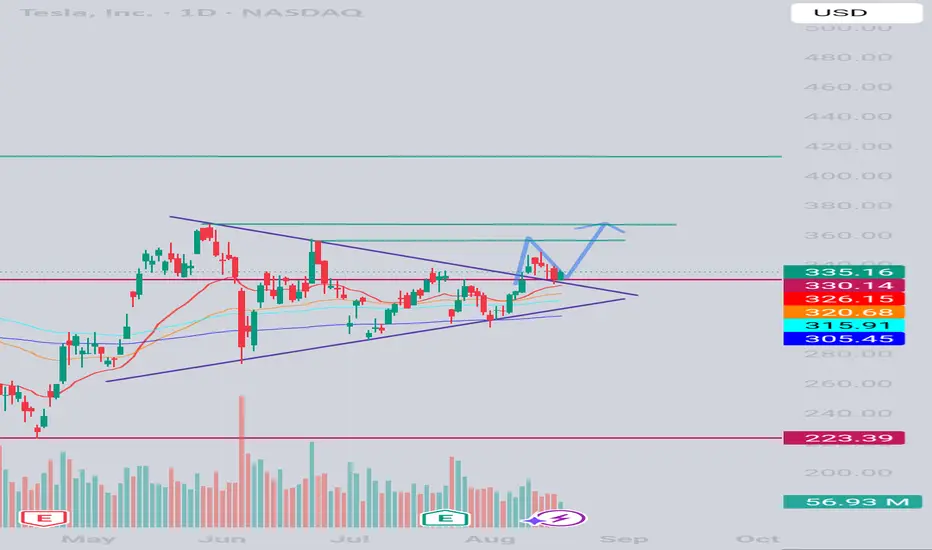
Is it time to hop on the Elon's Robovan and ride the waveNASDAQ:TSLA 's chart has been forming this triangle since mid May, and has finally made up it's mind to head north. On the daily chart you can see the breakout on top and retest of support. Tomorrow I'll be entering swings with 8/22 & 8/29 $350 calls with a PT at 356 for the 8/22 contracts & PT 365 for the 8/29 contract.
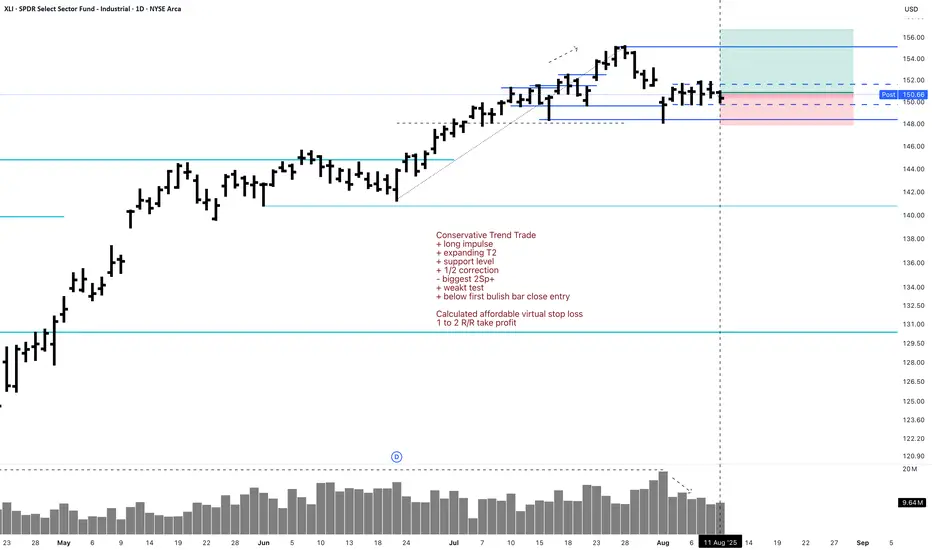
XLI 1D Long Investment Conservative Trend TradeConservative Trend Trade
+ long impulse
+ expanding T2
+ support level
+ 1/2 correction
- biggest 2Sp+
+ weakt test
+ below first bulish bar close entry
Calculated affordable virtual stop loss
1 to 2 R/R take profit
Monthly Trend
"+ long impulse
+ long volume distribution
= neutral zone"
Yearly trend
"+ long impulse
+ neutral zone"
Is GBPUSD Setting up for a Long Swing?Hi Traders!
I've been watching this pair. It seems like it could be setting up for a long swing. I would like to see a retest around 1.34900/800, and how it reacts to that area. That'd hit a Daily Order Block. In addition, the weekly made a break of structure, and dipped into a weekly breaker OB, then pushed up. However, the only thing I don't like is it's at a weekly resistance. But, IMO the monthly looks bullish.
So, over all I'm bullish on this pair and will plan to swing, I just need my confluences to match up fully before taking this trade.
*DISCLAIMER: I am not a financial advisor. The ideas and trades I take on my page are for educational and entertainment purposes only. I'm just showing you guys how I trade. Remember, trading of any kind involves risk. Your investments are solely your responsibility and not mine.*

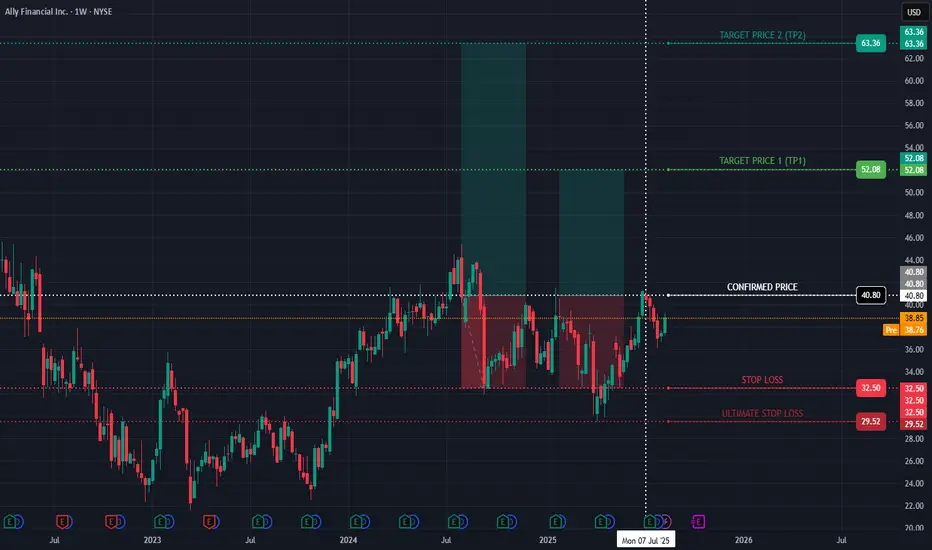
ALLY Stock Going UP, Confirmed Monday 7/7/25Hello,
Ayrfolio trade ideas are based on weekly charts and momentum, so remember to be patient! No day trades here unless the stock soars up intraday. Today we’re covering:
COMPANY: Ally Financial Inc.
STOCK SYMBOL: ALLY
POSITION: Long
TP1 Risk-Reward Ratio: 1.36
TP2 Risk-Reward Ratio: 2.72
Stop Loss: must wait AFTER daily candle closes to exit trade (regular candle, NOT Heiken Ashi)
Ultimate Stop Loss: can exit IMMEDIATELY if price reaches this level during any trading hours
EXPLANATION: Weekly momentum increased and confirmed on Monday 7/7/25 at $40.80/share. Although the stop losses are listed on the chart, if momentum has been lost then we can exit before the price reaches the stop loss.
DISCLAIMER: Please do your own due diligence before making any decisions.
P.S. - Stocks can soar. YOU can soar. Soaring is possible!
-Ayrfolio
XRP Pullback Play — 0.786 Fib Meets Sell-Side LiquidityXRP is currently in a pullback phase. The next high-probability long setup is at the 0.786 Fibonacci retracement, aligning with a Sell-Side Liquidity (SSL) zone.
🟢 Long Trade Setup
Entry Zone: 0.786 retracement
Stop-Loss: Below $2.80
Take-Profit 1: $3.00 (mOpen)
💡 Educational Insight
Sell-Side Liquidity (SSL) represents the pool of stop-losses and pending buy orders resting below recent swing lows. Price often seeks these liquidity pockets before reversing.
The 0.786 retracement aligns with this SSL zone, creating a high-probability setup.
However, confirmation should come from order flow → monitoring absorption, delta shifts, or footprint imbalances at this level will validate whether buyers are stepping in before entering.
🔍 Indicators used:
DriftLine — Pivot Open Zones → For identifying key yearly/monthly/weekly/daily opens that act as major S/R reference points
➡️ Available for free. You can find it on my profile under “Scripts” and apply it directly to your charts for extra confluence when planning your trades.
_________________________________
💬 If you found this helpful, drop a like and comment!

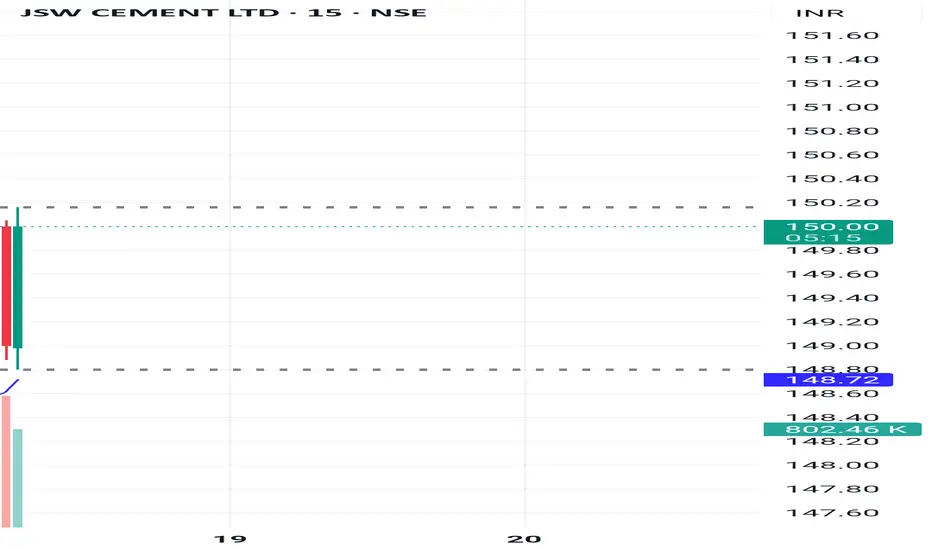
JSW Cement: Company Profile & Sector Analysis
🙀🧐Conclusion 🧐🙀
🤔While JSW Cement demonstrates ambition and operational scale in India’s vibrant cement sector, its financial health is tempered by high leverage and modest returns. Strong governance, strategic debt management, and transparent reporting will be critical as the company seeks market leadership among robust peers. Long-term investors should closely monitor improvements in cash flows and efficiency, given sector opportunities and competitive dynamics.
🧐The cement sector shows strong growth led by robust leaders; JSW Cement is a promising but highly leveraged mid-cap facing profitability and liquidity challenges. Sector fundamentals remain resilient, but JSW’s turnaround depends on prudent financial and governance reforms
🌺🌺About JSW Cement🌺🌺
JSW Cement is a prominent Indian cement manufacturer, recently listed on BSE and NSE in August 2025. The company aims to rapidly expand its production capacity and footprint across key markets with a focus on sustainable manufacturing and innovative processes.
🤯Cement Sector Growth & Future Potential🤯
- India’s cement demand driven by government infrastructure push and urbanization.
- Sector CAGR expected at 7-9% over the next five years with rapid capacity additions.
- Companies investing in green cement, alternative fuels, and digital operations.
- Consolidation and entry of large players signal a highly competitive future market landscape.
🧐Financials Snapshot (FY25)🧐
- Revenue: ₹6,028 crore
- Operating Margin: 15.3%
- EBITDA Margin: 16%
- Net Margin: 1%
- Market Cap: ₹7,400 crore
- Free Cash Flow: Negative
😶🌫️Key Ratios😶🌫️
- Debt/Equity Ratio: 2.6 (sector high)
- Return on Equity (ROE): 0.6% (below industry average)
- Return on Capital Employed (ROCE): 8%
- Current Ratio: 0.65
- Dividend Payout: 0%
👷🏻 Peer Analysis👷🏻
- UltraTech Cement, Shree Cement, and Ambuja Cement lead with stronger margins and lower debt.
- JSW Cement’s leverage (high debt) impacts profitability and shareholder returns.
- Sector leaders maintain ROE and ROCE above 10-13%; JSW lags in these metrics.
- Free cash flow in JSW Cement lags behind top peers due to high investment and operational pressures.
- Margins are competitive but net profitability is limited compared to industry best.
- JSW Cement is positioned as a mid-cap, growth-oriented player with room for efficiency improvement.
- Company’s focus on expansion adds long-term growth potential.
- Peer companies show higher liquidity and sustainable dividend payout records.
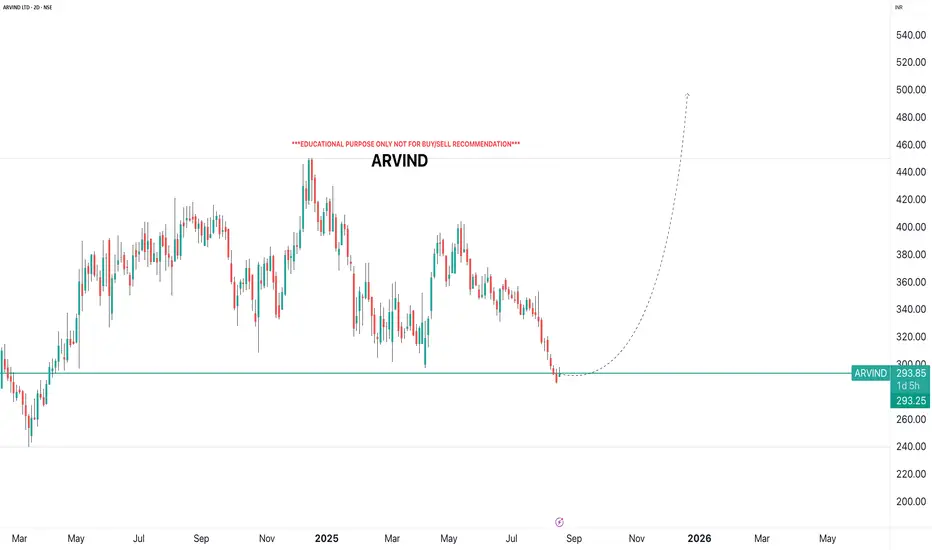
ARVINDi Observed these Levels based on Price Action and Demand & Supply which is my own Concept "PENDAM CONCEPTS"... Please don't take any trades based on this chart/post... Because this chart is for educational purpose only not for Buy or Sell Recommendation... Thank Q
Elliott Wave Analysis of Kirloskar Brothers KIRLOSBROSThe script is currently in 4th wave of hourly chart. The 4th wave seems to be ending, which means a 5th wave will start from here. The wave patters and patterns, retracements and analysis have been highlighted on the chart. Will update this as it progresses.

ETH — Right-Angled Broadening BreakoutEthereum (ETH) has completed a Right-Angled Descending Broadening Pattern that developed over a period of 515 days. Such long-term structures are rare and often mark significant turning points in the market.
🔎 Pattern Breakdown
A–E → swings inside the broadening formation.
F → breakout above the flat resistance.
G (anticipated) → Retest of the breakout zone near $4000, where former resistance may establish itself as support.
The flat top resistance between $4000–$4100 has already given way. A successful retest and hold above this zone would confirm breakout validity and strengthen the probability of continuation toward ATH and beyond.
Trade Setup View
Retest entry zone (G): ~$4000
Invalidation (Stop-Loss): To be determined based on price action during the retest
TP1: Retest of ATH $4867
TP2: $5390
Final target (measured move): $6800
Risk-to-Reward: 1:7+ potential
Why $6800?
The measured move of a broadening formation is its full height projected upward from the breakout point:
Broadening low: $1383.26
Broadening high: $4109
➡️ Height = $2725.74
Add that to the breakout zone (~$4100) → $6825. Rounded, that gives a final target of $6800.
💡 Educational Takeaway
Right-Angled Descending Broadening Formations show growing volatility with buyers holding a ceiling steady while sellers run out of steam. Once that flat resistance breaks, momentum usually shifts in favour of the bulls. Since this one lasted over 500 days, the breakout isn’t just noise. It’s a macro signal that could define ETH’s next major trend leg.
Level to Watch Closely:
$4000 → the expected retest (G). Holding here would be a strong confirmation that ETH is ready to aim for ATH and price discovery.
_________________________________
💬 If you found this helpful, drop a like and comment!

LINK Rally Cools Off — Next Long Opportunity at $20LINK has awakened with strength, rallying +60% in just 10 days. Price completed a clean 5-wave Elliott impulse, topping at the 1.0 trend-based Fib extension, which aligned with:
0.702 Fib retracement
Pitchfork upper resistance line
Key resistance zone
This perfect confluence marked the 5th wave top, followed by a -13% correction.
🔴 Short Opportunity
The current structure is forming a Head & Shoulders pattern.
➡️ Resistance zone: $23 – $23.5
🧩 Confluence factors:
Anchored VWAP (red line) from the 5th wave top
Fib speed resistance fan – Golden Pocket
➡️ Target: $20 support zone.
🟢 Long Opportunity Zone
The $20 zone offers the strongest confluence for a long entry:
Yearly Open (yOpen): $20.02
0.5 Fib retracement: $20.09 (of the 5 Elliott waves)
Pitchfork golden pocket
Anchored VWAP (green line): $20.28 (swing high)
Fair Value Gap (FVG) / imbalance fill
Liquidity pool
$20 psychological level
Trade Plan:
Entry: $20.5 – $19.5
Stop Loss: Below $19
Take Profit: $25
Potential gain: +25%
R:R: ~1:5
🔍 Indicators used:
DriftLine — Pivot Open Zones → For identifying key yearly/monthly/weekly/daily opens that act as major S/R reference points
➡️ Available for free. You can find them on my profile under “Scripts” and apply them directly to your charts for extra confluence when planning your trades.
_________________________________
💬 If you found this helpful, drop a like and comment!

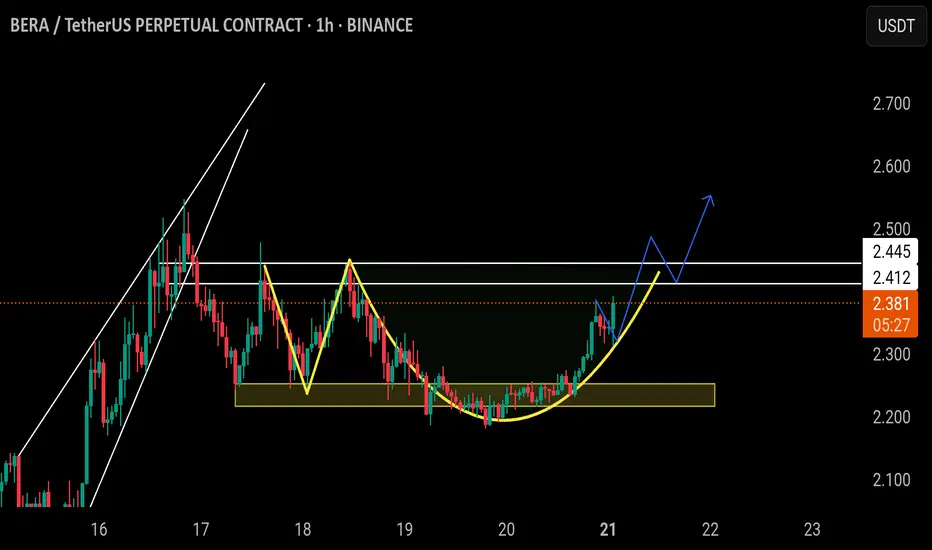
$BERA/USDT | READY TO FLY (ADAM AMD EVE PATTERN)BINANCE:BERAUSDT.P
$Bera/Usdt
The price is forming Adam and even pattern, if the price able the break above the white lines resistance, following a successful retest, the price will go higher and higher.
Aggressive entry at Current market price.
Safe entry after the breakout of white lines resistance following a successful retest of the white lines.
NFA DYOR
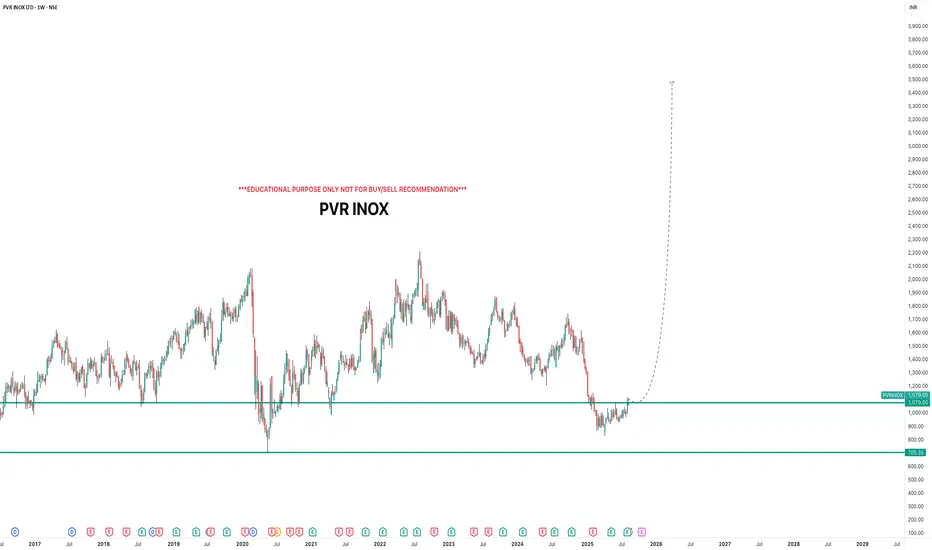
PVR INOXi Observed these Levels based on Price Action and Demand & Supply which is my own Concept "PENDAM CONCEPTS"... Please don't take any trades based on this chart/post... Because this chart is for educational purpose only not for Buy or Sell Recommendation... Thank Q
XSP Fed Rate Cut AnalysisCBOE:XSP AMEX:SPY
Based on the chart, since the additional liquidity from the 620 range has been collected, before the Federal Reserve meeting on September 16-17 we could see prices dip to fill the FVG (611-617) and if that doesn’t hold the supply zone (604-610). I am bullish on the rate cuts due to the worsening job market and moderate inflation numbers previously reported including those caused by businesses like Walmart choosing to eat the trumps Tariffs. If rates do get cut, I am targeting 650 (1.618 fib extension). If not we can see a sharp move to the downside, returning back to test the Supply Zone.

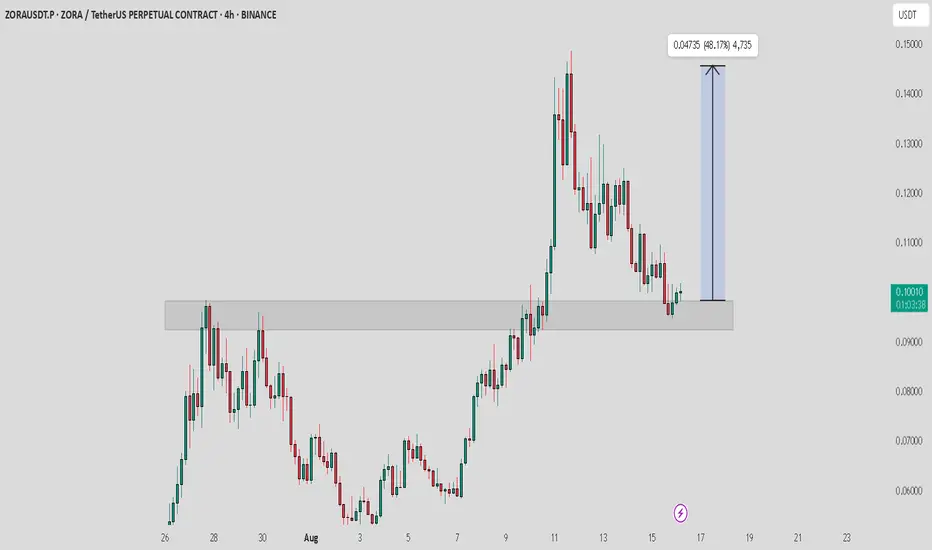
ZORA / USDT : Short term bullish rally expectedZORA/USDT is showing strong potential for a short-term bullish rally. The price is bouncing back from support and is nearing a breakout from the trendline on the 1H timeframe.
Keep a close watch for the breakout, but always manage your risk properly.
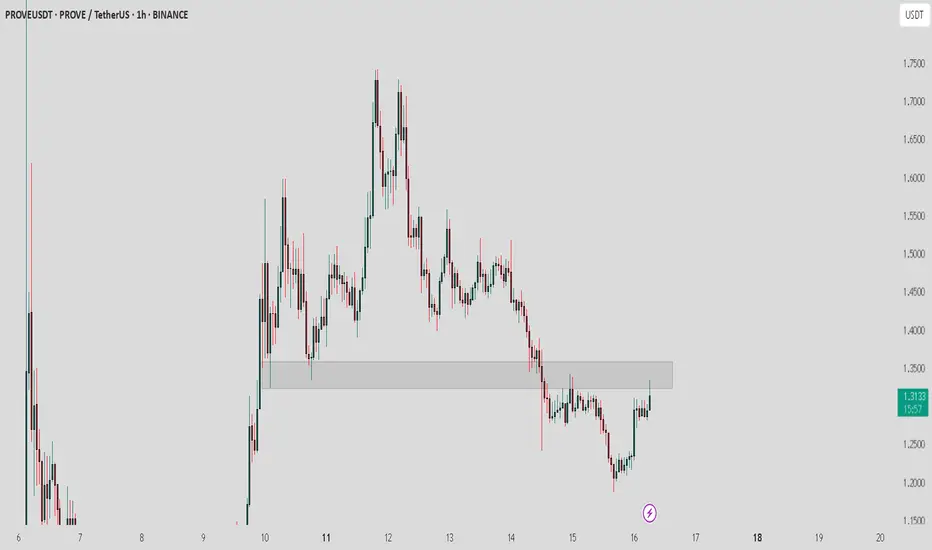
PROVE / USDT : Testing horizontal resistancePROVE/USDT - Testing Horizontal Resistance
PROVE/USDT is currently facing horizontal resistance. Keep a close watch as a strong breakout above this level could trigger a significant move towards $1.5 - $1.7.
Stay alert for confirmation of the breakout for the next potential upward move.
KERNEL / USDT : Keep a close watch on breakoutKERNEL/USDT - Near Breakout
Price action is approaching a crucial breakout point after consolidating under a descending trendline. The current momentum indicates a potential upside of around 30%, with a target of 0.28 if the breakout holds.
Watch for a clean breakout above resistance for confirmation of the move. This could lead to a significant upward rally

HBAR’s ABC Setup — Short-Term Pain, Long-Term Gain?HBAR has been consolidating sideways for the past 30 days, with $0.27 acting as a clear resistance — aligning with the golden pocket (GP). Price failed to sustain above the yearly open (yOpen) at $0.26901, despite multiple attempts. Each breakout attempt lacked follow-through → weakness.
Structurally, HBAR appears to be in a corrective phase after completing five Elliott waves, and is now potentially forming an ABC corrective pattern. Price has also lost the monthly open (mOpen) at $0.25099, which should now act as resistance.
🔴 Short Opportunity
Previous ideal entry: $0.27463 (Golden Pocket) — offered an R:R of ~1:7
Next short zone: Between mOpen ($0.25099) and yOpen ($0.26901)
Target: Around $0.21/$0.2 as take-profit (TP)
🟢 Long Opportunity Zone
➡️ Primary zone: $0.21 – $0.19675
🧩 Confluence factors:
FVG (Fair Value Gap) / imbalance fill
SSL (Support/Stop-Loss liquidity) positioned in the zone
Weekly level: $0.20685
0.55 Fib retracement: $0.20657 (aligned with the weekly level)
0.75 Fib speed resistance fan: Supports this zone if price reaches it between 19 – 25 Aug
1.0 trend-based Fib extension: $0.19675 (projected Wave C target of ABC)
Pitchfork lower support line intersecting with the zone
nPOC & key level: $0.2
With all these aligning, this is the most favourable long setup.
Long Trade Setup Example
Entry: $0.21– $0.19675
Stop Loss: Below $0.19
TP1: ~$0.223
Final target: $0.3+ (swing trade potential)
R:R: 1:6+
🔍 Indicators used:
DriftLine — Pivot Open Zones → For identifying key yearly/monthly/weekly/daily opens that act as major S/R reference points
➡️ Available for free. You can find them on my profile under “Scripts” and apply them directly to your charts for extra confluence when planning your trades.
_________________________________
💬 If you found this helpful, drop a like and comment!

XAU/USD Technical Outlook for the upcoming week In this video I look at the current PA of gold using TPO chart and correlate a plan for where we could see price go in the coming week .
I use a regular chart and TPO chart for this analysis as well as Fibonacci tools .
We are currently in the middle of a range and until that range is broken we plan ahead and seek the best high probability setup via looking at the charts and correlating with the News catalysts.
