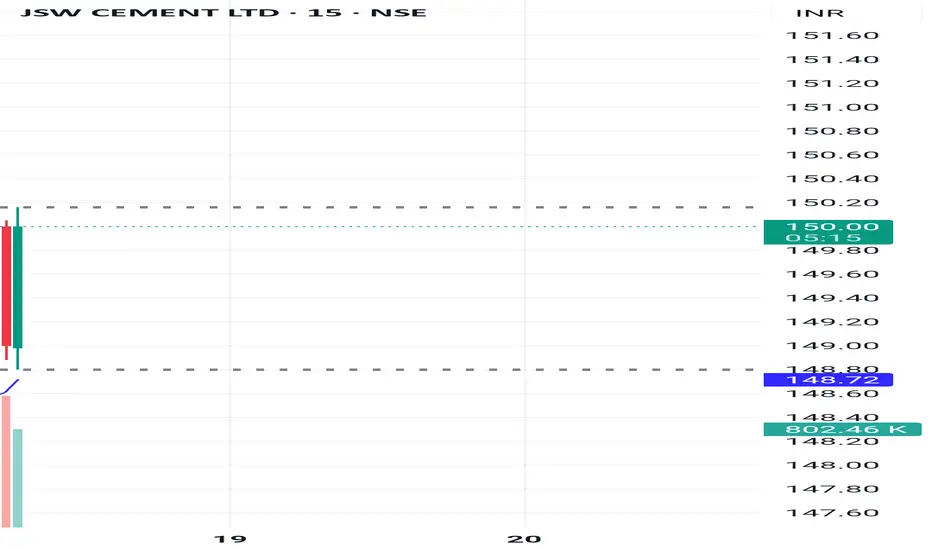
JSW Cement: Company Profile & Sector Analysis
🙀🧐Conclusion 🧐🙀
🤔While JSW Cement demonstrates ambition and operational scale in India’s vibrant cement sector, its financial health is tempered by high leverage and modest returns. Strong governance, strategic debt management, and transparent reporting will be critical as the company seeks market leadership among robust peers. Long-term investors should closely monitor improvements in cash flows and efficiency, given sector opportunities and competitive dynamics.
🧐The cement sector shows strong growth led by robust leaders; JSW Cement is a promising but highly leveraged mid-cap facing profitability and liquidity challenges. Sector fundamentals remain resilient, but JSW’s turnaround depends on prudent financial and governance reforms
🌺🌺About JSW Cement🌺🌺
JSW Cement is a prominent Indian cement manufacturer, recently listed on BSE and NSE in August 2025. The company aims to rapidly expand its production capacity and footprint across key markets with a focus on sustainable manufacturing and innovative processes.
🤯Cement Sector Growth & Future Potential🤯
- India’s cement demand driven by government infrastructure push and urbanization.
- Sector CAGR expected at 7-9% over the next five years with rapid capacity additions.
- Companies investing in green cement, alternative fuels, and digital operations.
- Consolidation and entry of large players signal a highly competitive future market landscape.
🧐Financials Snapshot (FY25)🧐
- Revenue: ₹6,028 crore
- Operating Margin: 15.3%
- EBITDA Margin: 16%
- Net Margin: 1%
- Market Cap: ₹7,400 crore
- Free Cash Flow: Negative
😶🌫️Key Ratios😶🌫️
- Debt/Equity Ratio: 2.6 (sector high)
- Return on Equity (ROE): 0.6% (below industry average)
- Return on Capital Employed (ROCE): 8%
- Current Ratio: 0.65
- Dividend Payout: 0%
👷🏻 Peer Analysis👷🏻
- UltraTech Cement, Shree Cement, and Ambuja Cement lead with stronger margins and lower debt.
- JSW Cement’s leverage (high debt) impacts profitability and shareholder returns.
- Sector leaders maintain ROE and ROCE above 10-13%; JSW lags in these metrics.
- Free cash flow in JSW Cement lags behind top peers due to high investment and operational pressures.
- Margins are competitive but net profitability is limited compared to industry best.
- JSW Cement is positioned as a mid-cap, growth-oriented player with room for efficiency improvement.
- Company’s focus on expansion adds long-term growth potential.
- Peer companies show higher liquidity and sustainable dividend payout records.
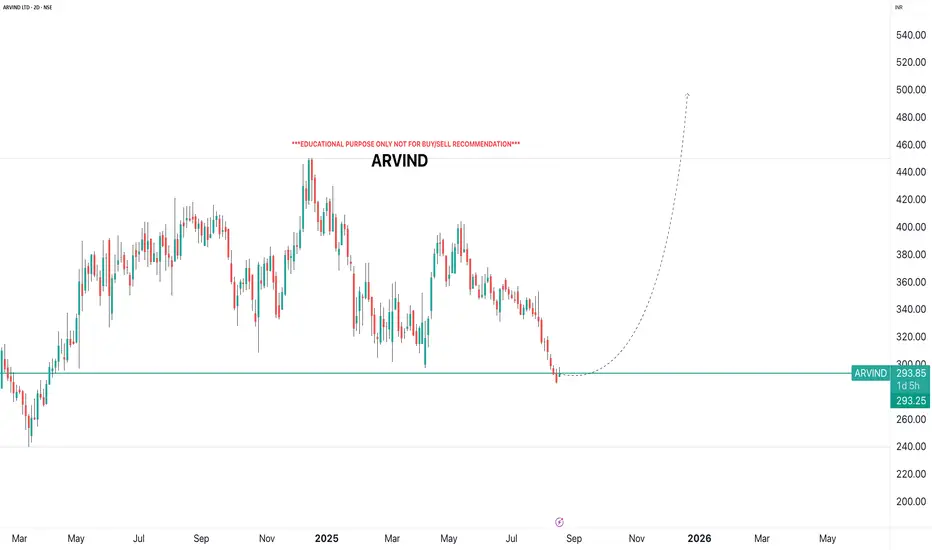
Longsetup
ARVINDi Observed these Levels based on Price Action and Demand & Supply which is my own Concept "PENDAM CONCEPTS"... Please don't take any trades based on this chart/post... Because this chart is for educational purpose only not for Buy or Sell Recommendation... Thank Q
Elliott Wave Analysis of Kirloskar Brothers KIRLOSBROSThe script is currently in 4th wave of hourly chart. The 4th wave seems to be ending, which means a 5th wave will start from here. The wave patters and patterns, retracements and analysis have been highlighted on the chart. Will update this as it progresses.

ETH — Right-Angled Broadening BreakoutEthereum (ETH) has completed a Right-Angled Descending Broadening Pattern that developed over a period of 515 days. Such long-term structures are rare and often mark significant turning points in the market.
🔎 Pattern Breakdown
A–E → swings inside the broadening formation.
F → breakout above the flat resistance.
G (anticipated) → Retest of the breakout zone near $4000, where former resistance may establish itself as support.
The flat top resistance between $4000–$4100 has already given way. A successful retest and hold above this zone would confirm breakout validity and strengthen the probability of continuation toward ATH and beyond.
Trade Setup View
Retest entry zone (G): ~$4000
Invalidation (Stop-Loss): To be determined based on price action during the retest
TP1: Retest of ATH $4867
TP2: $5390
Final target (measured move): $6800
Risk-to-Reward: 1:7+ potential
Why $6800?
The measured move of a broadening formation is its full height projected upward from the breakout point:
Broadening low: $1383.26
Broadening high: $4109
➡️ Height = $2725.74
Add that to the breakout zone (~$4100) → $6825. Rounded, that gives a final target of $6800.
💡 Educational Takeaway
Right-Angled Descending Broadening Formations show growing volatility with buyers holding a ceiling steady while sellers run out of steam. Once that flat resistance breaks, momentum usually shifts in favour of the bulls. Since this one lasted over 500 days, the breakout isn’t just noise. It’s a macro signal that could define ETH’s next major trend leg.
Level to Watch Closely:
$4000 → the expected retest (G). Holding here would be a strong confirmation that ETH is ready to aim for ATH and price discovery.
_________________________________
💬 If you found this helpful, drop a like and comment!

LINK Rally Cools Off — Next Long Opportunity at $20LINK has awakened with strength, rallying +60% in just 10 days. Price completed a clean 5-wave Elliott impulse, topping at the 1.0 trend-based Fib extension, which aligned with:
0.702 Fib retracement
Pitchfork upper resistance line
Key resistance zone
This perfect confluence marked the 5th wave top, followed by a -13% correction.
🔴 Short Opportunity
The current structure is forming a Head & Shoulders pattern.
➡️ Resistance zone: $23 – $23.5
🧩 Confluence factors:
Anchored VWAP (red line) from the 5th wave top
Fib speed resistance fan – Golden Pocket
➡️ Target: $20 support zone.
🟢 Long Opportunity Zone
The $20 zone offers the strongest confluence for a long entry:
Yearly Open (yOpen): $20.02
0.5 Fib retracement: $20.09 (of the 5 Elliott waves)
Pitchfork golden pocket
Anchored VWAP (green line): $20.28 (swing high)
Fair Value Gap (FVG) / imbalance fill
Liquidity pool
$20 psychological level
Trade Plan:
Entry: $20.5 – $19.5
Stop Loss: Below $19
Take Profit: $25
Potential gain: +25%
R:R: ~1:5
🔍 Indicators used:
DriftLine — Pivot Open Zones → For identifying key yearly/monthly/weekly/daily opens that act as major S/R reference points
➡️ Available for free. You can find them on my profile under “Scripts” and apply them directly to your charts for extra confluence when planning your trades.
_________________________________
💬 If you found this helpful, drop a like and comment!

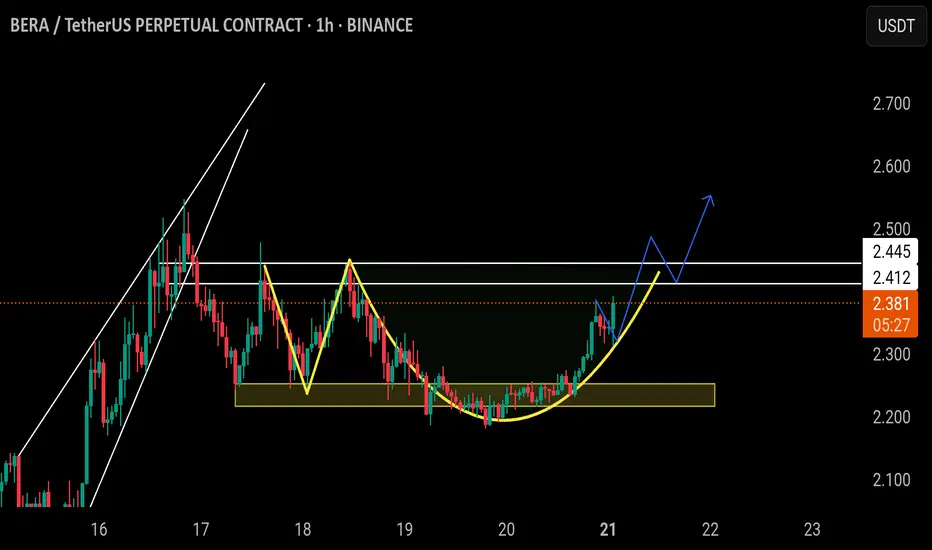
$BERA/USDT | READY TO FLY (ADAM AMD EVE PATTERN)BINANCE:BERAUSDT.P
$Bera/Usdt
The price is forming Adam and even pattern, if the price able the break above the white lines resistance, following a successful retest, the price will go higher and higher.
Aggressive entry at Current market price.
Safe entry after the breakout of white lines resistance following a successful retest of the white lines.
NFA DYOR
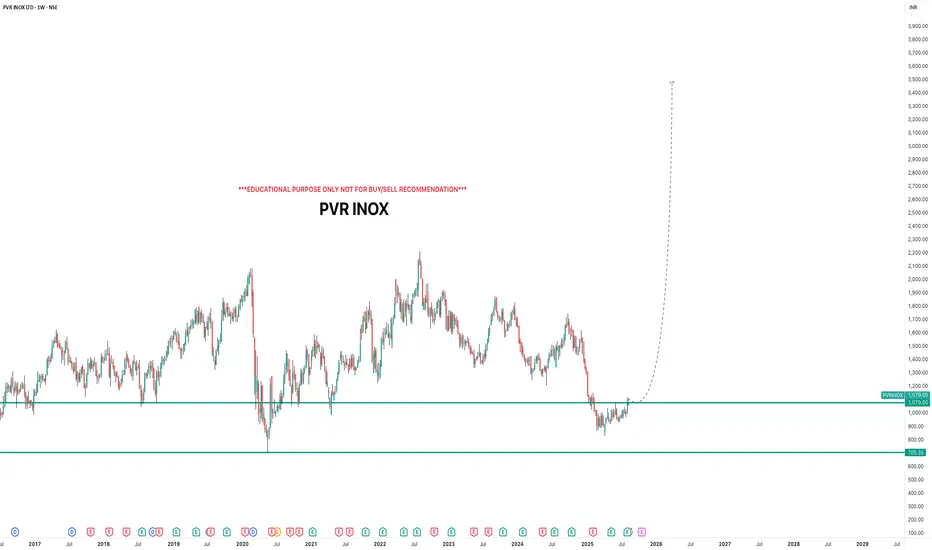
PVR INOXi Observed these Levels based on Price Action and Demand & Supply which is my own Concept "PENDAM CONCEPTS"... Please don't take any trades based on this chart/post... Because this chart is for educational purpose only not for Buy or Sell Recommendation... Thank Q
XSP Fed Rate Cut AnalysisCBOE:XSP AMEX:SPY
Based on the chart, since the additional liquidity from the 620 range has been collected, before the Federal Reserve meeting on September 16-17 we could see prices dip to fill the FVG (611-617) and if that doesn’t hold the supply zone (604-610). I am bullish on the rate cuts due to the worsening job market and moderate inflation numbers previously reported including those caused by businesses like Walmart choosing to eat the trumps Tariffs. If rates do get cut, I am targeting 650 (1.618 fib extension). If not we can see a sharp move to the downside, returning back to test the Supply Zone.

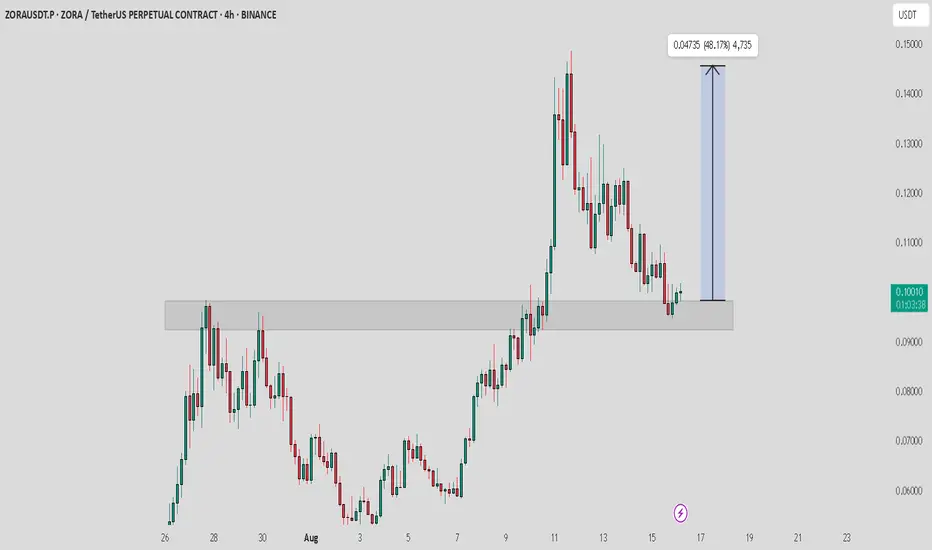
ZORA / USDT : Short term bullish rally expectedZORA/USDT is showing strong potential for a short-term bullish rally. The price is bouncing back from support and is nearing a breakout from the trendline on the 1H timeframe.
Keep a close watch for the breakout, but always manage your risk properly.
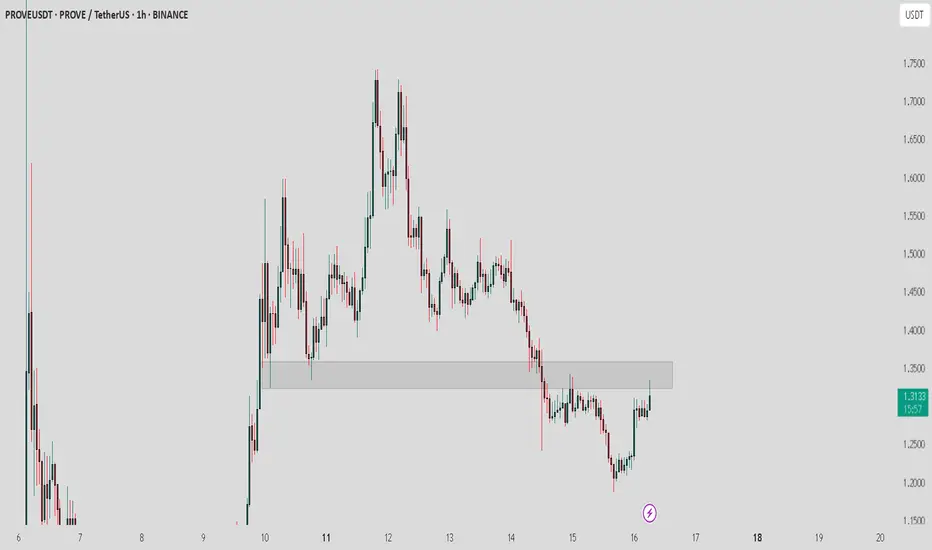
PROVE / USDT : Testing horizontal resistancePROVE/USDT - Testing Horizontal Resistance
PROVE/USDT is currently facing horizontal resistance. Keep a close watch as a strong breakout above this level could trigger a significant move towards $1.5 - $1.7.
Stay alert for confirmation of the breakout for the next potential upward move.
KERNEL / USDT : Keep a close watch on breakoutKERNEL/USDT - Near Breakout
Price action is approaching a crucial breakout point after consolidating under a descending trendline. The current momentum indicates a potential upside of around 30%, with a target of 0.28 if the breakout holds.
Watch for a clean breakout above resistance for confirmation of the move. This could lead to a significant upward rally

HBAR’s ABC Setup — Short-Term Pain, Long-Term Gain?HBAR has been consolidating sideways for the past 30 days, with $0.27 acting as a clear resistance — aligning with the golden pocket (GP). Price failed to sustain above the yearly open (yOpen) at $0.26901, despite multiple attempts. Each breakout attempt lacked follow-through → weakness.
Structurally, HBAR appears to be in a corrective phase after completing five Elliott waves, and is now potentially forming an ABC corrective pattern. Price has also lost the monthly open (mOpen) at $0.25099, which should now act as resistance.
🔴 Short Opportunity
Previous ideal entry: $0.27463 (Golden Pocket) — offered an R:R of ~1:7
Next short zone: Between mOpen ($0.25099) and yOpen ($0.26901)
Target: Around $0.21/$0.2 as take-profit (TP)
🟢 Long Opportunity Zone
➡️ Primary zone: $0.21 – $0.19675
🧩 Confluence factors:
FVG (Fair Value Gap) / imbalance fill
SSL (Support/Stop-Loss liquidity) positioned in the zone
Weekly level: $0.20685
0.55 Fib retracement: $0.20657 (aligned with the weekly level)
0.75 Fib speed resistance fan: Supports this zone if price reaches it between 19 – 25 Aug
1.0 trend-based Fib extension: $0.19675 (projected Wave C target of ABC)
Pitchfork lower support line intersecting with the zone
nPOC & key level: $0.2
With all these aligning, this is the most favourable long setup.
Long Trade Setup Example
Entry: $0.21– $0.19675
Stop Loss: Below $0.19
TP1: ~$0.223
Final target: $0.3+ (swing trade potential)
R:R: 1:6+
🔍 Indicators used:
DriftLine — Pivot Open Zones → For identifying key yearly/monthly/weekly/daily opens that act as major S/R reference points
➡️ Available for free. You can find them on my profile under “Scripts” and apply them directly to your charts for extra confluence when planning your trades.
_________________________________
💬 If you found this helpful, drop a like and comment!

XAU/USD Technical Outlook for the upcoming week In this video I look at the current PA of gold using TPO chart and correlate a plan for where we could see price go in the coming week .
I use a regular chart and TPO chart for this analysis as well as Fibonacci tools .
We are currently in the middle of a range and until that range is broken we plan ahead and seek the best high probability setup via looking at the charts and correlating with the News catalysts.

XAUUSD – Bears tighten control below key resistanceXAUUSD is facing clear pressure as both technical and fundamental factors are not favoring the bulls. On the H4 chart, price remains within an ascending channel but has repeatedly failed to break through the 3,372 – 3,409 USD resistance zone. The support trendline from the August low is still holding, yet the weak recovery suggests that a break below 3,333 USD could trigger stronger selling pressure, potentially pushing the price down to 3,310 USD or lower.
From a fundamental perspective, U.S. Core Retail Sales came in at 0.3%, below the 0.5% forecast — typically a supportive signal for gold. However, with UoM Consumer Sentiment rising to 61.9 and inflation expectations at 4.5%, the market leans toward the Fed maintaining higher interest rates for longer, which supports the USD and limits gold’s upside.
At the moment, sellers maintain the upper hand and will likely remain in control if strong rejection signals appear near resistance. Only a decisive break above 3,409 USD could invalidate the short-term bearish outlook.

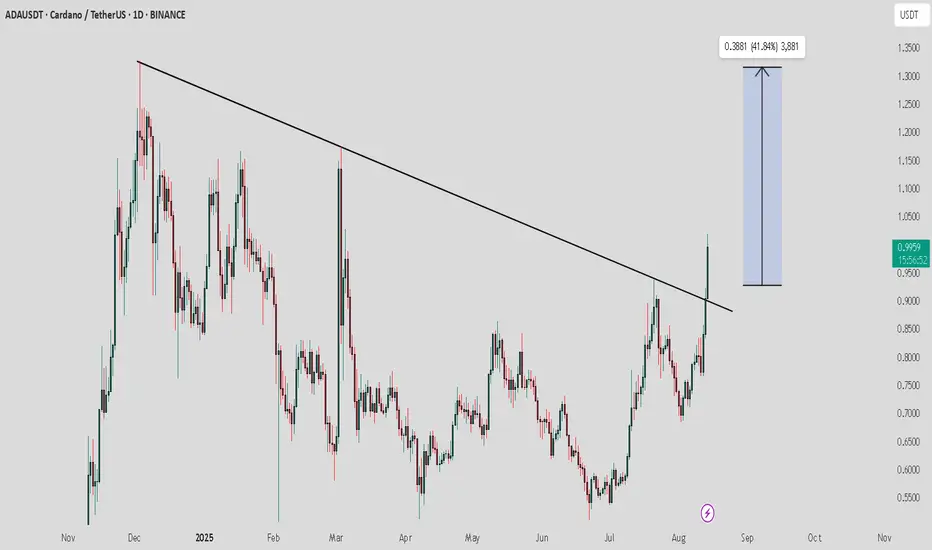
ADA / USDT : Bullish breakout with strong potentialADA/USDT – Bullish Breakout Alert
ADA has broken above a key descending trendline, confirming a bullish breakout. With strong momentum, the price is now targeting 1.38 USDT, offering a potential 41.84% upside. Keep an eye on any pullbacks for better entry points and risk management.
Key Points:
Breakout above resistance.
Potential target: 1.38 USDT (41.84% gain).
Watch for retests or pullbacks before entering.
Manage risk and stay updated on market conditions!
EIGEN / USDT : Keep a close watch on retest processEIGEN/USDT – Bullish Breakout Potential
EIGEN has broken the descending resistance trendline, signaling a possible upward move. The current breakout shows strong bullish momentum with a target of around 0.830 USDT, offering a potential 52.73% gain. Keep an eye on this level for possible retest and confirmation.
Key Points:
Strong trend reversal from the downtrend.
Breakout above resistance could lead to further gains.
Target price 2.4 USDT.
Risk management advised for volatile market conditions.
Stay sharp and trade wisely!

USDJPY – Bullish Trend Continues StronglyThe USDJPY pair is currently trading within an upward channel, with solid support at 146.500 JPY, and there is potential for further gains towards the next resistance level at 148.400 JPY.
The chart shows that the price continues to form higher lows, reinforcing the bullish trend. The strength of the US dollar, supported by the Fed's tightening policies, further drives this trend.
Impact from News:
Strong US labor market data and decisive monetary policy from the Fed continue to support the USD. If USDJPY breaks through the resistance at 148.400, the bullish trend may continue toward the 150.000 JPY level.
However, if the support at 146.500 is broken, a pullback to 145.000 could occur.
In summary, the bullish trend remains strong, with the next target being the resistance at 148.400 JPY.

TRADE PLAN: Bulls vs BearsHello, fellow traders! We've created a 2-scenario trade plan based on the most recent technical, macro, and trader sentiment using 4 hour charts - because we love you!
1. BULLISH SCENARIO — rebound from support
Price is oversold on the 4H RSI and nearing key support (146.4–147.0). Fed easing expectations are already priced in, so any upside surprise in U.S. data, or lack of follow-through selling, could trigger a corrective rally.
TRADE PLAN:
Entry: 146.40–147.00 (look for a 4H bullish candle or RSI divergence confirmation)
Stop: Below 146.00 (clear break under the next support cluster)
Target 1 (Partial trade plan): 147.80 (local resistance)
Target 2 (Full trade plan): 148.50 (Aug 12 high)
SUPPORT LEVELS:
Support 1: 146.40–147.00
Support 2: 146.00
RESISTANCE LEVELS:
Resistance 1: 147.80
Resistance 2: 148.50
RISK/REWARD: ~1:2 from midpoint entry (146.70), risking 70 pips for 140 pips potential.
__________________________________________________
2. BEARISH SCENARIO — continuation lower
The pair remains in a short-term 4H downtrend after failing above 148.5. Softer U.S. CPI reinforced Fed cut odds, while Japan’s inflation remains >2% with a mildly hawkish BoJ bias — supportive for yen strength.
TRADE PLAN:
Entry: 147.80–148.00 (sell into a retest of broken support / 4H resistance)
Stop: Above 148.50 (invalidated if breakout above Aug 12 high)
Target 1 (Partial TP): 147.00 (intraday swing low area)
Target 2 (Full TP): 146.00 (deeper swing support)
RESISTANCE LEVELS:
Resistance 1: 147.80
Resistance 2: 148.50
SUPPORT LEVELS:
Support 1: 147.00
Support 2: 146.00
Support 3: 145.80
RISK/REWARD: ~1:2.5 from midpoint entry (147.90), risking 60 pips for 150 pips potential.
_________________________________________
PROBABILITY ASSESSMENT (based on our most current data)
Bearish case is slightly more probable near-term because macro backdrop favors JPY (BoJ gradually normalizing, U.S. rate cut expectations rising).
Price action still in 4H downswing with momentum (MACD) negative and resistance overhead. CFTC data shows yen longs reduced — less chance of a squeeze higher on short-covering. That said, oversold conditions mean bullish bounces are possible, but likely corrective rather than trend-changing unless U.S. data turns hawkish again.
We hope you found our analysis helpful and thank you for reading. Follow us here on TradingView for more up to date analysis. Happy trading!
__________________________________________
DISCLAIMER: Our analysis is not 100% absolute. We are not responsible for any losses incurred. Please be sure to do your own research before investing or trading.

Breaking resistance - gold price continues to recover⭐️GOLDEN INFORMATION:
Gold (XAU/USD) edged up to around $3,365 in early Asian trading on Thursday, marking its third straight day of gains as a softer U.S. Dollar lent support. Market participants now turn their attention to the U.S. Producer Price Index (PPI) and weekly Initial Jobless Claims data, both due later in the day, for fresh direction.
This week’s softer U.S. inflation figures have strengthened expectations for a Federal Reserve rate cut in September and increased the likelihood of further easing before year-end. The resulting pressure on the Greenback has underpinned demand for the Dollar-denominated metal. Lower interest rates tend to reduce the opportunity cost of holding gold, making the non-yielding asset more attractive to investors.
⭐️Personal comments NOVA:
Gold price recovers in bullish pattern, still maintaining accumulation price range 3300 - 3400
⭐️SET UP GOLD PRICE:
🔥SELL GOLD zone: 3388- 3390 SL 3395
TP1: $3380
TP2: $3367
TP3: $3350
🔥BUY GOLD zone: $3332-$3330 SL $3325
TP1: $3340
TP2: $3352
TP3: $3365
⭐️Technical analysis:
Based on technical indicators EMA 34, EMA89 and support resistance areas to set up a reasonable BUY order.
⭐️NOTE:
Note: Nova wishes traders to manage their capital well
- take the number of lots that match your capital
- Takeprofit equal to 4-6% of capital account
- Stoplose equal to 2-3% of capital account

AIRLINKAIRLINK – Daily Chart: Descending Channel Breakout Setup 📉➡📈
Technical Picture
Price has been respecting a downward-sloping channel for several weeks
The lower highs and lower lows defined the downtrend until recently. breaking out!
Now,
Breakout confirmation: 🚀
Upper Cap done!
Volume expansion on breakout day
Buy on retracement or use buy stop order 140 150 or buy agressively from CRP (current market price)
Retest buy zone: PKR 138–140 after breakout 🛡
Short-term target: PKR167 🎯
Medium-term target: PKR 180 and 186 if momentum holds ⛰
Medium-term target: PKR 200 and 228 if momentum holds ⛰
Fundamentals Still Solid & Confirmed
Xiaomi Smart TVs: Local assembly started Jan 2025 via subsidiary Select Technologies.
Earnings: FY24 Revenue +162%, PAT +242%, EPS Rs 7.74, Dividend Rs 6.
Product Range: Samsung, Xiaomi, Apple, Tecno, Acer, wearables — keeps diversification strong.

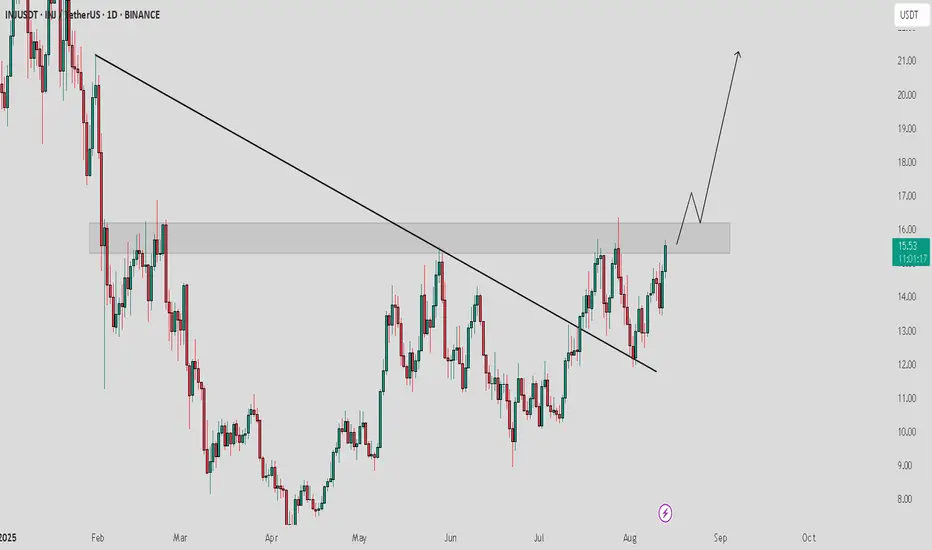
INJ / USDT : Trying to break horizontal resistanceINJUSDT is breaking out from a key resistance zone after a strong rally, signaling potential for further upside. We’ve seen a clear breakout from the downward trendline, and with price now moving above $15, the next target could be towards $16+
The chart shows strong bullish momentum, and the breakout from the consolidation range suggests that momentum is likely to continue. Watch for a retest of the $15 zone as support before considering new long positions.
Key levels to watch:
Support: $14.50 - $15
Resistance: $16+
Trend: Bullish, with potential continuation.
Keep an eye on market volume and any news that may impact this movement.
GBPJPY continues its uptrend, aiming for 200,000 JPY.GBPJPY is currently trading within an ascending channel, with a strong rebound from support levels near 198,000 JPY. After forming a higher low at 199,000 JPY, the chart suggests the possibility of continuing the uptrend if GBPJPY can break through the next resistance at 200,000 JPY.
Recent news about the UK GDP growth and statements from Bank of England (BoE) officials are supporting the British Pound. Additionally, the BoE's tightening monetary policy to control inflation is helping stabilize and strengthen the Pound against the Japanese Yen. On the other hand, with the Bank of Japan's interest rate policy remaining largely unchanged, the JPY continues to weaken amid economic challenges.
If GBPJPY can break the 200,000 JPY resistance, the next upward target will be 201,000 JPY, and further towards 202,000 JPY. However, the current support lies at 199,000 JPY, and if this level is broken, a pullback to 198,000 JPY may occur.

Potential Rebound | Swing Opportunity Illustrated is a potential entry for a swing opportunity to target ATH, at least 3400 - 3500
NY’s manipulation on Tuesday was a key price action that shows intentions of retesting 3400.
—
GOOD LUCK
