Ethereum: Reverse Head & Shoulders Aiming ATHETH weekly chart is printing a big reverse head & shoulders pattern.
Three rounded lows :
Left shoulder ✅
Deeper head ✅
Right shoulder now forming ✅
Why it matters :
Each dip gets bought higher, showing strong demand. 💪
The neckline is basically the ATH resistance around 4,850.
What I’m watching :
As long as the right shoulder holds, bias stays bullish. 📈
A clean weekly close above the neckline would confirm the pattern and open the door to new highs. 🎯
Longsetup

US100 bullish OF ( LONG IDEA )Bullish structure on US100 with unmitigated supply above.
Unmitigated supply zone likely to be revisited for mitigation.
This is not financial advice. Trade at your own risk
( Invalid if price reaches supply before triggering entry )

Disney's Possible Swing SetupHi Traders!
As I analyze Disney, I am seeing it's in a counter trend on the 24HR with a resistance at $120. I'm staying patient watching to see how far price will retrace with a 24HR CHOCH sitting at around $102.50. That seems far away, but that would help fill in some of the gap, and give a nice set up for a reversal. In addition, there are 4 days left in the current Monthly candle, and they've been closing small. IMO that could indicate that price could eventually make it to $130.
For now, I have alerts set and I'm planning to take a long swing.
Let me know what you guys think in the comments! Good luck!
*DISCLAIMER: I am not a financial advisor. The ideas and trades I take on my page are for educational and entertainment purposes only. I'm just showing you guys how I trade. Remember, trading of any kind involves risk. Your investments are solely your responsibility and not mine.*

Live trading on Amazon stock.Live trading on Amazon stock.
Price is at the bottom of its channel and sitting in a strong demand zone.
Follow proper risk and money management.
This is just my personal view, so please trade based on your own strategy and trading system.
Follow me on TradingView for more analyses and live stock trades.
NASDAQ:AMZN

Continuing with the new ATH of 4503, the bulls.⭐️GOLDEN INFORMATION:
Market participants are positioning cautiously ahead of the advance estimate of US Gross Domestic Product (GDP) for the third quarter, due later on Tuesday. The US economy is expected to have expanded at an annualized pace of 3.2% in Q3, marking a moderation from the robust 3.8% growth recorded in the second quarter. A stronger-than-forecast GDP print could lend near-term support to the US Dollar and exert downward pressure on USD-denominated commodities.
In addition to the GDP release, traders will also closely monitor a heavy slate of US macro data, including Durable Goods Orders, Industrial Production, and the ADP employment report, all of which could further shape expectations around the growth outlook and the Federal Reserve’s policy trajectory.
⭐️Personal comments NOVA:
Gold's upward trend - breaking through 4382. A massive year-end buying wave is beginning. Waiting for Fibonacci resistance at 4503.
⭐️SET UP GOLD PRICE:
🔥SELL GOLD zone: 4503 - 4505 SL 4510
TP1: $4490
TP2: $4480
TP3: $4465
🔥BUY GOLD zone: 4450 - 4448 SL 4443
TP1: $4460
TP2: $4470
TP3: $4485
⭐️Technical analysis:
Based on technical indicators EMA 34, EMA89 and support resistance areas to set up a reasonable BUY order.
⭐️NOTE:
Note: Nova wishes traders to manage their capital well
- take the number of lots that match your capital
- Takeprofit equal to 4-6% of capital account
- Stoplose equal to 2-3% of capital account

New Highs, No Sell-Off — Smart Money In?Based on the current news backdrop combined with the price structure on the chart , I continue to hold the view that XAUUSD is in a clear and healthy uptrend — not a temporary or emotional spike.
Gold setting a new all-time high around 4,400 shows that the market is strongly pricing in the likelihood of further Fed easing and future rate cuts . More importantly, after making new highs, price did not experience aggressive selling , but instead managed to hold at elevated levels — a clear sign that large capital flows are staying in the market, rather than this being a short-lived FOMO-driven move.
Looking at the chart, gold is moving cleanly along its ascending trendline , with consistent support from the Ichimoku system and dynamic support zones below. The recent pullbacks have been purely technical, allowing the market to “catch its breath” and absorb supply, without breaking the overall structure. This is a market that is moving strong — not overheating.
For me, the 4,380 zone remains a key support level. As long as price holds above this area, the bullish trend remains fully intact. In the short term, my preferred scenario is light consolidation at high levels, followed by a continued push to retest the 4,450 area.
In summary, I continue to favor BUY setups on pullbacks — not chasing price at the highs and never trading against the trend. When both fundamentals and technicals align, the most important skill is patience and discipline to stay with the trend, rather than trying to pick a top in a market that is clearly strong.

AUDUSD Pressured by the Trendline – Chasing BUYs Is Very RiskyOn the H4 timeframe, AUDUSD presents a very clear technical picture: the primary trend remains bearish / sideways-dow n , and the current upswing is more of a technical pullback into supply rather than a genuine trend reversal.
On the chart, price is being pressed down by a descending trendline drawn from prior highs. The zone around 0.6639–0.6640 acts as a key confluence resistance, aligning with the descending trendline and the Ichimoku / previous reaction area. This is the type of zone where price often tags, gets rejected, and reverses if buyers lack sufficient strength.
To the downside, 0.6600 stands as the nearest support and a logical downside target if rejection at resistance occurs. Therefore, in the short term, the high-probability scenario is: price rallies to test 0.6640 → gets sold → drops back toward 0.6600. Only if AUDUSD closes a strong H4 candle decisively above 0.6640 and holds above this level would there be a valid case for a broader bullish extension.
Wishing you disciplined and successful trading!

GBPUSD Weak Rebound – Is Every Rally a Selling Opportunity?GBPUSD is currently leaning toward a scenario of mild downside or low-range consolidation rather than a clear bullish move.
From a macro perspective, the British pound remains under pressure following the recent interest rate cut by the Bank of England. While this move was largely priced in, the accompanying message suggests that BoE is still open to further easing if the UK economy continues to cool. This has made short-term capital flows more cautious toward GBP, especially during rebound phases.
On the other side, the USD continues to hold a relative advantage as investors wait for clearer signals from upcoming US economic data. In the absence of negative surprises for the dollar, GBPUSD lacks strong momentum to push higher, and each rally toward higher levels is more likely to turn into a short-term selling opportunity.
Looking at price behavior, GBPUSD is showing signs of a “pullback within a weak trend” . Upside momentum remains limited, rebounds are shallow, and follow-through buying is lacking—indicating that buyers are not yet ready to take control in the short term.
Conclusion: Over the next 24 hours, GBPUSD favors a scenario of slight downside or pressured consolidation rather than a strong advance. The more prudent strategy is to wait for technical pullbacks and observe price reaction, instead of rushing to anticipate the formation of a new bullish trend.

XAUUSD – The UP Trend Is Still Well ProtectedThe gold market is no longer asking “will it go up or not” — the real question now is how the rally unfolds . When we combine the news backdrop with the price structure on the chart, the bullish picture of XAUUSD becomes increasingly clear.
On the fundamental side , recent U.S. economic data shows a cooling labor market , while expectations for the Fed to continue easing monetary policy remain intact . Yields and the USD are not strong enough to trigger a deep sell-off, and safe-haven demand is still present. This creates a solid macro foundation supporting higher gold prices, rather than a random technical bounce.
From a technical perspective , the uptrend remains clean and well-structured:
• Price is above the Ichimoku cloud, and the cloud is sloping upward → the primary trend remains bullish.
• The 4,300 zone is acting as both a dynamic and psychological support, where price has just pulled back and reacted positively.
• The long-term ascending trendline remains intact → the Higher Low structure is still preserved.
The most logical scenario at this stage is consolidation above 4,300, followed by a continuation toward the 4,380 – 4,390 zone, where the upper trendline resistance converges. This is a classic behavior of a strong market: no sharp sell-offs, no panic — just a pause before the next leg higher.
👉 In summary:
The UPTREND in XAUUSD continues to dominate. As long as 4,300 holds, any pullback should be viewed as a trend-following opportunity, not a reversal signal.

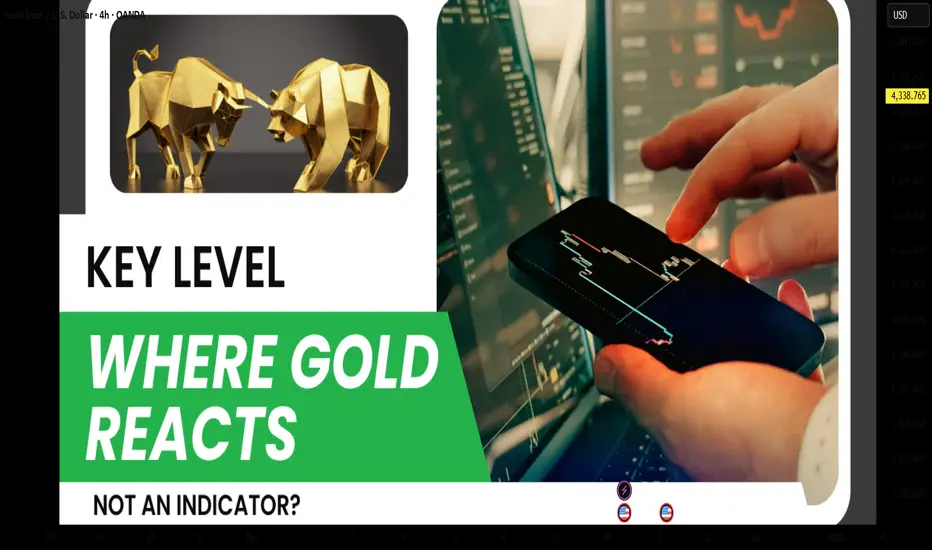
Key Levels – Where Gold Reacts, Not Indicators?Many traders start trading gold using indicators, and that’s something almost everyone goes through. However, the longer you stay in the market, the more clearly you realize one important truth: gold does not react to indicators; it reacts at key levels . Indicators only describe what price has already done, while key levels are where real money actually makes decisions.
Price does not move randomly. It reacts at important price zones.
Key levels are areas where the market has shown clear reactions in the past — strong reversals, repeated rejections, or consolidation before a breakout. In gold trading, these zones often align with major highs and lows, round numbers, or areas of concentrated liquidity.
This is where both retail traders and large capital are paying attention.
One major reason many traders consistently enter too late is over-reliance on indicators. Indicators are always based on past price data, so when a signal appears, the key reaction has often already happened. At that point, entries are less attractive, risk-to-reward deteriorates, and the probability of false breaks or stop hunts increases.
Indicators are not wrong, but they always lag behind price.
Professional traders don’t try to predict whether price will go up or down. They wait for price to reach a key level and then observe how the market reacts. Is price strongly rejected, or does it break through easily? Is real buying or selling pressure actually showing up?
Key levels are not places to predict — they are places to observe and react.
This doesn’t mean indicators are useless. Indicators still have value for momentum confirmation or for understanding market context. But they should not be the primary factor for making entry decisions.
Key levels tell you where to trade.
Indicators only help you understand how price is behaving.
Conclusion
If you are trading gold and still searching for the “best indicator for XAUUSD,” you may be asking the wrong question.
The better question is:
Which key level is the market respecting right now?
Because in the end, price reacts at levels — not at indicators.
Don’t Rush to Call the Top on EURUSDEURUSD in the late December 20–21 period is showing a clearly bullish picture , supported by both fundamental news and technical structure . This is not a euphoric phase , but rather a period where the market slows down to accumulate before making its next move.
From a fundamental perspective, the ECB has kept interest rates unchanged and delivered a relatively positive outlook, while the USD lacks fresh momentum as U.S. data has not been strong enough to push the Fed back into a hawkish stance. This backdrop allows the euro to maintain a short-term advantage.
On the chart, price remains firmly above the 1.1680 support zone , and the Higher Low structure is still intact. The Ichimoku setup shows sideways movement above a thin cloud , a condition that often appears before a trend continuation rather than a reversal.
As long as the current support holds , the preferred scenario remains EURUSD pushing higher toward 1.1750, with the potential to retest the upper resistance zone. When the trend has not broken , following the flow is far wiser than trying to predict a top.

SOLUSDT Demand and SupplyTrading plan = Bearish ( long )
Trading pair = CRYPTOCAP:SOL
Confluence = Demand and Supply
Take Profit = 1st T.P=178.94 2nd T.P=203
Stop loss = Below Demand zone = 94.85
Risk Reward = 1into 2.37

Market Panic: Gold or Crypto?When the market enters a state of panic, the question is no longer “How much profit can I make?” but rather “Which asset helps me survive and protect my capital?”
In moments like these, gold and crypto are often placed side by side. Both are seen as safe havens—but in very different ways, and that difference is the key to making the right decision.
1) Gold – Where Capital Flows When Confidence Breaks
Gold has existed for thousands of years with one core purpose: preserving value.
When inflation rises, geopolitical tensions escalate, or the financial system shows signs of stress, large capital tends to move into gold first.
Why gold performs well during crises:
High global liquidity, accepted across all markets
Relatively “orderly” volatility, suitable for defensive positioning
Often benefits when real interest rates fall and the USD weakens
In other words, gold won’t make you rich overnight, but it helps you avoid being washed away when the storm hits.
2) Crypto – An Asset Driven by Expectations and Emotion
Crypto represents a new generation of assets, where value is heavily influenced by future expectations, technology narratives, and speculative capital.
In normal or euphoric market conditions, crypto can rise very quickly.
But when panic sets in, the story changes.
Here’s the reality we need to face:
Crypto reacts extremely sensitively to “risk-off” sentiment
High leverage + thin liquidity during stress periods can trigger chain liquidations
In major shocks, crypto is often sold alongside growth stocks, rather than acting as a true safe haven
Therefore, crypto is not a defensive asset in the traditional sense—it is an asset of belief and market cycles.
3) When Should You Choose Gold? When Should You Hold Crypto?
The answer is not “which is better,” but what the market context is.
True panic (systemic risk, war, financial crisis):
➡ Gold is usually the preferred choice.
Capital seeks certainty, not stories.
Short-term crisis followed by monetary easing:
➡ Gold often leads the first wave,
➡ Crypto tends to recover more aggressively after a psychological bottom forms.
Stable markets with abundant liquidity:
➡ Crypto performs at its best.
4) My Perspective: Don’t Choose with Emotion
From my experience, the biggest mistake traders make during panic is choosing assets based on personal belief instead of capital flow and market behavior.
A professional trader asks:
Where is large capital taking refuge?
Is current volatility suitable for my trading style?
Is my goal capital preservation or outsized returns?
If your priority is safety and stability, gold is usually the more reasonable choice.
If you accept high risk in pursuit of high reward, crypto should only be approached after clear confirmation, not during extreme panic.

Two Forces Cancel Each Other Out, EURUSD Tilts BearishAlthough the USD is weakening due to expectations that the Fed will continue its monetary easing , EURUSD has failed to break higher as the euro’s internal strength shows clear signs of weakness . With these two fundamental forces offsetting each other , the market is gradually leaning toward a short-term corrective decline.
On the fundamental side, disappointing Eurozone PMI data highlights a sharper-than-expected slowdown in economic growth , particularly in manufacturing and services. This has weighed on the euro, preventing EURUSD from capitalizing on USD weakness and increasing the likelihood of a pullback as buying momentum fades.
From a technical perspective, price is currently pulling back to retest the rising trendline and the Ichimoku cloud, signaling that selling pressure is building. The preferred technical scenario is a pullback toward the 1.1700 area, where dynamic support and structural support converge.
At this stage, it is more appropriate to observe price reaction at key support levels rather than expect a strong upside move. The market is testing patience—and it is often during these corrective phases that the clearest opportunities begin to emerge.

GBPUSD – Downside Pressure Is Gradually Becoming ClearIn the latest session, GBPUSD experienced a sharp pullback as UK inflation came in below expectations , triggering a broad repricing of Bank of England (BoE) monetary policy expectations. November CPI fell to 3.2%, the lowest level in eight months , reinforcing market belief that the BoE now has more room to lean toward interest rate cuts in the period ahead. This development immediately put strong pressure on the British pound.
On the H4 chart, although the broader trend had previously been bullish, the current price structure is clearly showing signs of weakness . Price was strongly rejected from the 1.340–1.343 resistance zone and has continued to form lower highs in the short term. The inability to hold above this area indicates that buyers are gradually losing control.
At present, the 1.335 level serves as a key near-term support. If price rebounds but fails to reclaim the 1.340 resistance, the move is likely to be a technical pullback rather than a trend reversal, with selling pressure expected to return. A decisive break below 1.335 could open the door for further downside expansion in line with a medium-term corrective move.
In summary, with fundamental news turning negative for GBP and technical signals confirming growing selling dominance , the more prudent strategy at this stage is to prioritize selling on rallies, rather than attempting to catch a falling bottom. GBPUSD is entering a sensitive phase, and market volatility is likely to remain elevated as monetary policy expectations continue to evolve in the sessions ahead.

USDJPY Still Hot – 157.00 Is CallingHello traders,
USDJPY is currently showing a short-term bullish bias , as the narrative of a weak JPY despite the BOJ’s rate hike has not yet shifted overall market sentiment. Although the BOJ raised rates to 0.75%, the yen remains soft, indicating that much of the move was already priced in, and markets are still skeptical about the pace of further tightening.
At the same time, the USD continues to hold relative strength across the currency basket, providing a solid foundation for USDJPY to stay supported.
From a technical perspective, price action reflects a “slow but steady” uptrend : higher lows are being formed, and the 155.50 area is acting as a key support and pivot zone . The consolidation around 155.5–156.0 suggests accumulation, and as long as this base holds, the probability favors a move higher to retest the upper resistance.
The preferred scenario is to look for BUY opportunities on pullbacks : if price holds above 155.50 and shows a rebound, the near-term target is 157.00. Only a clear H4 close below 155.50 would weaken the short-term bullish outlook and warrant a reassessment.
Thank you for listening, and wishing you successful trading ahead.

EURUSD Finds Its Rhythm: Buyers Remain in ControlIn the current trading phase, EURUSD is presenting a clean and easy-to-read bullish structure , especially when viewed against a news backdrop that has recently tilted slightly in favor of the euro . Following the ECB’s more stable and optimistic tone , the market has shown less appetite for aggressive USD buying, creating room for EUR to maintain its short-term advantage .
Looking at the chart, the price structure remains clearly constructive : the uptrend is intact with higher highs and higher lows. Recent pullbacks appear to be nothing more than a healthy pause, as price continues to find solid support around the 1.1700 zone — a well-defined technical level where buying interest repeatedly steps in. This behavior confirms that buyers are still in control, rather than stepping aside.
Under a favorable scenario, EURUSD has room to extend higher and test the 1.1800 area , which stands as the nearest resistance and a logical upside target for the current move. As long as price holds above 1.1700, the bullish bias remains dominant, and any pullback should be viewed as opportunity rather than risk.
In summary, EURUSD is advancing in an orderly bullish manner — not rushing into a breakout, yet showing no signs of meaningful weakness . If market sentiment remains steady, the upside path stays open for traders willing to stay patient and follow the trend.

Bitcoin: Bullish Bump‑and‑Run PatternBTC is grinding down a clear descending trendline, with a possible bump‑and‑run reversal pattern. If price “bumps” below the line and then snaps back through it, the pattern calls for a strong run higher toward the 106k zone.
Pattern in simple words 🧠
Lead‑in: Controlled downtrend along the trending line.
Bump: Final washout + fake breakdown, trapping late bears.
Run: Sharp reclaim of the trendline, then momentum push toward prior resistance
What I’m watching 👀
Break and hold above the trendline = bullish trigger.
First target: prior resistance area near 106k.
Idea is invalidated if BTC loses the recent lows and stays under the trendline again.

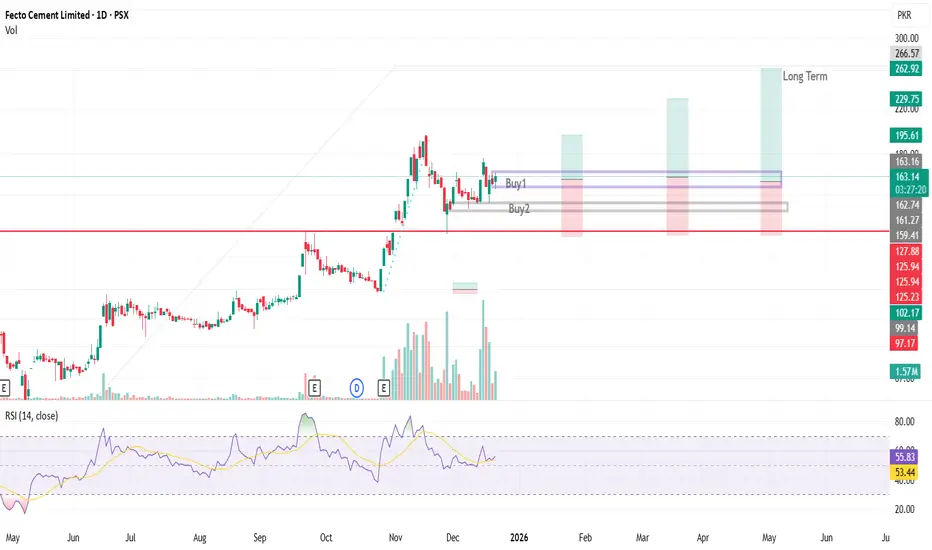
FECTO FECTC📊 FUNDAMENTAL RATINGS & Technical Setup & News IHC ruling
🏭 Operations Update
• Sangjani plant fully operational• Production halt risk eliminated
• Dispatches resumed → better cost absorption
⚖️ Legal & Financial Impact
• IHC ruling in company’s favor • cash flows normalize
Growth: ⭐⭐⭐⭐☆ Stability: ⭐⭐⭐⭐☆ Cashflows: ⭐⭐⭐⭐⭐ Valuation: ⭐⭐⭐⭐☆
📈 Technical Setup (HH–HL Structure)
Price is maintaining a Higher High – Higher Low (HH–HL) structure on the daily chart.
Momentum remains bullish as long as price holds above the last Higher Low.
BTC vs GOLD: Falling Channel Bounce Setup1. What we’re looking at
Price is inside a downward channel.
We just tapped a big support zone (grey box) that also lines up with the lower channel line => strong confluence.
2. Trade idea 🧠
Look for bullish reaction in the grey box (wicks, strong green candles, RSI/volume confirmation).
First logical target: mid‑channel area.
Extended target: upper channel line.
3. Risk management ⚠️
Invalid if weekly closes clean below the grey box and the lower trendline => structure broken.
No breakout yet, so treat it as a counter‑move inside a downtrend, not a guaranteed trend change.
BTC is cheap vs Gold at this multi‑touch support. If this level holds, I expect a bounce toward the middle and then the top of the falling channel. If we lose the box, the idea is invalid and I’m out. What do you think, is BTC ready to outperform gold again from here?

Gold continues to consolidate above 4300, trading sideways.⭐️GOLDEN INFORMATION:
Gold (XAU/USD) trades slightly lower during the Asian session on Thursday, slipping back below the $4,350 handle after recently hitting seven-week highs. The pullback appears driven by profit-taking activity alongside a short-term rebound in the US Dollar (USD). That said, downside risks for the yellow metal look contained, as recent US labor-market data has reinforced expectations for additional rate cuts by the Federal Reserve, keeping broader USD dynamics biased to the downside. A lower interest-rate environment continues to compress the opportunity cost of holding non-yielding assets, providing a supportive backdrop for gold prices.
On the geopolitical front, tensions have intensified after Venezuela reportedly deployed naval forces to escort oil shipments amid threats of a US blockade. Such developments could reignite safe-haven demand, potentially lending renewed support to gold in the near term.
⭐️Personal comments NOVA:
Gold prices are consolidating around 4300, with a predominantly upward trend. Maintaining above 4300 will allow for further accumulation for the upcoming uptrend.
⭐️SET UP GOLD PRICE:
🔥SELL GOLD zone: 4390 - 4392 SL 4397
TP1: $4375
TP2: $4360
TP3: $4345
🔥BUY GOLD zone: 4298 - 4296 SL 4291
TP1: $4310
TP2: $4325
TP3: $4340
⭐️Technical analysis:
Based on technical indicators EMA 34, EMA89 and support resistance areas to set up a reasonable BUY order.
⭐️NOTE:
Note: Nova wishes traders to manage their capital well
- take the number of lots that match your capital
- Takeprofit equal to 4-6% of capital account
- Stoplose equal to 2-3% of capital account

XAUUSD – The Bullish Trend Remains DominantGold prices edged higher in the previous session after the U.S. jobs report showed that the unemployment rate continued to rise , reinforcing expectations that the Fed will maintain its rate-cutting path . As rate expectations decline, the U.S. dollar weakens, providing a solid foundation for gold to sustain its medium-term bullish momentum.
From a technical perspective, XAUUSD on the H2 timeframe continues to maintain a clear bullish structure . Price is trading above the ascending trendline , indicating that buyers remain in control of the market. The 4,300 level is acting as a key support zone, consistently absorbing selling pressure during pullbacks.
As long as XAUUSD holds firmly above 4,300 , the current retracement is likely purely technical. In this scenario, the bullish trend is expected to resume, with upside targets toward the 4,350 – 4,370 zone.
Overall, gold is being supported by both a favorable macro backdrop and a constructive price structure. While the trend remains intact, the optimal strategy is to stay patient and follow the flow of capital, using pullbacks as opportunities rather than chasing price.

Is AUDUSD Sliding Lower in Silence?If we look at AUDUSD as a tug of war right now, it is clear that buyers are losing momentum before any meaningful breakout can occur.
From a fundamental perspective , the Australian dollar lacks a strong catalyst to push higher. Even though the USD is weakening on expectations of further Fed easing, the market remains cautious about global growth prospects and overall risk appetite. When capital turns defensive, risk-sensitive currencies like the AUD are often left behind.
On the technical side, price action tells a clear story. AUDUSD is gradually sliding within a descending channel, consistently forming lower highs. The pair remains pressed below the falling trendline and the Ichimoku cloud , signaling that selling pressure is firmly in control . The 0.6620 area has emerged as a key resistance, where every rebound is quickly met with renewed selling. If this structure holds, the next logical target sits around 0.6590.
In summary, this is not the phase to expect a sharp rebound , but rather a period where the market is releasing pressure in the direction of the trend. Until the AUD finds a convincing narrative to regain leadership, following the downside remains the safer short-term approach.
