AUD/CHF The price will goes with our direction 0.67707
Note: this is not investment advise,This is for educational purpose only, this is just my opinion , i do this analysis in demo account, you can't make money or loss money through my opinion.
Longtermtrading

Is This a Coincidence?Bitcoin, if you still remember my yesterday's post about bitcoin, this is once again coming through and yesterday's candle has the alignment with our yesterday's analysis. The price is coming very close with the golden pocket zone around the $7000 region. And I really think the dead cat bounce will occur at this area when the price reach the current support level. But, the REAL key support will be around the 78.6 fib retracement levels which is becoming the last fibonacci levels of confluence.
Looking at the 78.6 fib level, which is becoming the key support, we must see and extend the price action that occur at this rate of support. we have known that the price is having confluence with the previous key and critical bounce in the market.
It has the confluence with the broken resistance on October 2017 and with the broken support at November 2018. Just like what we know, the first resistance is the first time the price start the up trend rally on 2017 and the second confluence, is the first time the levels confirm the down trend back at 2018.
Is that a coincidence? There is no way such as coincidence in the market. If we see this from the psychological factor, Current period will be a good period for bitcoin to show the world and the stakeholders that bitcoin is worth to be aligned with another safe haven instrument. Beside, the adoption that happen recently, this will be a good consolidation phase for bitcoin. I don't see current potential down trend as the "real" down trend, I see it more like a good consolidation during the huge up trend upcoming.
I don't care if the price may touch the $6000, $5000 or even $2000. As long as it has the adoption of the blockchain, I will keep doing the dollar cost averaging. Because Blockchain will become the future of all financial aspects in this world.

A Simple Trading Guide to Blue Chip Stocks [symbol="NYSE:AXP"]NYHey All,
I hope everyone is flying with trading profits this year. In this video, we will go over some simple strategies for potential long term profits with the help of some simple moving day averages.
No complex graphs. No algorithms. No college degree needed.
If you have any advice for me and how I present my videos, please leave a comment down below!

DJIA Long Cycle: In Fifth of Fifth Primary EWChart says all; a few salients:
Long Trend: The entire movement of late 90's up to 2009 was a giant Zig-Zag correction of the 90's Bull Market. The 2000 dot-com bubble burst provoked a mighty B wave lasting several years, that ultimately culminated in the 2008/09 crash, when prices fell below 2000 levels in a great 'h'. The current cycle began 09 March 2009 with the initiation of a long string of Minor and Intermediate EWs, interspersed with ABC corrections and more recently, another great zig-zag that began in Feb 2018. This pattern is not yet complete; we are enjoying a 3-Drives end game run to ATH, now in the second Drive. A minor ABC in November to test lower TL of wedge should provoke the final Drive to the Top, culminating in Jan 2020 where the long TL intersects the rising wedge from 2018.
In near-term: We have Bearish divergence between indexes now even as go-go stocks eke out new marginal ATHs, most of the market is already declining; breadth is poor and volume quite low, on Monday 28 Oct volume of 1.5k m shares was half normal and the VIX actually increased on a new ATH for SPX; NQ Composite got within four pips of it's ATH, but DOW is still over 300 off its high, and RUT never got close. DJT transports were actually negative, a leading indicator for the broader market, which may have a small incremental gain left, or perhaps not. There are not a lot of buyers up at these stratospheric prices! Certainly no accumulation is taking place here.
Outlook: Uncertainty in Feb/Mar 2020 of an election year with an impeachment ongoing and the disappointment that a finalized bona fide deal with China is years away, if ever, coupled with Fed decision to hold rates to 2% inflation, no more or less, and weak ERs from a sluggish economy will certainly weigh on global financial markets and likely create a rather Bearish mood. Distribution will be protracted and furious.
Concluding Projection: The completion of a Primary ten-year cycle in Jan or Feb 2020 will likely usher in a new Bear market. A Correction of 20-30% is both possible and likely. The Megaphone projects Dow ~20K by mid-2020 to complete the zig-zag pattern, a 7K pip selloff > 26%. As elections near, uncertainty will pass after Nov 2020 and the next Bull cycle might begin in 2021, if the Bear lasts only nine months. A three-year Bear would be a tough trading environment, everyone gets killed from constant whipsawing volatility. If we get a 1929-style correction then a long grinding Bear with persistent erosion of value is quite possible. A Warren administration would be the death knell!
This is just another observation and does not constitute trading advice; seek that from a qualified advisor please, and trade at your own risk! GLTA!

USD-NOK | Long term only!How to spot trend changes and entry points. Yes the trend reversal legs can also be traded.
Not financial advice!


Buy AUDCHF Long term trade.I plan to split position in 3 entry ( with small lot )
#1 Buy now at mkp
buy limit
#2 0.66457
#3 0.65758
S/L red line around 200 pips
T/P open
This is Long term trade.
( swap positive )
This Idea I will not update .I use for recording only and will check again after loss / gain 120 pips.
PS:
If you see in monthly chart will see Lowest value around red line.
so It is interesting to use gird system to eat cashflow pips every 40 pips per zone ( ADR(10) around 45 pips)
so I have another account to set another strategy with this.
I use grid system and split in zone around 40 pips in buy entry only without stoploss and plan money to support hugh drawndown.
if not pls don't trade , This is only idea trade in my strategy with preparation money for support drawndown.
if trade and don't want to wait pls set Stoploss with yr risk.

Breakout Anticipation Longtermif you are on the 4hr , then price might just be retracing as it doesm this analysis can be applied to smaller time frame than the daily.
LOOK LEFT SUPPORT HAS BEEN ESTABLISHED !!!

Bullish Butterfly on the EURJPYA very longterm bullish butterfly is complete on the EURJPY daily chart.
The Potential Reversal Zone is mentioned clearly on the chart. The price tested the zone and reversed at the end of last week. Unfortunately, couldn't open any position as I was busy moving houses.
However, if the price tests the PRZ again, will be opening a long position.
Exactly 3 years ago, in Sep-Oct 2016, the price was in the same area. It played out like this ...
So, the opportunity is huuuuuge... But will only open if the price is back to 116.48.
All the Best... Make a good decision and earn loads of PIPS...

NZDUSD - Upside potential cooking?We are at very interesting levels when it comes to this pair. We are currently retesting the 2015 lows and a good chance to go long – long term. From a technical perspective it looks like quite the appealing trade with substantial support. From a fundamental standpoint though, the Kiwi could find some relief based on dollar weakness and a resolution of the trade war which seems to have no end in sight yet. But with elections coming up next year, trump is feeling the pressure of having to get something tangible for the campaign and with his unsuccessful jabs at the feds, he may just do something unexpected.

How far up will the long term bull run?From an investor's point of view, meaning long term thinking, it's important to give attention to the matter of "when should I be taking profits?"
In my point of view, BTC will likely not have as much energy in it's way up as in the past, for it's major
long term growth pattern can be seen through a log curve.
I personaly have a target on the 70'000 USD zone. But, in case BTC doesn't go so far up, will be taking major profits at around 1000 days from the start of the trend.

Long term GOLDHi fellow tradingviewers,
I am back with another long term view. This time it is on gold. Please remember, that this is not financial advice, i am only showing you guys my view on things and there is no guarantee that this is going to play out.
If you guys like this analyses, please dont forget to leave a Like . and if you have any questions or thoughts let me know below!
Lets get starting:
Daily timeframe:
We are currently breaking out of the bullish wedge on Gold, we bought the retest on the wedge formation and are expecting gains for the coming days (Green arrows). This wedge could in theorie get us past the major resistance zone around 1340/1350. If that resistance would break we can expect the outbreak of a huge cup and handle pattern on the daily timeframe (Blue arrows). which in theorie could get us past the 1420 area. where there is very little resitance that stops the price. Making it possible to gains towards the 1480/1500 area.
Weekly timeframe:
on the weekly timeframe we are seeing the possible forming of a ascending triangle. The ascending triangle would be the next support if the cup and handle pattern and the wedge fail to breakout to the upside. If that pattern would breakout to the upside we could see gains reaching as high as the 1700 region(Red arrows).
On the weekly we are also seeing support on the 200 moving average, which usually is a pretty strong indicator that we are in a bullish trend.
Remember we still have a long way to go before any of these thing are going to play out. And news or sudden sentiment changes can change everything. But i thought i would give it a share and ask you guys, what do you think about this?
I would have liked to upload 2 different charts on tradingview but since i am not PRO yet this will have to do the job. I hope that it is clear enough and if not send me your questions.
If you have any questions or remarks please leave them in the comment section below, or send @blockchainuser a DM on instagram!

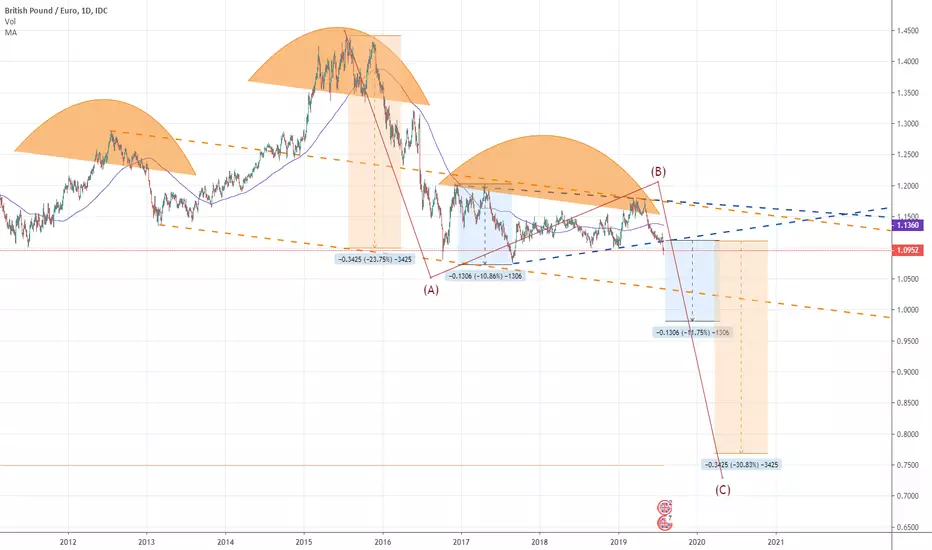
Much more weakness is likely in GBPEURTwo chart patterns are in play right now for FX_IDC:GBPEUR on a long term scale. First of all, GBPEUR is breaking out from triangle, with target at around 0.98. And further there is an option that GBPEUR is forming head &shoulders pattern. H&S would be confirmed, if currency pair breaks neckline around 1, then pound may drop as far as to 0.75-0.80 region.
As it is long term pattern, be ready that this scenario may play out over next few years, and not something to expect in next few months. However, with brexit deadline getting closer, more volatility certainly is likely.
As of now, short with stop at around 1.125 may be attempted for more downside.
TWLO LongTWLO
Entry : 83.80
Target : 115 +
Holding Period : 5 to 8 months
Stop Loss: 68 ishh... but I would keep it wider for now.

IOTABTC BINANCE IH&SIOTABTC is forming an inverted head and shoulder for long term holders. Please note that this may change based on mother BTC coin.
Best time to enter IOTA is near right shoulder and expect a breakout near the neckline with 35% profit reaching target 7400- 7600 sats

Xrp/Btc Matters More, To Trade Xrp against any market.Comparing this chart Xrp/usd to Xrp/btc the Xrp/btc pair Xrp is retracing back to its all-time lows, so I will not be expecting and major surges on the Xrp/usd pair not unless there is a change in fundamentals and momentum on the Xrp/btc pair. Against the dollar (Usd) or tether (usdt) Xrp did hit its all-time high, according to my opinion we will have another ath, that is if the price of bitcoin will be above $20,000 and Xrp will be above 22048 satoshi against bitcoin.
Xrp Entry points - $0.16 – 0.457
Xrp Exit point – exit when Xrp hits 16022-2204 8 satoshi against bitcoin.

EURCHF Distribution In Progress And About To End?Trading Timeframe: H4 and Daily
Trend: Range
Current Position: Distribution
Aim: Imbalances spotted and aim to short to expect the ranging situation comes to an end to welcome EURCHF downtrend toward the mentioned area.
Action: Short
Entry: Right now/once market open
Stop Loss: around 1.48100
Target Profit: 1.11050

Near Buy Zone and Divergence Blinking tooThere is possibility of temporary retracement to suggested Buy Zone 76.35 to 75.90
wait for retracement, until the price tests the zone, whether approaching, touching or entering the zone.
then set buy orders based on price action, candlestick confirmation is needed
long term opportunity with this clear data is not happening all the time...

AUDUSD at demand zone, Buy On dipBuy on retracement scenario
price already at demand zone
LONG TERM BUY
goodluck!!!

TESLA long term rangesTesla is considered to be a volatile stock and it's showing just that when it gets the chance. Even so, it does tend to range and respect certain levels; rallying impressively but falling hard as well.
The latest decline started near the area of the all-time highs around $380-$390, peak levels that were visited 4 times during the last 2 years.
This time, the priced went as low as $231, that is a massive drop of $148 which is nothing new for this asset.
At a first glance, the strong support line and bottom part off the latest range of $250 seems to have been broken.
Taking into account that the company had their Q1 earnings report released recently so it might be worth waiting a couple of days before we get a confirmation of a real $250 break.
The asset is definitely under pressure as it reported a loss of $702 million in Q1 but we could see a strong rebound above $250 in the next couple of weeks.
Additionally, it could be noted that the bad Q1 report was in a way priced in as it was no secret that Tesla struggled with deliveries and would also report a loss.
Regardless, the spike to $231 happened and here we are now just above it.
Based on all this information, as well as the patterns of rallies/declines and general price behavior within these ranges we could be looking at a slow but steady attempt for another $100 rally which could take the price closer to $300-$320 again. That level was kind of the base for Tesla in the last 2 years and was broken only temporarily for a few weeks or so last year in April and October.

Bitcoin - ALL TIME LOW CONFIRMED ! 100 MA WEEKLYLets get straight to the point, bitcoin is going down in the short term however so i'm here to prepare you for the best short you've had in your lifetime !
One of the first support lines of bitcoins big bull market surge is the 100 MA line which acted as support throughout the whole bull market, once bitcoin broke down below it you can clearly see it acted as resistance multiple times. PERFECT EXAMPLE OF BITCOIN BEING IN A BEAR MARKET!
Right now bitcoin is moving up to the 100 MA line again and it is going to have to choose to break it and end the bull market (which is very improbable looking at all the bearish signs and signs of bitcoin being overbought and topped out at this point) or test it, fail and go down finally testing the 350 MA this time and using that support to break the 100 MA in the next bull rally.
Please like & share if you liked this so i can keep making these TA's and trading setups for you FOR FREE :) !

USDZAR SWING BUY After a previous entry ive entered USDZAR again
The Fibo on the side which highlights the 30% level highlights when i should move my SL to BE being a swing trader i can hold trades for up to a month. so I've formulated a new strategy to move my SL to BE when a trade has moved 30% of the PIPs for TP

A trading opportunity to buy in EURCADMidterm forecast:
While the price is above the support 1.4750, beginning of uptrend is expected.
We make sure when the resistance at 1.5360 breaks.
If the support at 1.4750 is broken, the short-term forecast -beginning of uptrend- will be invalid.
Technical analysis:
The RSI support #1 at 48 is broken, so the probability of beginning of uptrend is decreased.
While the RSI uptrend #2 is not broken, bullish wave in price would continue.
A peak is formed in daily chart at 1.5215 on 03/22/2019, so more losses to support(s) 1.4915, 1.4820 and minimum to Major Support (1.4750) is expected.
Price is below WEMA21, if price rises more, this line can act as dynamic resistance against more gains.
Relative strength index (RSI) is.
Trading suggestion:
. There is a possibility of temporary retracement to suggested support zone (1.4820 to 1.4860). if so, traders can set orders based on Price Action and expect to reach short-term targets.
Beginning of entry zone (1.4820)
Ending of entry zone (1.4860)
Entry signal:
Signal to enter the market occurs when the price comes to " Buy zone " then forms one of the reversal patterns, whether " Bullish Engulfing ", " Hammer " or " Valley " in other words,
NO entry signal when the price comes to the zone BUT after any of the reversal patterns is formed in the zone.
To learn more about " Entry signal " and the special version of our " Price Action " strategy FOLLOW our lessons:
Take Profits:
TP1= @ 1.4915
TP1= @ 1.5010
TP1= @ 1.5115
TP1= @ 1.5195
TP1= @ 1.5285
TP1= @ 1.5360
TP1= @ 1.5450
TP1= @ 1.5640
TP1= @ 1.6150
TP1= Free
