Bitcoin Weekly Downtrend Liquidity Zones RSI WeaknessOn the BTCUSDT weekly timeframe, the market structure clearly shows a continuation of the downtrend with consistent lower lows. The RSI is gradually moving toward oversold territory, signaling sustained weakness rather than a reversal. At the same time, selling liquidity is slowly drying out, which often precedes deeper liquidity hunts before any meaningful recovery.
From a liquidity perspective, the 70K zone has already been cleared. The next major liquidity pool is visible around 60K, followed by a deeper zone near 44K. In an extreme macro scenario such as a recession or global risk-off event, Bitcoin could revisit the 30K region, with a very low-probability extension toward 18K–19K. These levels are not predictions but possible downside liquidity targets based on historical price behavior.
At this stage, price discovery remains bearish, and there is no confirmation of trend reversal. A sustainable upside move is unlikely without a strong weekly candle close reclaiming key resistance levels. Until that confirmation appears, expectations should remain conservative.
From a long-term accumulation perspective, the 50K–40K range stands out as a high-probability cost-averaging zone, provided the market stabilizes within this region. Patience is critical, as early entries without weekly confirmation carry higher risk.
This bearish outlook is not sudden. The downside scenario was highlighted earlier, starting from late September and October, and the market continues to respect that structure. The coming weeks will be crucial in determining where the next major higher-timeframe support forms.
Lowerlow

Critical Macro Signs Seen on SPOT, warrant attentionSpotify has been a fan favorite for the last few years. I mean who wouldn't fall in love with it. It has had roughly 850% gains since Feb 2023.
And so its recent downtrend requires attention. Traders and investors alike are wondering if this is buy the Dip situation with many probably been doing so. But you have to take the time and ask yourself am i acting on emotion such as Fear of Missing Out or am i acting on evidence, actual signs that indicate it really is Buy the Dip situ.
Many people from hedge fund guys to influencers will say things, signals will be called. But the attention should be put on the facts in the charts. We should consider what price action is telling us and if there are clues in certain indicators or not.
Since we have been in a Uptrend for roughly 2 - 3 years, we have to consider SPOT to have experienced a Bull run. With recent downtrend, we have to then consider whether or not the Bull trend is INTACT or if its being invalidated or in other words if the current downtrend shows signs that Trend is reversing. If signs of reversal are present it may not be a Buy the dip situation.
IN trading and Investing, we must remove Emotion, Humble ourselves and consider all scenarios at all times.
Okay so we will look into the Macro picture of price action. Ill start with the 1 Month timeframe. Note that each candle is 1 Months average of opening/closing price. Macro analysis is a powerful tool especially to determine large picture, long duration trends like Bull runs or bear markets.
June 2025 we reached a high of roughly $770. But the Month after (July) We experienced extreme sell off indicated by the Engulfing Bearish candle. Which on the 1 Month is an alarming sign. (This could be the top)
Followed by 3 Months of attempts to get back on track of the trend. Which met with continued SELL pressure indicated by the Large Upper wicks in August & Sept.
Then from October we continued to sell off. Fast forward to this current month of January. We are on the verge of printing another Large Body Bearish Candle. Which warrant caution.
Candle bodies and its size indicate the strength of that candles move and may even help determine price moves in the future. Incase of Monthly candles, a large candle print can make impacting future moves more probable. Something to consider.
We are also in the process of breaking down below a Horizontal Support line where Jan to March 2025 we maintained Support or showed Buy pressure on.
This may be a low that could invalidate our Bull run.
Our current Monthly candle is also in a crucial Support zone depicted by yellow zone.
There are 2 Bull Support Trend lines depicted by green lines. Where we can attempt to test Support. We are currently doing so on the first line.
If we fail to hold here, we would test Support at the lower order of the Yellow zone.
If we fail to hold here, we'd test Support at the Lower green line.
And if this fails we would attempt Support at the Resistance Turned Support line at around $300.00.
We have 2 days in the Month. If we can have Buy pressure come in and have this months candle wick back above the Support line we are breaking. That would be a solid sign for bullish case. But dont think its a probable case.
We would need to see signs of confirming Support if we are too continue the Bull run.
Till then SPOT warrants caution and in my opinion definitely not a Buy the Dip situation at this moment.
We need to show patience in the markets if we want to be successful and not be on the end of a losing position.
Follow me and continue to observe SPOT. Look to more updates to the analysis.

$Btc Turning PointBitcoin has bounced from its lower low and is now pressing toward the upper wall, but here’s the catch — it still hasn’t printed a higher high. The market seems to be preparing for a potential higher low formation, yet the RSI slipping from the overbought zone hints at profit-taking.
What does this mean? If CRYPTOCAP:BTC confirms a new lower high and holds, we could witness a push upward as buyers regain control. But if that setup fails and a fresh lower low forms, a clear bearish phase might kick in. The coming sessions will reveal whether Bitcoin is setting up for a healthy continuation or a deeper downturn.
Keep a close watch — this zone could define the next big move.
#Bitcoin #CryptoMarket #BTCAnalysis #TradingView

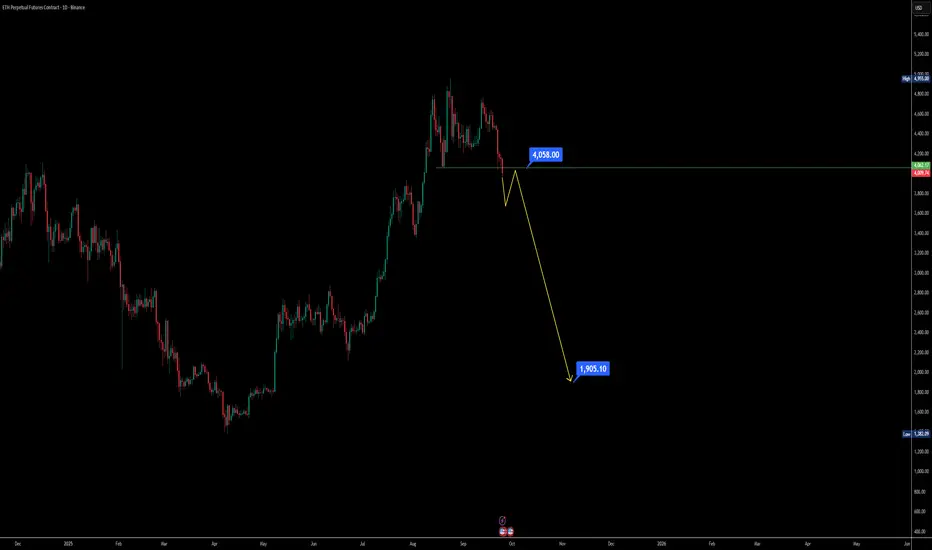
Ethereum Daily Chart Distribution Phase Signals huge dumpIf you’ve been tracking Ethereum on the daily chart, the structure is starting to look heavy — and not in a bullish way. Let’s break this down step by step so it’s easy to follow 👇
Support lost: ETH has already broken its key support zone around $4060, which previously acted as a higher low. Now, the recent dip is printing a new lower low, shifting market sentiment.
Daily close levels matter: If the daily candle closes below $4000, it confirms weakness and opens doors for a further sell-off.
Possible head and shoulders: A pullback toward the $4100 region could simply build the right shoulder of a bearish head and shoulder pattern. The structure matches what we saw earlier on the left shoulder.
Bearish momentum risk: If ETH fails to hold above $4000 after that pullback, we could be looking at extended downside — even a sharp fall toward the $2000 zone based on historical dump patterns.
Market behavior reminder: Over the past two years, whenever ETH started a distribution breakdown, the drop was often fast and violent. That’s why caution is key here.
📌 Key Takeaway: Ethereum is at a make-or-break daily level. Watch $4000 closely — losing this level could accelerate a bearish breakdown. Short-term traders may look for opportunities on the pullback, while long-term holders need to stay cautious of the possible head and shoulders pattern forming.
Bitcoin Bearish Path Toward 110K📉 BTC/USDT Analysis
The market has been under continuous pressure after the earlier bearish divergence played out, leading to sustained downside momentum. Right now, Bitcoin is at a decisive zone, and three possible scenarios can unfold:
1️⃣ Dump Continuation:
Price could extend its fall toward the 110K area. From there, a small bounce toward 115K is possible before further moves unfold.
2️⃣ Rejection at 115K:
If the bounce to 115K faces rejection, BTC will likely form a new higher low and then resume its downward trend.
3️⃣ Break Below 107K:
If the crucial 107K support is lost, this confirms a new lower low, opening the path for a sharper correction, possibly down to the 90K zone.
🔎 Current Outlook:
The bearish pressure is dominant, and a dump looks likely in the immediate short term (within the next 1–2 days). The coming sessions will decide whether Bitcoin holds higher support or sets a new lower low.
⚠️ Key Levels to Watch:
Support: 110K / 107K
Resistance: 115K
Downside Target if breakdown confirms: 90K

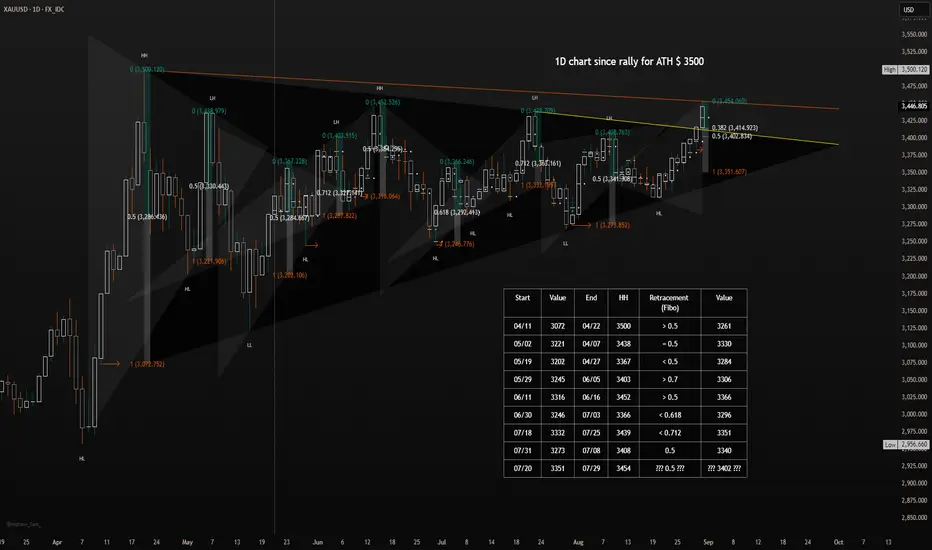
The day after a new higher highHello fellow traders! 👋
It seems like so many times again, the market went in a different direction than you may have expected. 🤷♀️
After multiple positive words from members of the Fed, a rate cut is likely to happen and is getting priced in. 📉 On Friday, July 29, we got some good economic data from the U.S., but the market acted differently. 🤔 Why is this? The data wasn't worse than expected; it was as expected. The market is taking this as a sign—a sign for higher prices. But, and this is a fact, many retail traders aren't. 😥
It's not about confusion; it's about the market (and us as traders) not having priced in all the possibilities. 🤯
The truth is, they are lying to you. They (the government) are telling people and the news that things are about to get fixed and will be good, but they aren't. 🤥 If you think the data we got on Friday is true, think again. Look at the data; you'll see the forecast was as expected, but in reality, the numbers are better than before. Do you get it? The obvious conclusion isn't always the real one. 💡 In my opinion, the U.S. economic data everyone is talking about is much better than many people think because the news is written to make it seem bad. 😒 You can think whatever you want, of course!
Price went up, not down, and a rally was chased. Many stop-loss orders were hit and turned into a cascade of higher prices. 📈 Institutions are buying gold, yes, because the dollar is cheap (?), and a rate cut is coming with a very high probability. 💰 So they buy gold, which results in many people's (and that's a good thing) stop-loss orders being executed. 👏 (sorry)
I've seen it in the past, and you can see it too if you look at my data table. Whenever a very high gold price was reached, a correction followed. 📉
I expect a correction on Monday or Tuesday, and this correction will lead to at least $3418, which is the 0.382 Fibonacci level. In my view, $3403 is the 0.5 level and more realistic. If you look at the table I put in the image, you can see that the day after a high price like we had today, the correction was always at the 0.5 Fibonacci level or more! 📊
Don't think it won't happen; they will trap you in any way they can, such as with fakeouts... 😈
Believe in the market and its structure because, until now, there has never been a day without a correction after a rally like this! 💪
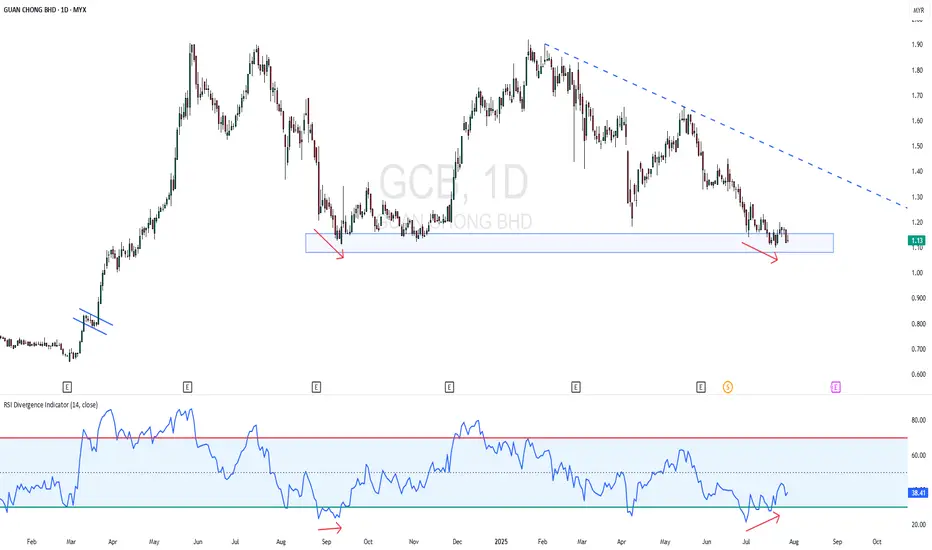
GCB - Near 52 Week LowGCB - CURRENT PRICE : RM1.13
GCB is in a downtrend as the highs and lows both getting low. The stock is near 52 Week Low. However, the stock may rebound higher for short term as there is a bullish divergence in RSI. Price is making lower low while RSI making higher low. Rising in RSI reading indicating there is slightly bullish momentum picking up. Aggressive trader may anticipate for buying with tight stop loss level.
ENTRY PRICE : RM1.13
TARGET : RM1.20 (+6.30%)
SUPPORT : RM1.10 (-2.65)
BTCUSD 1DI invite you to look at the current situation example, where you can see a lower high formation that has been formed, which could potentially lead to a larger price correction and the formation of a lower low in one of the 3 potentially designated locations.

Stock is in DownTrend but ..4013 CMP 254.20 (15-06-2025)
Stock is in DownTrend but it Beautifully hit Channel
Bottom & Bounced.
Currently at a Good Support level.
Now the Immediate Resistance is around 256 - 257
& then around 270.
Crossing this level & Sustaining on Monthly basis would
lead it towards 283 - 285 initially.
However, should not break 253 - 254.

HIGHER HIGHS LOWER LOWSMarket structure is making lower highs and lower lows, indicating a short fall if hitting the trending line and also confirming breakout and retest. Keep a watch.
Lower Locked at 58.40 today.
Lower Locked at 58.40 today.
58 is an Important Support but
if it is not respected we may witness
price around 48.
as mentioned earlier, it should stay above 36
otherwise extreme selling cab be seen.

Alert:Maruti on Edge as Lower Highs Signal Looming Support breakWhen a stock 📉 consistently makes lower highs, it signals a weakening trend, with sellers taking control. Maruti is at major support suggests a critical level where the stock might break down further, potentially accelerating the decline 🚨. Investors watch these levels closely for exit signals, as breaking support can lead to sharp price drops 📉, driven by increased selling pressure and waning confidence in the stock's prospects. However, it may also bounce bank to make another lower low, continuing the bearish trend.
Daily close above 12500 is the key level to watch as it will tell us where the stock is headed.
Disclaimer: All ideas are my personal views and not financial advise. I do not have any Telegram channel nor do I sell any courses.

AUDUSD - To sell or not to sellHaving just broken a 4H high i expect price to retrace back down to form the next LH to then continue bullish. Depending on how price plays out i may take some counter trend sells into buys. Will look for a clean 5M market shift bearish then a 1M entry.

$EURGBP | Sell Trade | Market Exec |Technical Confluences:
Price action is bounced off an Interest Zone and created a newer low
Price is breaking through a support trendline
To note, Stochastics is moving into Oversold conditions but fundamentally, there is support for OANDA:EURGBP to be weaker
Fundamental Confluences:
This FX pair is a trade-related pair and normally doesn't move much against one another unless there is a change in fiscal or monetary front
In this sense, we got a gauge of how both central banks, ECB and BOE stance are. ECB is taking on a data dependent stance and is trying to resist cutting interest rates while BOE sent out a hawkish note the other day that majority of them do not want to cut rates
Naturally from a yield perspective, holding GBP compared to EUR is more attractive and this is what we are aiming for.
-----
Will be taking on a short OANDA:EURGBP position when market reopens on Monday.
This trade may take some time to complete as it there is normally not much action with this pair except during London's trading hours.
-----

Thats two lower highs for NVDA...What is next???
NASDAQ:NVDA NASDAQ:QQQ TVC:VIX
NVDA: A Looming Breakout or Breakdown?
Nvidia (NVDA) has been on a rollercoaster ride lately, with its stock price exhibiting significant volatility. The recent formation of a lower high and a potential lower low suggests a downward trend may be in the works.
A key support level lies around $98, marked by trendline support that held firm on February 21, April 22, and August 5. If NVDA breaches this level, it could signal a short-term reversal of the uptrend.
Analyzing the 30-minute timeframe, we see a recent break below a bearish pennant, indicating further downside potential. If this bearish scenario unfolds, a price target of $85-90 seems plausible.
Interestingly, this price target aligns almost perfectly with NVDA's 200-day Simple Moving Average (SMA). If the stock does indeed reach this level, it could present a compelling buying opportunity.
However, the broader market may face challenges if NVDA's downward trajectory continues. Recent economic data, such as weaker job openings and rising unemployment, suggests a deeper market correction might be on the horizon.
While the Federal Reserve is expected to cut interest rates at its next meeting, a larger-than-expected reduction could trigger market panic.
The next few months promise to be exciting, and this period can offer opportunities for significant wealth creation. For now, I'm waiting on the sidelines, patiently observing the market's dynamics.
Remember, Warren Buffett's recent moves are a testament to the importance of following the market's trends rather than blindly fighting against them.

EURAUD SELL BREAKDOWN!EURAUD overall was in a pretty convincing correction stage. the overall market behavior was showing correction swings or pull backs so i dissected the market until i understood what was happening to then enter sells.

GBP-USDThe price of gbpusd at 1.26700. and it creates a higher high and higher chance of creating lower low mention in chart.

CADJPY: Bearish Divergence Warns of Trend Reversal📉 Overview:
CADJPY, previously bullish, now shows bearish divergence on the 1-hour timeframe, forming its first lower high. With a strong 90% short market sentiment, there is significant support for an anticipated bearish reversal.
📊 Technical Analysis:
Bearish divergence and the formation of a lower high suggest a potential shift from bullish to bearish.
📈 Market Sentiment:
At 90% short sentiment, substantial support for the expected bearish reversal is evident.
📉 Trade Strategy:
Consider short positions, aligning with the bearish signals, and anticipate further downward movement.
🛑 Risk Management:
Mitigate risks with effective stop-loss orders to safeguard capital.
📈 Conclusion:
CADJPY offers a concise opportunity for a bearish trend reversal, supported by bearish divergence and strong market sentiment. Monitor for confirmation and adjust positions accordingly.

XAUUSDXAUUSD is trading in descending channel and printing consistent LLs LHs. Recently the price is broken the important support zone and now retesting the broken level, which is also the 50% Fib retracement level.
If the sell momentum continues the next target could be 2016
What you guys think of this idea?

bearish retest of top rangeThings are moving fast. Too fast.
The last time things moved this fast was before a big blowout.
Looking to get in to a 1x short over the next weeks depending on how chart looks.
Maybe we see a wick up on the next monthly candle and then retrace?
Good luck everyone, good luck to the people who are buying this to hold for longer. It's not back sorry this is not how bull markets start or are being made, .. this is the first lower high and everyone who is still holding this ponzi or still desperate enough to trade this day by day and follow altponzis gets exited.
If youre in a rush to make money youre in a rush to lose money.
patient.

EURJPYSELL IDEANext trade where i will look for an opportunity for sell,we see a change in structure,making lh an a retest,waiting for a confirmation and break below 156.390
Happy trading everyone!

GBPJPY SHORT IDEASo this would be my next setup for this pair,going short if it breaks the low,chasing 650 pips profit,but take your own decision how long do u want to keep trade going because on daily we can spot a big rejection half move down,where price could possibly reverse,take partials or keep your sl above last hi.Happy trading everyone,september was extremly choppy,lets see how will october be.

Virgin Galactic New All Time Lows & Price Decline TargetsHi Guys! This is a Technical Analysis on Virgin Galactic Holdings (SPCE) on the 3 Day Timeframe.
We have been on a continual PRICE DECLINE since our MAJOR REJECTION, June 22, 2023.
Its depicted by the Massive ENGULFING BEAR Candle.
This area was also a Major RESISTANCE area with convergence of the RED and PURPLE lines.
Note that Previous times we've had touch points on the PURPLE Upper Trendline of the Channel we've had massive PRICE DECLINES.
1st one = 53%
2nd one = 60%
3rd one = 54%
At the time of my previous posted Idea, we had closed below the BLACK SUPPORT trendline. But i mentioned we needed "Confirmation". Well its absolutely CONFIRMED, and thus continual price decline. (Check out my previous idea on SPCE BELOW for more context.)
We have also reached 2 of our 3 TARGETS mentioned on my previous idea, with continual BEARISH momentum therefore the update.
We are Currently in the process of printing a New Lower Low for SPCE, with the break of our MAJOR SUPPORT RED Dashed line.
Note also: Since this is a 3 day chart, we close the candle on the 17th of August. We also would need atleast 1 more candle after that if not more, that confirms the BREAK of SUPPORT.
With our current momentum i believe we may have further DECLINE.
1st Target = BLUE Support Trendline
2nd Target = PURPLE Lower Support Trendline of Channel
For Awareness -> It is possible we bounce from the BLUE line, a potential retracement being the BLACK trendline we initially broke out of. Keep an eye for Confirmation of Support.
But I still do think its PROBABLE we touch the PURPLE Channel as our Final Target, and potential BOTTOM. Whether right away or after the bounce play mentioned above, hard to tell currently.
I like this area because it would Strengthen the BULLISH DIVERGENCE currently forming. (Provided the signs of BULLISH DIvergence remain in our indicators).
I see this as a necessary capitulatory move, flushing out weak hands and setting out a Bottom Base.
At the end of each PRICE DECLINE, when we interact with the PURPLE Lower Trendline of the Channel.
It leads to a significant bounce back up to the Upper Trendline of Channel.
I won't highlight the % gains. I want you to Measure them for yourself but there MASSIVE gains. Keep that in mind.
On the RSI, we've been REJECTED.
Now we are moving towards the lower Support line that coincides with the BULLISH DIVERGENCE Play.
We need to maintain SUPPORT here.
Furthermore, for our BULLISH DIVERGENCE to play out we need to BREAK ABOVE Rejection zone.
STOCH RSI is currently Below the 20 level.
We don't want to be here for too long.
We need to see a BULLISH cross above the 20 level.
It moving towards the direction of the 80 level.
The BULLISH cross should occur after touching one of the 2 TARGETS. Just keep in mind, if we are going to go to the PURPLE line, we may be staying down here for weeks to couple months. Keep an eye
Notice also our VOLUME -> Our volume has been picking up since RJECTION. Which validates this Downtrend. Was giving us some hints before New Lows.
Just food for thought: As a trader always have your options open and be flexible. We do not have crystal balls of what price will do. Being unpredictable, markets do what they want based on human psychology so never fixate on one target. Keep an open mind to different possibilities.
__________________________________________________________________________________
Thank you for taking the time to read my analysis. Hope it helped keep you informed. Please do support my ideas by boosting, following me and commenting. Thanks again.
***Read my Previous Analysis BELOW From 08/06/23 For More Context!
Stay tuned for more updates on SPCEin the near future.
If you have any questions, do reach out. Thank you again.
DISCLAIMER: This is not financial advice, i am not a financial advisor. The thoughts expressed in the posts are my opinion and for educational purposes. Do not use my ideas for the basis of your trading strategy, make sure to work out your own strategy and when trading always spend majority of your time on risk management strategy.
