2nd Crypto purchase...Since I've joined the 'Crypto Family' lol, I've been doing my research. Since I've missed my chance to buy bitcoin when it was really cheap i went looking for alt coins. I've already bought into Chainlink, but now my second purchase is XLM, the Stellar Lumen. Unlike, COINBASE:XRPUSD , XLM target audience is different. One of the founder of XRP, is the founder of XLM. XRP sell alot of Ripple to banks and in my eye's it more centralized. XLM targets developing countries and provides a low cost fee transaction between currencies and doesn't aim to be profitable... ha Yeah right. So whilst XRP is being sold off to banks, XLM is just providing a service and setting a goal to being able to help the people more than making money. May be the new Western Union one day, you may never know. I just know that i'll be purchasing more crypto with the profits from forex :)
Lumens

Lumens Starting Wave 3. XLMUSD Yes, after a very protracted correction, we now do have Wave 1 and 2 confirmed. This is in time for the beginning phases of Wave 3. Once again, a bit early to call Fib targets, I always like to see at least one Sub Wave 3 completed before I do that. This should be seen soon, because fractals never lie. Not financial advice - do your own research.

XLMUSD A Move Upto $0.115 Is Expected In Next Few DaysHey, friends hope you are well and welcome the new update on Stellar.
The price action of Stellar has started the completion of handle and after this completion, the formation of Inverse Cup & Handle pattern will be completed. The XLM has also a strong price level resistance at $0.115. Therefore the rally can be up to this level.
On daily chart the price action of XLM was moving in a down channel. Recently the price action broke out the resistance of this channel. But the volume is very low. Therefore the price action is retesting the previous resistance as support. In the meanwhile, the priceline of Stellar has also crossed up exponential moving averages with the time period of 10 and 21. And EMA 10 is also crossing up the EMA 21. Now these EMAs and the bull cross between them can be helpful for the priceline to start the next rally to the up side.
On the same daily chart it can be observed that previously the priceine of Lumens broke down the simple moving averages with the time period of 25, 50, 100 and 200. Now the price action has broken out the 25 SMA and moving with 200 SMA. The SMA 50 is also moving down to form a death cross with 200 simple moving average that can be coz of more sell off.
On the long term weekly chart, the price action of Lumens is like to have a very nice bounce from the support of a rising wedge pattern. Here the support of 50 SMA can be seen exactly at the same level where the XLM has the support of wedge. The 25 simple moving average is moving up to form a bull cross with 100 SMA and this bull cross is the reason that the sell off is not getting increased due to upcoming death cross between 50 SMA and 200 simple moving average on daily chart. If we take a look at the MACD indicator then it has started turning bullish. The stochastic oscillator has also entered in oversold zone. Now if the stochastic will also give bull cross from here the price action can turn strong bullish. Then we can expect the rally in next few days upto the resistance of rising wedge. This resistance is at almost $0.115.
Conclusion:
The price action has very good supports from daily to weeky chart. However the breakout from the channel on daily chart is not backed by the strong volume. Therefore the price action is re-testing the previous resistance as support. Incase of failure in re-testing the price action may re-enter in previous channel. However sofar I am expecting a rally upto $0.115 in next few days.


XLM An inverse Cup & Handle formation at the support of wedgeHey, friends hope you are well and welcome the new update on Stellar.
On long term weekly chart the priceline is still at the support of rising wedge and every bearish candle stick is appearing smaller than previous bearish candle, that is clear indication that the sellers are getting weaker. The 50 simple moving average is also working as strong support below the candle sticks and the support of wedge.
The price action of Stellar has broken down all SMAs with the time period of 25, 50, 100 and 200 and now likely to consolidate with 200 simple moving average. The 50 SMA has formed bear cross with 100 SMA and moving more down to form death cross with 200 SMA.
The priceline of XLM is likely to complete the handle of the Cup & Handle pattern. The resistance of the Cup is at $0.067. During the completion of handle we can expect an upward move but after completion a rally to the down side can be started. The price action of XLM also has price level resistance at $0.115.
On daily chart the price action is moving in down channel. In moon phases indicator new dark moon is appeared above support of channel and new full moon is at the resistance. The volume profile is showing less interest of traders from resistance to support of channel and the point of control of volume profile is also at a big distance from resistance of channel.
Conclusion:
The priceline is having the very strong support of wedge and 50 SMA. The formation of the inverse Cup & Handle is also a bullish signal. But we should use the 50 SMA on the weekly chart as a stop-loss because if this SMA will be broken down then another rally to the downside can be started. Even though there is an expected death cross between 50 and 200 SMAs on daily chart but the support of 50 simple moving average may work as stronger support than this bearish signal of death cross.

Lumens going skyhigh. XLMUSDAt the beginning of 5th Wave Impulse here. Fibonacci levels for goals and expected time for completion. Invalidated if we drop below start of fractal. I will be watching this space carefully and modifying goals, as the market action unfolds.

Bullish on Lumens here. XLMUSDBeginning to sound like a broken record here. Wave 3 of 5 is here and we are up! Cleared the triangle and now on the final stretch before the big consolidation

Stellar We saw a 30% correction from the high. XLMBTC has now formed a large global falling wedge. RSI - Oversold. I see resistance near the upper line of resistance of this wedge, there is also 38.2% Fibonacci
Now we are on the strong global support zone
Best regards EXCAVO


[$XLM] Stellar Lumens will be the next SpaceX Dragon crew!Denelle Dixon , PDG Of Stellar Development Foundation (SDF) announced 3 big focus for Stellar future:
- Strengthening Stellar's authority
The SDF intends to focus initially on the solidity and user-friendliness of the $XLM. On the one hand, it wants to focus on the tools that developers and others need, in order to bring more anchors to the ecosystem and help all network participants with use cases.
"We need to...make sure Stellar can handle all the growth that these use cases can offer. So we've been focusing on scalability." said the Director of the SDF
- Gaining the trust of regulators and industry players in the blockchain industry
Denelle says that in 2020, the SDF will also focus on communication, so as to build trust in the network.
- Developing sustainable use cases
Third, the SDF plans to build its portfolio this year. The CEO announces that the launch will take place in the spring. She also announces that special attention will be paid to all participants in the Stellar ecosystem who create interesting use cases. The aim will be to develop more sustainable use cases.
It sounds really marketing after all that years developping this protocole.
We'ill what's next !
On a technical point of view, it's a beauty , extracted from trading book !
Breakout with a slow correction leading to retest the previous resistance who turned support.
Making a higher low and printing a new cycle after successive lower high => Bullish trend
EMA 100 & EMA 200 act as support and perfect bullish continuation
Aiming to the next level ! Slellar has a rocket as a profil picture , so do what you need to do!
Stay Safe, Trade Safe,
PEACE
NicoDonCrypto

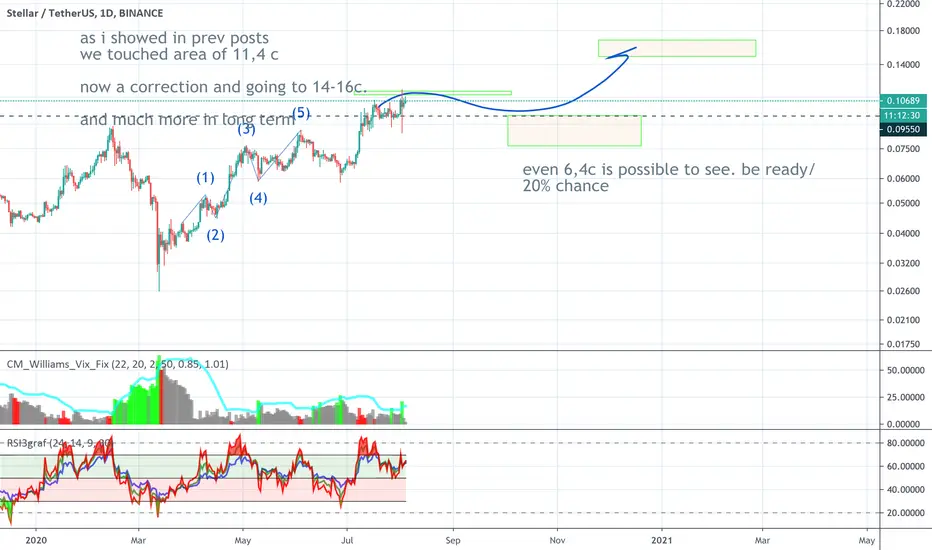
xlm mid term ideaLets see a correction to 8-9 cnt
or even 6,5cent
and then a 14-16c area.
Cheers
Be rich please
XLMUSD to be bullishXLM broke out of upside continuation, kind of a chase, but there's still a lot of upside to catch
Comment, LIKE and Follow

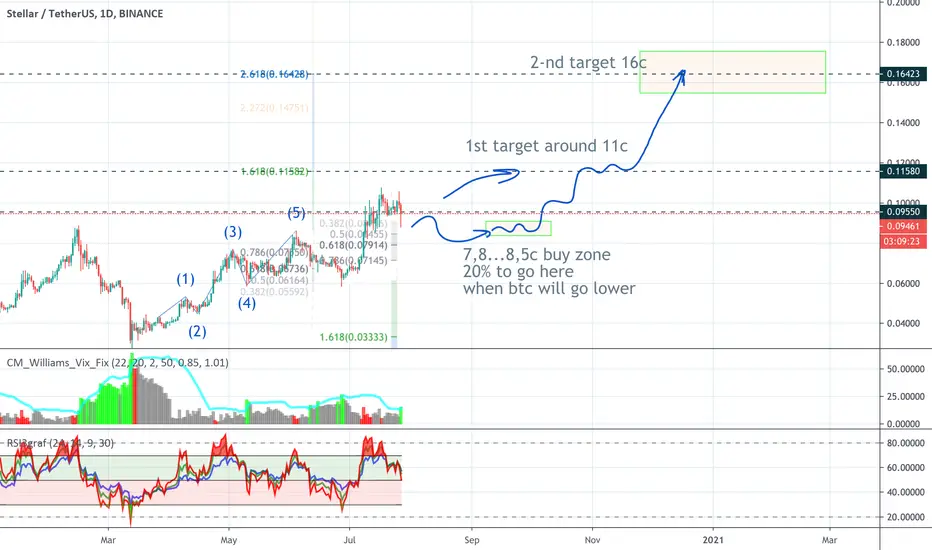
XLM Upgrade but the same idea)) So as we can see nthng changed.
Still we are going up through correction.
Keep your i on the first prize.
BTC will show us a dirrection.

XLM The same idea as previous So. News was hot. Btc went higher as expected. So thats why i wrote in small cap alts @warning@ and @waiting for news@
So thats it! news is. We will se high price. and a correction on btc. Then alts sale. Be ready to Buy.


STELLAR LUMENS ✅ Can XLM Rally after a Rejection at Resistance?💬 Stellar (XLMUSDT) recently got rejected at resistance. Stellar has some interesting ideas in the works, like a "Turing complete" contract proposal, but generally speaking, large-cap cryptos have been yawn-inducing. With that said, we have Stellar on our weekly watchlist for a reason. Let's see if XLM can find support and rally to break away from the large-cap heard (and maybe even lead them to victory).
Hit that 👍 button to show support for the content!
Help the community grow by giving us a follow 🐣
-----
Support:
S1: The S1 S/R flip is the primary support here, being used as a clear pivot point previously. Buying here with a target of R1 or R2 makes a lot of sense. The sort of bullish continuation a rally off of S1 would create is exactly what XLM fans want to see.
Resistance:
R1: The R1 S/R flip is a perfect target for those S1 longs. A move to R1 from S1 keeps the bullish momentum intact and provides a nice chunk of % gains to swing traders.
R2: If the bears can't defend R1, then R2 is a solid target as well. It is likely R2 sees a reaction due to this level being a significant point of resistance in 2019.
-----
Summary:
XLM is starting to look really nice here. Can the bulls continue the momentum, or is this going to be another disappointing and quick rally in a downtrend for Stellar? No one can say, we can only watch how price reacts at levels ourselves. Good luck everyone and ensure to use proper risk mitigation and pre-plan your trade!
Resources:
thecurrencyanalytics.com
✨ Drop a comment asking for an update, we do NEW setups every day! ✨

Stellar Lumens 100% gain potential - Cup and Handle formationA rough formation of a cup and handle is lining up with indicators and over the next month it looks very bullish.
This isn't trading advice.

Long term basing pattern - preparing for a BIG move !!When I first got back in at the beginning 2020 at 560 satoshi I did not realize yet that it was THE bottom for Stellar !
So I got shaken out of it during the "COVICRASH" in march 2020.
Today I realize that XLM is basing out beautifully and preparing for a BIG move (big base - big move). SIDEWAYS PATTERN FOR ALMOST 12 MONTHS !!
OBV is rising consistently.
Volume is solid also... there was a HUGE volume spike on 13th march when I sold !! That was the panic low ! THIS DATE IS NOT CASUAL and means a lot in occult terms ! 13 03 2020.
RSI is rising consistently and is forming a positive divergence to the (sideways moving) price.
It is time to take a position.
This morning I sold 50% of my VET position after a 100% run and bought XLM with the proceeds.
XLM is one of the chosen ones and its future will be stellar !


XLMUSD | An opened alligator mouth is expected for bullish rallyHi friends hope you are well and welcome to the new update on Stellar. Today in this article we will see how the XLM is turning more and more bullish to achieve the highest price ever in its history. But this time the Lumens is also giving some bearish signals on the short-term let's watch the bearish signals first.
Formation of bearish Shark:
On the weekly chart the price action of XLM has completed the formation of bearish Shark pattern. Even though it is difficult to identify that the initial leg is separate or the continuation of the previous movement because the upward movement up to X point Is not as that much long as we can easily declare it as a separate leg. However if we forget the previous movement of the price action and take it from the X point then a complete Shark has been formed. And price action has already visited the potential reversal zone of this Shark. Therefore there is possibility that the priceline will be dropped from here.
Movement in up channel with synchronization with indicators:
On the daily chart the price action of XLM is moving within an up channel. And after hitting the resistance of channel it is likely to drop down again. And the movement within this channel is very much synchronized with the combination of indicators: 1.momentum 2.stochastic 3.directional movement. If we take a closer look at the chart then it can be easily observed whenever the price action reaches at the support of this channel and momentum turns bullish and stochastic also gives bull cross and finally when the positive directional indicator forms a bull cross with the negative directional indicator then the price action turns bullish and reaches up to the resistance of channel. It can be seen in April and also in May 2020. At this time the positive directional indicator is above the negative direction indicator that is the bullish sign. And the ADX is also up that is showing the power of bulls. But now the positive directional indicator is moving down to form bear cross with the negative directional indicator. If this bear cross will be formed then the same ADX will be assigned to the bears and it will be showing the power bearish trend.
Support and resistance levels and moon phases:
After the mid of March 2020 the price action of XLM turned very strong bullish and it broke $0.045 and then $0.06 resistance levels At this time the price action of Lumens has reached at the resistance of $0.08. This resistance level is very strong as on the chart it can be seen that since September 2019 the price action has made several attempts to breakout but so far it is not able to breakout this resistance level. I have also placed the moon phases indicator on this chart. This is very useful indicator to identify the bullish and bearish trends. On the chart we can see there are some full moons and some dark moons. The distance between one moon to another moon is called synodic cycle that is 29.5 days long. The recent dark moon is appeared at the support level of $0.06. That is an indication that it will be difficult for the priceline to break down this support. And the recent full moon it appeared at the resistance level of $0.08. That is showing that the maximum reach of the price action is up to this level. Therefore we need the next dark moon to be appeared above the $0.06 level and the full moon should be appeared more up in order to have break out from $0.08 resistance.
The Stellar is breaking out the falling wedge:
On the weekly chart since January 2019 the price action of Stellar is moving within a falling wedge. I have also placed the volume profile on the complete protection moving within this wedge pattern that is showing the traders interest up to 10 cent. And if we take a closer look at the Bollinger bands then it is moved above the resistance of this wedge pattern. Therefore it was easy for the priceline to cross up the resistance level. Now finally the price action of XLM has crossed up the resistance of the falling wedge. And at this time the new candlestick is opened above this level but the breaking out from this wedge pattern depends where this candlestick will be closed. If it will be completely opened and closed above this level then we will have a successful break out from this pattern. And after breakout if the price action will retest the resistance of this wedge pattern as support then Stellar may drop up to 6 cents before the next rally.
Simple moving averages can form an opened alligator’s mouth:
If we watch the position of the different simple moving averages with the time period of 25, 50, 100 and 200 then we can notice that these SMAs are turning strong bullish. If we take a look back at 2017 chart then it can be observed when the 25 simple moving average crossed up all other simple moving averages and the 200 simple moving average move below on others simple moving averages then a complete opened alligator mouth was formed by these SMAs. That produced more than 4000% strong bullish rally. Same as like that the simple moving averages are forming an opened alligator mouth. At this time the 25 simple moving average is moved above all other simple moving averages then we have 50 SMA but so far the 200 simple moving average is moving above 100 SMA. And these two simple moving averages are moving sideways for the long time. Once the 100 SMA will cross up the 200 SMA then a complete opened alligator mouth will be formed that can produce more powerful bullish divergence.
Repetitive harmonic move:
At the end I would like to recall the repetitive move and that is the formation of bullish BAT pattern on the monthly chart. If you take a look back at 2017 chart then the price action of Stellar formed the same BAT on the weekly chart. And when the Stellar moved up from the potential reversal zone it produced more than 4000% massive gains. This time the BAT is formed on the bigger time period chart. Therefore there is possibility that the priceline will produce more profit than the previous rally. However as per Fibonacci sequence of BAT pattern we can set our buying in sell targets as below:
Buy between: $0.11 to $0.059
Sell between: $0.23 to $0.41
So realistically as per above targets the Lumens can produce up to 600% rally.
Conclusion:
As recently the price action of XLM has reached at the resistance of the channel that is formed on the daily chart and on the weekly chart the new candlestick is just opened above the resistance of the wedge. Therefore there is a possibility that the price action will start a correction rally to retest the resistance of wedge as support of wedge and to hit the support of the channel as well. However after this correction rally a new bullish move is expected.
Note: This idea is education purpose only and not intended to be investment advice, please seek a duly licensed professional and do you own research before any investment.

XLM May 24th - Potential Corrective Descending Triangle SpottedTook another look at my Stellar (XLM) chart, decided to delve into the current pattern we are on as of May 24th. It appears to be a bullish, corrective, and descending triangle. I have mapped out potential range/movement within the purple triangle. It is not yet known if this triangle is 100% descending but it appears to be bullish, or continuing on a bullish trend.
We must wait a day or 2 to find out if the low of the current perceived pattern hits the purple triangle trendline, if so, we have a higher certainty that this pattern is indeed a Descending Triangle. If not, it could mean a number of things depending on where the next low hits. Regardless, it appears to be a bullish pattern.
If it is not truly descending, my next best guess is that it may still be contracting/symmetrical if the next low finishes above the flat purple resistance line, and if it goes below that, then it could be an expanding/reverse symmetrical triangle. My guess is that regardless of what triangle it is, since it is in bullish mode we could potentially expect a quick rise after the triangle completes its pattern, as shown with a green trend line. It is currently unknown what the next pattern may be, as I will need to do some more wave theory to find out where we are on a larger scale as far as longer-term trends are concerned. I assume that whatever comes after this pattern, will cause a quick jump up, met with resistance, and may start working its way down in the coming weeks. I will be working on and updating this chart for the next few weeks as we start to see more data come in. This chart is a continuation of my last XLM chart, linked as related below for reference.
I am waiting to see some death crosses on this chart that appear to be forming, and any golden crosses that occur may give us another clue in the coming weeks. I've also tried to generalize some basic elliot wave structures to come to the conclusion that the current pattern is going sideways and is less easy to pinpoint as a true elliot structure. I could be completely wrong, too. It should be noted that even though the current perceived triangle appears to be bullish, what happens after the green trend line could end up faking out the FOMO with some bear moves. We shall see!
I hope everyone is having a wonderful weekend, enjoy it :)
Thanks for tuning in :) Disclaimer, I am not responsible for any losses incurred while attempting to use my data, I hope this can prove to be some sort of learning tool for some and give insight as to how I personally come up with my own numbers. Take into full consideration this could be a completely bad forecast. Cheers
