$USDJPY Short Position - Target 152 YenUSDJPY seems to be breaking support for positive volume. If it breaks support, it might retrace back down to at least 152 yen. The bollinger bands and the last 24hr volume is telling. As always, none of this is investment or financial advice. Please do your own due diligence and research.
M-forex

USD/JPY, EUR/JPY, CHP/JPY SetupsAll three yen pairs exhibit decent uptrends. However, keep in mind that incoming US data could have a greater impact on USD/JPY over EUR/JPY or CHF/JPY.
Matt Simpson, Market Analyst at City Index

Gold Moves Sideways Ahead of the FED DecisionGold continues to trade within an extremely tight range, even as the USD Index (DXY) stabilises around 99–100. This signals that pressure from the dollar is no longer as dominant as before, while safe-haven flows quietly circulate beneath the surface—especially as global equities soften and sentiment grows cautious ahead of the FED’s rate announcement this month. Everything now hinges on a single question: will the FED deliver its third rate cut of the year? If so, the USD is likely to weaken, and gold could benefit directly and even aggressively from the shift.
On the 1H timeframe, gold remains sideways between 4,210–4,220 after retracing from 4,245–4,260. Notably, recent selling appears to come primarily from short-term profit-taking rather than genuine reversal pressure. The lower FVG zones at 4,185–4,195 and 4,160–4,170 continue to act as liquidity pockets where price may dip to gather momentum before following the prevailing trend. These areas have provided precise reactions in previous sessions and could again serve as springboards should gold pull back deeper.
If gold holds 4,210 and shows a strong bullish response, a retest of 4,245 becomes highly likely, with a potential breakout above 4,260 toward the broader target near 4,285—the key high from November. Conversely, a clean break below 4,210 opens the path for price to drift naturally into the 4,185–4,195 FVG before buyers step in. In the broader structure, the short-term uptrend remains intact; current pullbacks are functioning as liquidity sweeps rather than structural breaks.
With all of this in mind, my bias stays bullish. The 4,185–4,195 region is where I prefer looking for trend-aligned entries instead of chasing price near the 4,245–4,260 resistance, where sellers repeatedly wait. Should the FED deliver the dovish signal the market expects, gold could easily extend its upward trajectory in the sessions ahead.

Bullish momentum to extend?AUD/USD has bounced off the support level, which is a pullback support, and could rise from this level to our target profit.
Entry: 0.6538
Why we like it:
There is a pullback support level.
Stop loss: 0.6502
Why we like it:
There is a pullback support level.
Take profit: 0.6612
Why we like it:
There is a swing high resistance level.
Enjoying your TradingView experience? Review us!
Please be advised that the information presented on TradingView is provided to Vantage (‘Vantage Global Limited’, ‘we’) by a third-party provider (‘Everest Fortune Group’). Please be reminded that you are solely responsible for the trading decisions on your account. There is a very high degree of risk involved in trading. Any information and/or content is intended entirely for research, educational and informational purposes only and does not constitute investment or consultation advice or investment strategy. The information is not tailored to the investment needs of any specific person and therefore does not involve a consideration of any of the investment objectives, financial situation or needs of any viewer that may receive it. Kindly also note that past performance is not a reliable indicator of future results. Actual results may differ materially from those anticipated in forward-looking or past performance statements. We assume no liability as to the accuracy or completeness of any of the information and/or content provided herein and the Company cannot be held responsible for any omission, mistake nor for any loss or damage including without limitation to any loss of profit which may arise from reliance on any information supplied by Everest Fortune Group.

Potential bearish reversal?USD/JPY is rising towards the resistance level, which is a pullback resistance that aligns with the 50% Fibonacci retracement and could reverse from this level to our take profit.
Entry: 156.32
Why we like it:
There is a pullback resistance level that aligns with the 50% Fibonacci retracement.
Stop loss: 157.56
Why we like it:
There is a swing high resistance level.
Take profit: 154.30
Why we like it:
There is an overlap support level that is slightly above the 61.8% Fibonacci retracement.
Enjoying your TradingView experience? Review us!
Please be advised that the information presented on TradingView is provided to Vantage (‘Vantage Global Limited’, ‘we’) by a third-party provider (‘Everest Fortune Group’). Please be reminded that you are solely responsible for the trading decisions on your account. There is a very high degree of risk involved in trading. Any information and/or content is intended entirely for research, educational and informational purposes only and does not constitute investment or consultation advice or investment strategy. The information is not tailored to the investment needs of any specific person and therefore does not involve a consideration of any of the investment objectives, financial situation or needs of any viewer that may receive it. Kindly also note that past performance is not a reliable indicator of future results. Actual results may differ materially from those anticipated in forward-looking or past performance statements. We assume no liability as to the accuracy or completeness of any of the information and/or content provided herein and the Company cannot be held responsible for any omission, mistake nor for any loss or damage including without limitation to any loss of profit which may arise from reliance on any information supplied by Everest Fortune Group.

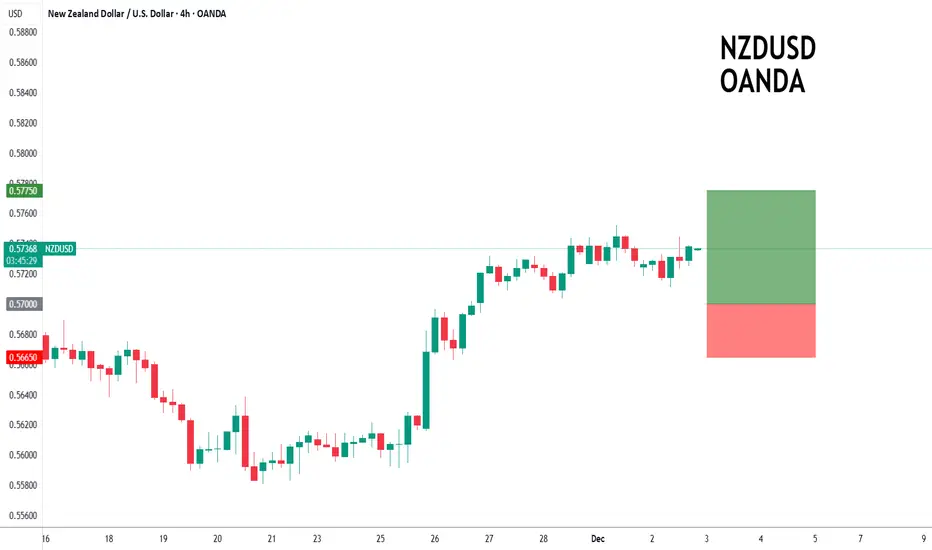
NZDUSD to continue in the upward move?NZDUSD - 24h expiry
There is no clear indication that the upward move is coming to an end.
Although we remain bullish overall, a correction is possible with plenty of room to move lower without impacting the trend higher.
Risk/Reward would be poor to call a buy from current levels.
A move through 0.5750 will confirm the bullish momentum.
The measured move target is 0.5800.
We look to Buy at 0.5700 (stop at 0.5665)
Our profit targets will be 0.5775 and 0.5800
Resistance: 0.5750 / 0.5775 / 0.5800
Support: 0.5725 / 0.5700 / 0.5675
Risk Disclaimer
The trade ideas beyond this page are for informational purposes only and do not constitute investment advice or a solicitation to trade. This information is provided by Signal Centre, a third-party unaffiliated with OANDA, and is intended for general circulation only. OANDA does not guarantee the accuracy of this information and assumes no responsibilities for the information provided by the third party. The information does not take into account the specific investment objectives, financial situation, or particular needs of any particular person. You should take into account your specific investment objectives, financial situation, and particular needs before making a commitment to trade, including seeking, under a separate engagement, as you deem fit.
You accept that you assume all risks in independently viewing the contents and selecting a chosen strategy.
Where the research is distributed in Singapore to a person who is not an Accredited Investor, Expert Investor or an Institutional Investor, Oanda Asia Pacific Pte Ltd (“OAP“) accepts legal responsibility for the contents of the report to such persons only to the extent required by law. Singapore customers should contact OAP at 6579 8289 for matters arising from, or in connection with, the information/research distributed.
Bullish bounce?EUR/USD has bounced off the support level, which is a pullback support and could potentially rise from this level to our take profit.
Entry: 1.1598
Why we like it:
There is a pullback support level.
Stop loss: 1.1569
Why we like it:
There is a pullback support that aligns with the 50% Fibonacci retracement.
Take profit: 1.1665
Why we like it:
There is a swing high resistance
Enjoying your TradingView experience? Review us!
Please be advised that the information presented on TradingView is provided to Vantage (‘Vantage Global Limited’, ‘we’) by a third-party provider (‘Everest Fortune Group’). Please be reminded that you are solely responsible for the trading decisions on your account. There is a very high degree of risk involved in trading. Any information and/or content is intended entirely for research, educational and informational purposes only and does not constitute investment or consultation advice or investment strategy. The information is not tailored to the investment needs of any specific person and therefore does not involve a consideration of any of the investment objectives, financial situation or needs of any viewer that may receive it. Kindly also note that past performance is not a reliable indicator of future results. Actual results may differ materially from those anticipated in forward-looking or past performance statements. We assume no liability as to the accuracy or completeness of any of the information and/or content provided herein and the Company cannot be held responsible for any omission, mistake nor for any loss or damage including without limitation to any loss of profit which may arise from reliance on any information supplied by Everest Fortune Group.

GBPUSD BEARISH BIAS|SHORT|
✅GBPUSD Price is breaking below the supply zone after taking out local internal liquidity, showing a clean shift in orderflow toward downside imbalance. With the breakout confirmed, price is likely to seek the inefficiency below and draw toward the target level.
SHORT🔥
✅Like and subscribe to never miss a new idea!✅

AUD-CHF Free Signal! Sell!
Hello,Traders!
AUDCHF swept downside liquidity and already retested the mitigation block inside the horizontal supply, showing strong SMC rejection structure that opens room for a continuation lower toward the next draw-on-liquidity.
--------------------
Stop Loss: 0.5293
Take Profit: 0.5251
Entry: 0.5272
Time Frame: 3H
--------------------
Sell!
Comment and subscribe to help us grow!
Check out other forecasts below too!

AUD-NZD Local Short! Sell!
Hello,Traders!
AUDNZD swept liquidity into the mitigation block, filled the retest, and is now showing displacement away from the reclaimed supply zone, signalling continuation towards downside imbalance. Time Frame 3H.
Sell!
Comment and subscribe to help us grow!
Check out other forecasts below too!
Disclosure: I am part of Trade Nation's Influencer program and receive a monthly fee for using their TradingView charts in my analysis.

AUDJPY LOCAL SHORT|
✅AUDJPY swept liquidity above the supply zone and is now showing distribution signs. If bearish order flow confirms, expecting a move back into the target zone as the market reprices lower. Time Frame: 3H
SHORT🔥
✅Like and subscribe to never miss a new idea!✅

GBP-USD Bearish Breakout! Sell!
Hello,Traders!
GBPUSD has broken structure beneath the horizontal supply and is now trading below a key distribution zone. A bearish continuation is likely as liquidity from late buyers gets exposed, targeting the clean draw below current lows. Time Frame 3H.
Sell!
Comment and subscribe to help us grow!
Check out other forecasts below too!
Disclosure: I am part of Trade Nation's Influencer program and receive a monthly fee for using their TradingView charts in my analysis!

EU's Consolidation ExpandsHere on FX:EURUSD we can see that Price has been trading between a Rising Resistance and Falling Support or Higher Highs and Lower Lows.
This forms an Expanding Range!
Currently the range is between:
- High: 1.16232
- Low: 1.15912
Until we get a clear cut Breakout of either leg, this Price Action will remain in a battle of Tug-O-War between Bears and Bulls.
*The Breakout will need to be accompanied by a large amount of volume to verify!
Fundamentally, both EUR and USD have impactful news coming out this week with the ECB recently stating they could be at the end of their easing cycle with cuts and the Federal Reserve looking at an 87% chance of another Interest Rate Cut at the Dec. 10th meeting.
Stay vigilant!

XAUUSD: Bullish Push to 4380?As the previous analysis worked exactly as predicted, FX:XAUUSD is eyeing a bullish breakout on the 1-hour chart , with price rebounding from a key support near cumulative buy liquidation, converging with a potential entry zone that could ignite upside momentum if buyers hold against short-term dips. This setup suggests a continuation opportunity amid the recent uptrend, targeting higher resistance levels with excellent risk-reward .🔥
Entry between 4155–4170 for a long position (entry at current levels with proper risk management is recommended. Targets at 4300 (first) , 4380 (second) . Set a stop loss at a close below 4130 , yielding a risk-reward ratio of approximately 1:3 to first target and up to 1:5 overall . Monitor for confirmation via a bullish candle close above entry with rising volume, leveraging gold's momentum near ATH.🌟
Fundamentally , gold is on pace for a fourth consecutive monthly gain in November 2025, rallying toward the $4,400 region amid increased Fed rate cut bets and its safe-haven appeal. As of November 28, prices hover around $4,200 after surging from $4,082 earlier in the week, driven by market expectations of Fed easing and global uncertainties, with forecasts eyeing further upside if resistance at $4200 breaks. 💡
📝 Trade Setup
🎯 Entry (Long):
4155 – 4170
(Entry at current levels also possible with proper risk management.)
🎯 Targets:
• 4300 (first)
• 4380 (second)
❌ Stop Loss:
• Close below 4130
⚖️ Risk-to-Reward:
• ~1:3 to first target
• Up to 1:5 overall
👇 Share your thoughts below! 👇

GOLD, silver climb as Fed enters decisive phaseOANDA:XAUUSD and OANDA:XAGUSD began December with sharp moves, reflecting the intersection of U.S. monetary policy expectations, weak growth pressure, and rising defensive sentiment across global markets.
Spot gold touched USD 4,264/oz, the highest level in six weeks, while silver surged to USD 58.82/oz, marking a historic record. This price momentum is driven not only by a weakening U.S. dollar and prospects of rate cuts, but also by strategic repositioning among funds ahead of a data-heavy week.
Rate-cut expectations have become the central catalyst, with markets pricing in a near-certain reduction in December. Dovish remarks from Fed officials—from Waller to Williams—together with soft manufacturing data reinforce the argument that growth risks are rising faster than inflation risks. Gold has reacted quickly, especially as the Dollar fell to a two-week low before recovering slightly.
Silver, meanwhile, is following a completely different trajectory. Since the start of the year, silver has risen over 100%, benefiting from both safe-haven demand and industrial demand—particularly from electronics and solar energy. Silver’s high sensitivity to policy expectations, combined with speculation about a more dovish-leaning Fed under potential new leadership, is making it difficult for the market to find equilibrium. The fact that White House economic adviser Kevin Hassett is viewed as a possible Fed Chair nominee further increases downward pressure on the Dollar—an effect silver responds to even more strongly than gold.
At the same time, U.S. PMI manufacturing data continues to show economic fatigue, with the November index falling to 48.2, marking the ninth consecutive month below the 50 threshold. Declining new orders, rising input costs, and increasing import-tariff risks are creating a more challenging policy environment for the Fed. And all of this comes just as markets await a wave of high-impact data: ADP employment, and PCE inflation, the Fed’s preferred metric.
In the bond market, a sharp adjustment took place following comments by BOJ Governor Kazuo Ueda, who hinted at possible rate hikes—rare after decades of ultra-easing. Japanese yields surged, transmitting upward pressure to U.S. bonds: the 10-year Treasury yield jumped to 4.096%, the strongest move since mid-July. Meanwhile, U.S. corporations like Merck returning to the market with large bond issuances (USD 8 billion) forced dealers to sell Treasuries for hedging, amplifying volatility.
Another layer of uncertainty comes from the search for the next Fed Chair, with expectations that the White House will make a decision before Christmas. Traders are closely monitoring this because it directly influences the rate path for 2026. The Dollar just had its worst week in four months, and a dovish appointment could extend the decline.
On the geopolitical front, the White House expressed “cautious optimism” about reaching a resolution to the Russia–Ukraine conflict following discussions with Ukrainian officials in Florida. While these signals slightly reduce systemic risk, they remain insufficient to reverse safe-haven demand for precious metals.
I believe the gold–silver market is entering a high-volatility phase, but the bullish structure remains intact.
Rate-cut expectations, a weaker Dollar, and soft economic data continue to form the three core pillars supporting prices. However, rising bond yields and uncertainty over Fed leadership may interrupt the upward momentum in the short term. Powell’s speech this week will serve as an important guidepost, particularly for Q1 2026 rate expectations.
From a strategic perspective, investors should closely monitor employment data, PCE, and bond-market dynamics. In an environment where the monetary-policy cycle is pivoting, gold remains a portfolio hedge, while silver continues to be the asset most reactive to market sentiment and macro expectations—high return, but also higher risk.
Technical analysis and suggestions to follow OANDA:XAUUSD
The main trend of gold remains structurally bullish. The series of higher lows (HL) and higher highs (HH) is intact, supported by the medium-term rising channel and the 0.236–0.382 Fibonacci retracement cluster is acting as a defensive zone. The price is currently trading around $4,223/oz, above the dynamic MA21 and maintaining the bullish market status.
Main Support Zones
• $4,128 – $4,130 (Fib 0.236): the nearest support zone and the boundary of the uptrend.
• $3,972 (Fib 0.382): stronger support; a break below would open a medium-term correction.
• $3,846 (Fib 0.5): the level that protects the large bullish structure.
Resistance – upside target
• 4,380 – 4,390 USD (Fib extension + upper limit of rising channel): next upside target if price holds above 4,128 USD.
• In case of strong momentum (RSI is recovering from the technical oversold zone), the possibility of price moving up to 4,450 – 4,500 USD is not excluded.
Bearish risk conditions
Correction risk is formed only when:
1. Price closes below 4,128 USD, signaling short-term weakness.
2. Breaks 3,972 USD, the mid-term bullish structure is violated, opening a downside zone to
o 3,846 USD,
o or deeper than 3,720 USD (Fib 0.618).
3. RSI fails to surpass the 50 zone.
If the above 3 conditions occur at the same time, the bullish momentum will temporarily lose its dominance.
SELL XAUUSD PRICE 4329 - 4327⚡️
↠↠ Stop Loss 4333
→Take Profit 1 4321
↨
→Take Profit 2 4315
BUY XAUUSD PRICE 4178 - 4180⚡️
↠↠ Stop Loss 4174
→Take Profit 1 4186
↨
→Take Profit 2 4192

GOLD ANALYSIS 12/02/20251. Fundamental Analysis:
a) Economy:
• USD:
The USD is seeing a mild rebound after a strong decline, mainly technical in nature, with no sufficiently strong data to reverse the trend. This only creates short-term pressure on gold.
• U.S. Stock Market:
U.S. markets are mixed due to concerns over slowing corporate earnings. This cautious sentiment is shifting capital flows toward gold.
• Federal Reserve (FED):
The FED maintains a dovish stance, prioritizing economic stability and considering rate cuts. This continues to support gold.
• Trump Administration:
The Trump administration is taking a tougher stance toward several countries, increasing geopolitical uncertainty and boosting safe-haven demand.
• Gold ETF – SPDR:
SPDR has been buying strongly for two consecutive sessions, reinforcing the medium-term uptrend for gold — a highly important factor.
b) Politics:
Multiple geopolitical hotspots occurring simultaneously:
• Ongoing Middle East conflict
• Intensifying strategic competition in Asia
• Russia–Ukraine tensions unresolved
• Venezuela–U.S. relations becoming a new focal point as the Trump administration takes a tougher stance
→ Overall: Risk-off sentiment rises sharply, benefiting gold.
c) Market Sentiment:
Safe-haven sentiment continues to dominate. Investors are reducing risk, pulling out of equities, and pouring into gold — especially with strong SPDR inflows. Asia is also entering its seasonal year-end gold-buying cycle.
2. Technical Analysis:
• Gold has broken out of a major wedge pattern and is currently retesting the breakout area.
• Price is trading above short-term moving averages, showing a clear bullish trend.
• The market is expected to retest the 4186–4190 zone before pushing higher again.
• Next target zones: 4274 → 4320 → 4380.
• M15 RSI is slightly oversold → suitable for a technical bounce.
RESISTANCE: 4,274 – 4,320 – 4,380
SUPPORT: 4,186 – 4,146 – 4,095
3. Previous Market Session (01/12/25):
• Gold maintained its primary uptrend, with only mild corrections that did not break structure.
• SPDR continued buying → confirms real demand.
• USD’s slight rebound did not significantly affect the overall bullish momentum.
• Gold dropped to the opening price at 4,217 and then surged back up to 4,264.
4. Trading Strategy for Today (02/12/25):
🪙 SELL XAUUSD | 4241 – 4239
SL: 4245
TP1: 4233
TP2: 4227
🪙 BUY XAUUSD | 4178 – 4180
SL: 4174
TP1: 4186
TP2: 4192

Live trade: CAD JPY long, fundamental analysis The overall market mood remains positive and following a brief period of 'UEDA hike chatter strength', the JPY is weakening again.
You could put forward a case to long any of the currencies Vs the JPY as a 'risk on' trade. I've chosen the CAD as has it has maintained Friday's 'post GDP positivity'.
The risk to the trade is negative market sentiment, BOJ hike chatter, possibly the falling oil price, or, once again, the stop loss is 'only' behind a 15min swing.
I will hold the trade through market close if required.

Gold price analysis December 2After a slight correction to the 4195 support area, gold quickly regained momentum and continued to maintain the main uptrend structure. This shows that the buyers are still in good control of the market rhythm, especially when the price always receives support at important support zones.
In today's session, the trading strategy still prioritizes BUY orders in line with the trend. It is expected that the market will move towards challenging the psychological resistance zone of 4300 - where profit-taking pressure from the sellers may appear.
📌 Reference strategy
Hold BUY from the 4195 area
BUY Trigger when there is a clear price rejection signal at the support zones: 4170 - 4115
Risk: if the price closes below 4110, selling pressure may return strongly and break the short-term uptrend structure

EUR/USD | Short, Long, Short ! (READ THE CAPTION)By analyzing the #EURUSD chart on the 6 hour timeframe, we can see that price is currently trading around 1.164. I expect a short pullback first, and after that EURUSD could climb again toward the 1.169 zone. Once price reaches the supply area I’m watching, another correction is likely. This analysis will be updated soon.
Please support me with your likes and comments to motivate me to share more analysis with you and share your opinion about the possible trend of this chart with me !
Best Regards , Arman Shaban

NZDJPY: Bullish Continuation 🇳🇿🇯🇵
Here is one of the setups that we discussed on a live stream today.
NZDJPY will likely continue rising after a confirmed
break of structure BoS and a retest of that.
Goal - 0.5958
❤️Please, support my work with like, thank you!❤️
I am part of Trade Nation's Influencer program and receive a monthly fee for using their TradingView charts in my analysis.

GBP/USD | Clean Drop Hit Target, Now Setting Up for the Next MovBy analyzing the #GBPUSD chart on the 2 hour timeframe, we can see that price dropped exactly as expected and successfully hit the 1.32130 target, even dipping briefly to 1.3200. After that move, GBPUSD bounced and is now trading around 1.325.
I expect a small pullback first, but after that the pair could push higher toward the 1.328 area. This analysis will be updated soon.
Please support me with your likes and comments to motivate me to share more analysis with you and share your opinion about the possible trend of this chart with me !
Best Regards , Arman Shaban

EURUSD: Will Keep Falling! Here is Why:
The recent price action on the EURUSD pair was keeping me on the fence, however, my bias is slowly but surely changing into the bearish one and I think we will see the price go down.
Disclosure: I am part of Trade Nation's Influencer program and receive a monthly fee for using their TradingView charts in my analysis.
❤️ Please, support our work with like & comment! ❤️

XAU/USD What to look for? (Read the caption)Hey guys, Amirali here, let's drop an analysis today on the #Gold chart. As you can see, Gold managed to break through the supply zone, completely closing it and then falling all the way to $4181 before bouncing back to the $4200 channel. We must be careful now, as the price dropped below 4187. $4272 to $4320 FVG is yet to be touched, and is a range to be watched.
Sincerely, Amirali
