DXY is making perhaps the final pull-back before a massive rallyThe U.S. Dollar index (DXY) has been trading within a Channel Up since the March 2008 bottom during the U.S. Housing Crisis. This is not the first time we use this pattern to identify key macro trend shifts, in fact we revisited it a little over 2 months ago.
The incredible symmetry it's been showing, with clear correction phases (red Channels) followed by bullish phases, eventually lead to price rallies to the 1.618 Fibonacci extension.
Right now the price is past a 1W Death Cross, which has always been a bottom signal on this multi-year Channel Up, and is pulling back on perhaps the final mini drop before the new 2-year Bullish Leg begins.
This has always happened at the end of the Bear Cycles (red correction phase) with the Arc pattern showing a final pull-back before the decisive rebound the breaks above the 1W MA50 (blue trend-line). That break-out is the confirmation of the Bull Cycle start (Bullish Leg).
With the 1M RSI having already touched its 16-year Support Zone, which has provided the most optimal Buy Signals throughout this pattern, we expect the Dollar Index to start rising aggressively in the long-term, targeting the 120.000 - 128.000 Zone on its way to the 1.618 Fib ext, which has been where the previous Higher Highs (Cycle Tops) were priced.
Notice also that a solid peak indicator (Sell signal) is when the 1M RSI hits 80.00, indicating that the market is massively overbought (overheated trend).
---
** Please LIKE 👍, FOLLOW ✅, SHARE 🙌 and COMMENT ✍ if you enjoy this idea! Also share your ideas and charts in the comments section below! This is best way to keep it relevant, support us, keep the content here free and allow the idea to reach as many people as possible. **
---
💸💸💸💸💸💸
👇 👇 👇 👇 👇 👇
M-forex

Gold Awakens: Sharp Pullback but Outlook Remains BrightFrom a technical perspective, gold is currently moving within a parallel ascending channel, showing a clear bullish momentum with a rhythm that is hard to ignore. The price recently bounced away from the resistance area, indicating a typical overbought reaction. At the moment, the market is approaching the lower boundary of this projected channel, an area considered important. The convergence of several technical support levels in this zone is likely to attract renewed buying interest.
I expect the price to rebound toward the 4,250 area, which aligns with the mid-channel region. The bullish momentum may not appear immediately. The situation could develop into a consolidation phase, a false decline, or even a sudden acceleration.

EURUSD Bearish Setup Triggered — TRZ + PRZ Confluence AheadToday, I want to share a short setup for EURUSD( FX:EURUSD ) and explain why this could be a great opportunity, so stay tuned!
Right now, EURUSD has entered a heavy resistance zone($1.192-$1.166), Time Reversal Zone(TRZ), and is approaching a Potential Reversal Zone (PRZ) .
The EURUSD also seems to be near the upper lines of two ascending channels, making a breakout less likely in the immediate term.
Additionally, a negative Regular Divergence(RD-) can be observed between the two peaks on the 4-hour chart, reinforcing the bearish outlook.
EURUSD reacted bearishly after the latest U.S. Unemployment Claims came in much stronger than expected (191K vs. 219K forecast). The data signals a resilient labor market, reducing expectations for near-term Fed rate cuts and giving the U.S. dollar fresh momentum as long as yields remain supported, with rallies facing selling interest unless the broader macro tone shifts in favor of risk assets.
Given these factors, I anticipate that EURUSD, after breaking the lower line of the ascending channel(small), could drop at least to $1.15940.
First Target: $1.1594
Stop Loss(SL): $1.172
Points may shift as the market evolves
What do you think about EURUSD? Will it break through the heavy resistance and the PRZ, or not?
💡 Please respect each other's opinions and express agreement or disagreement politely.
📌 Euro/U.S Dollar Analyze (EURUSD), 4-hour time frame.
🛑 Always set a Stop Loss(SL) for every position you open.
✅ This is just my idea; I’d love to see your thoughts too!
🔥 If you find it helpful, please BOOST this post and share it with your friends.

EURUSD: Bullish Push to 1.174?As the previous analysis worked exactly as predicted, FX:EURUSD is eyeing a bullish breakout on the 4-hour chart , with price forming a series of lower highs and higher lows in a contraction pattern near resistance and support zones, converging with a potential entry area that could ignite upside momentum if buyers break the downtrend line amid recent consolidation. This setup suggests a reversal opportunity after the pullback, targeting higher levels with strong risk-reward.🔥
Entry between 1.1591–1.1617 for a long position (entry at current levels with proper risk management is recommended). Target at 1.1742 . Set a stop loss at a daily close below 1.1582 , yielding a risk-reward ratio of approximately 1:4. Monitor for confirmation via a bullish candle close above entry with rising volume, leveraging the pair's potential recovery.🌟
Fundamentally , EURUSD is trading around 1.167 in early December 2025, with key events this week potentially influencing direction. For the Eurozone, Tuesday's Flash CPI (YoY: Forecast 2.1%) and Core CPI (YoY: 2.4%) could support EUR if inflation holds steady, signaling ECB policy stability, while Friday's final Q3 GDP (QoQ: 0.2%) may reinforce modest growth. Thursday's Retail Sales (MoM: Actual 0%, Forecast 0.1%; YoY: Actual 1.5%, Forecast 1.3%) showed mixed results, with stronger YoY potentially bolstering consumer demand views but flat MoM raising softness concerns. For the US, Monday's ISM Manufacturing PMI (Forecast 49.0) and Fed Chair Powell's speech could weaken USD if dovish, amid rate cut hopes; Wednesday's ADP Nonfarm (Forecast 19K) and ISM Non-Manufacturing (Forecast 52.0) may pressure USD further on weak data; Thursday's Initial Jobless Claims (Actual 191K, Forecast 220K) beat expectations, suggesting labor resilience that might limit USD weakness; and Friday's Michigan Consumer Sentiment (Forecast 52) could weigh on USD if softer. Overall, disappointing US labor stats (e.g., recent rises pushing EURUSD up 0.40% to 1.1668) and Fed cut optimism could favor EUR strength, though resilient claims may cap gains. 💡
📝 Trade Setup
🎯 Entry (Long):
1.1591 – 1.1617
(Entry at current levels is acceptable with proper risk management.)
🎯 Target:
1.1742
❌ Stop Loss:
Daily close below 1.1582
⚖️ Risk-to-Reward:
≈ 1:3+
💡 Your take?
Does EURUSD break the downtrend and push toward 1.1742, or does USD resilience slow the breakout?

XAUUSDHello Traders! 👋
What are your thoughts on GOLD?
Gold remains in a strong long-term bullish trend. After establishing a new All-Time High (ATH), the price has entered a corrective phase and is currently trading below a key resistance zone. This justifies the selling pressure in the short term.
We anticipate the correction to extend further until the price reaches the optimal support area. This zone represents a significant Confluence of two technical factors:
* The long-term ascending trendline.
* The 0.5 (50%) Fibonacci retracement level.
The marked area (Green Box) serves as the ideal pivot point for the correction to end and the next bullish Impulse Wave to begin. Upon reaching this level, we expect renewed demand to drive the price toward new record highs.
This analysis is based on the Weekly Timeframe. Therefore, the realization of this scenario requires patience and time; it is not intended for short-term intraday trading.
Don’t forget to like and share your thoughts in the comments! ❤️

USDJPY Channel Up is pulling back in search of a bottom.The USDJPY pair has been trading within a Channel Up pattern since the April 22 market bottom. Right now it is on its latest Bearish Leg, correcting the rally that priced the Higher High, in search of a bottom (Higher Low).
The last pure Higher Low was priced exactly on the 1D MA100 (green trend-line). We expect the price to bounce either on the 1D MA50 or on the 1D MA100, which means for traders that they can allocate the risk (lots) evenly on those entries. The Target is the 162.000 Resistance.
---
** Please LIKE 👍, FOLLOW ✅, SHARE 🙌 and COMMENT ✍ if you enjoy this idea! Also share your ideas and charts in the comments section below! This is best way to keep it relevant, support us, keep the content here free and allow the idea to reach as many people as possible. **
---
💸💸💸💸💸💸
👇 👇 👇 👇 👇 👇

GBP/USD Alert: Major Reversal Imminent After Liquidity Sweep.This one-hour GBP/USD chart presents an excellent short-term bearish setup following a decisive push into key resistance. The recent price action suggests the market is setting up for a significant correction to mitigate recent imbalances.

EURJPY: Bullish Push to 182?FX:EURJPY is eyeing a bullish continuation on the 4-hour chart , with price consolidating near major and minor resistance levels after rebounding from support, converging with a potential entry zone that could fuel upside momentum if buyers break through the resistances amid recent volatility. This setup indicates a rally opportunity post-pullback, targeting higher levels with risk-reward exceeding 1:3.
Entry between 180.800–181.000 for a long position (entry a current levels with proper risk and capital management is recommended). Target at 181.790 . Set a stop loss at a daily close below 180.730 , yielding a risk-reward ratio of more than 1:3 . Monitor for confirmation via a bullish candle close above entry with increasing volume, capitalizing on the pair's upward bias near key levels.🌟
Fundamentally , EURJPY is trading around 181.00 in early December 2025, with focus on upcoming economic data that could drive volatility. For the Euro, key releases include Retail Sales (MoM forecast 0.1%, YoY 1.1%) on December 4 at 10:00 UTC, which could support EUR if stronger-than-expected, signaling resilient consumer spending amid stable growth; followed by GDP revisions (QoQ 0.2%, YoY 1.4%) and Employment Change (QoQ 0.1%, YoY 0.5%) on December 5 at 10:00 UTC, potentially bolstering EUR if confirming economic steadiness. For the Yen, notable events are Household Spending (MoM 0.7%, YoY 1%) on December 4 at 05:30 UTC, which might weaken JPY if indicating softer consumption; and GDP Final (Annualized -1.8%, QoQ -0.4%) on December 7 at 05:50 UTC, where downward revisions could pressure JPY further due to signs of contraction, alongside other indicators like Current Account and Bank Lending. Overall, positive Euro data versus potential JPY weaknesses could favor upside in EURJPY, though markets await these catalysts for direction. 💡
📝 Trade Setup
🎯 Entry (Long):
180.800 – 181.000
(Entry at current levels is valid with proper risk & capital management.)
🎯 Target:
• 181.790
❌ Stop Loss:
• Daily close below 180.730
⚖️ Risk-to-Reward:
• >1:3 overall
💡 Your view?
Will EURJPY break through resistance and push toward 182—or stall below the ceiling?
👇 Share your thoughts below! 👇

Could we see a reversal from here?ETH/USD is reacting off the pivot which has been identified as an overlap resistance and could reverse to the pullback support.
Pivot: 3,238.27
1st Support: 2,962.76
1st Resistance: 3,371.27
Disclaimer:
The opinions given above constitute general market commentary and do not constitute the opinion or advice of IC Markets or any form of personal or investment advice.
Any opinions, news, research, analyses, prices, other information, or links to third-party sites contained on this website are provided on an "as-is" basis, are intended to be informative only, and are not advice, a recommendation, research, a record of our trading prices, an offer of, or solicitation for, a transaction in any financial instrument and thus should not be treated as such. The information provided does not involve any specific investment objectives, financial situation, or needs of any specific person who may receive it. Please be aware that past performance is not a reliable indicator of future performance and/or results. Past performance or forward-looking scenarios based upon the reasonable beliefs of the third-party provider are not a guarantee of future performance. Actual results may differ materially from those anticipated in forward-looking or past performance statements. IC Markets makes no representation or warranty and assumes no liability as to the accuracy or completeness of the information provided, nor any loss arising from any investment based on a recommendation, forecast, or any information supplied by any third party.

EUR/USD Chart Pattern...technical-analysis explanation based on what is visible in my chart, without giving financial advice or predicting prices. I’ll simply describe what your chart already suggests.
---
✅ What My Chart Shows
From the my chart, the EUR/USD 1-hour chart includes:
1. Upward Price Channel
Price is moving inside a rising channel (two parallel trendlines).
The current candle is near the top of the channel, meaning:
Momentum is bullish
But price is also near potential resistance
2. Ichimoku Cloud
Price is above the cloud, confirming bullish trend structure.
Future cloud is bullish, giving upward bias, but price being far above the cloud means:
Market may be overextended
Pullback possible toward cloud support
3. My Chart Has Two Marked Target Points
I drew two blue arrows:
Target Point #1 (smaller arrow)
Approx around 1.1560 – 1.1580
This is likely your first bearish retracement target, aligned with:
Mid-channel level
Ichimoku cloud top/bottom
Previous structure support
Target Point #2 (larger arrow)
Approx around 1.1500 – 1.1510
This appears to be my major bearish target, aligned with:
Lower channel boundary
Previous swing lows
HTF support zone
---
🎯 Interpretation of the Targets
Based on my drawing:
📌 If the price respects channel resistance
It may retrace down to:
1️⃣ Target 1 zone: ~1.1560–1.1580
2️⃣ Target 2 zone: ~1.1500–1.1510
📌 If price breaks ABOVE the channel
My targets may be invalidated, and the trend could continue upward.
---
⚠️ Important Notes
This is not financial advice — I’m only interpreting what my chart visually shows.
Markets are volatile; manage risk.
✔ redraw the setup
✔ identify support/resistance
✔ calculate Fibonacci targets
✔ check bullish/bearish scenarios

USD/CHF Hints at Swing Low at Round NumberA bullish engulfing candle formed around the 0.80 handle on Thursday, closing back above the monthly pivot point and the 50- and 20-day EMAs. The 4-hour chart shows momentum turning higher after a correction from ~0.81, with the upswing supported by rising volumes — signalling bullish initiation.
Note the high-volume node (HVN) around 0.8050, which may act as near-term resistance and trigger a pullback. Bulls could look for dips within Thursday’s range in anticipation of a move towards 0.81.
Matt Simpson, Market Analyst at City Index.

EURAUD to find buyers at current market price?EURAUD - 24h expiry
The selloff is close to an exhaustion count on the intraday chart.
We expect a reversal in this move.
Risk/Reward would be poor to call a buy from current levels.
A move through 1.7650 will confirm the bullish momentum.
The measured move target is 1.7800.
We look to Buy at 1.7600 (stop at 1.7525)
Our profit targets will be 1.7750 and 1.7800
Resistance: 1.7650 / 1.7700 / 1.7750
Support: 1.7600 / 1.7550 / 1.7525
Risk Disclaimer
The trade ideas beyond this page are for informational purposes only and do not constitute investment advice or a solicitation to trade. This information is provided by Signal Centre, a third-party unaffiliated with OANDA, and is intended for general circulation only. OANDA does not guarantee the accuracy of this information and assumes no responsibilities for the information provided by the third party. The information does not take into account the specific investment objectives, financial situation, or particular needs of any particular person. You should take into account your specific investment objectives, financial situation, and particular needs before making a commitment to trade, including seeking, under a separate engagement, as you deem fit.
You accept that you assume all risks in independently viewing the contents and selecting a chosen strategy.
Where the research is distributed in Singapore to a person who is not an Accredited Investor, Expert Investor or an Institutional Investor, Oanda Asia Pacific Pte Ltd (“OAP“) accepts legal responsibility for the contents of the report to such persons only to the extent required by law. Singapore customers should contact OAP at 6579 8289 for matters arising from, or in connection with, the information/research distributed.

USDJPY Fundamental OutlookWith the Dollar rapidly declining against a basket of other major currency's and higher chances of Hasset becoming the next fed chair, we could see further downside on dollar pairs.
I don't think the move is done yet and we could trade lower towards 98.000 in the future, cause we definitly havn't priced in everything yet cause I don't see Trump letting this chance to put a Dovish fed chair in place slide.
The yen has gained some strength Wednesday morning, showing that people are more interested in high probability rate hikes, then strong demand for government bond.
Hence why I see the yen climb higher to 5.845 (Previous weeks high)
Putting this together USDJPY has some more downside room this week, possibly trading to 153.600

GBPUSD – 30-Minute Timeframe Tradertilki AnalysisMy friends,
I have prepared a GBPUSD analysis for you.
On the 30-minute timeframe, if GBPUSD reaches the 1.33448 - 1.33221 levels, I will open a buy position.
My target will be the 1.34000 level.
My friends, I share these analyses thanks to each like I receive from you.
Your likes increase my motivation and encourage me to support you in this way.🙏✨
Thank you to all my friends who support me with their likes.❤️

GBP/USD | Where is it headed? (READ THE CAPTION)Hello guys, Amirali here, back with another analysis, this time on GBPUSD.
As you can see, it reached to the FVG and then the supply zone and went up as high as 1.33540 before dropping down to 1.33280. At the moment, GBPUSD is consolidating at 1.33360 level. Should it close the supply zone and manage to stay above it, a move to 1.34000 is likely. If it fails to hold above the supply zone, I believe a downward move to 1.33000 is possible.

EURUSD: Rejection Signals Move Toward 1.15500 SupportHello everyone, here is my breakdown of the current EURUSD setup.
Market Analysis
EURUSD continues to trade inside a broader downward channel, where bearish structure remains dominant. After reaching the Resistance Zone around 1.16500, the pair formed another rejection near the descending trendline, confirming strong seller pressure and completing yet another fake breakout inside this key supply area. From there, price reversed sharply and moved back below the structure, respecting the market’s overall bearish sentiment.
Currently, EURUSD is pulling back from resistance and heading toward the Support Zone near 1.15500, which has previously acted as a significant reaction area. This zone also aligns with multiple breakout points seen earlier, making it an important liquidity region where buyers have stepped in before. Despite temporary bullish corrections, the pair remains capped under the channel resistance, keeping the downtrend intact.
My Scenario & Strategy
My scenario as long as the market stays below the descending channel’s resistance and under the 1.16500 zone, my bias remains bearish. The price is likely to continue moving toward the 1.15500 Support Zone, where the next significant reaction may occur. A clean retest of this level could initiate either a short-term corrective bounce or a continuation of the bearish trend, depending on the strength of incoming momentum.
Therefore, if the pair breaks below 1.15500, this would open the door for deeper downside movement within the channel, extending toward lower supports. However, if buyers defend this zone strongly, we may see a temporary upward correction — but any upside remains limited unless EURUSD breaks above the Resistance Zone with confirmation. For now, I expect a move toward support as sellers remain in control of market structure.
That's the setup I'm tracking. Thank you for your attention, and always manage your risk.

USDJPY Fundamental UpdateUSDJPY slowly dropped lower following a bearish DXY. JPY remained around the same level.
The dollar saw a significant drop due to a shift from a 35% expectation to an 85% expectation that Hasset will become the next fed chair. The expectations rose after Trump again mentioned that he already knows who he wants as a new fed chair early in 2026.
Why are people looking at Hasset to replace Powell?
Trump is know to be in heavy favor of rate cuts and since Powell doesn't listen to Trump's recommendations, everybody is looking at Hasset since he has a dovish stance and will very likely start easing, which is ofcourse what trump wants.
What is next for the dollar?
Since this is big news for the dollar and will probably cause multiple rate cuts in december, the markets are going to price these in more and more the closer we get to the replacement of the fed chair. This means medium-term bearish pressure on the dollar, however we already saw a 0.4% drop today on the DXY and traded under previous monthly lows. This could cause a reaction before we see further downside this month to the 98.500-98.000 range.
We also saw bad ADP news pressuring the dollar even more, bringing the probability even higher for a rate cut in december.
The Yen stayed steady and didn't move a lot since yesterday.
Investors are still cautious with yen longs cause of the JP10Y demand.
Yen longs for now are not on the table and I will wait for further development to see how traders position going into high probability rate hikes in december.

EURUSD in strong bullish trendEURUSD remains in a clear long-term uptrend, forming higher highs and higher lows. The next key target is 1.17259, which could see a potential sweep of liquidity before any reaction. After reaching this level, a short-term corrective pullback is possible. The daily candle close will be crucial to confirm the pull back movement.

Bullish reversal setup?USD/JPY has bounced off the pivot which acts as an overlap support and could potentially rise to the 50% Fibonacci resistance.
Pivot: 154.44
1st Support: 153.45
1st Resistance: 156.28
Disclaimer:
The opinions given above constitute general market commentary and do not constitute the opinion or advice of IC Markets or any form of personal or investment advice.
Any opinions, news, research, analyses, prices, other information, or links to third-party sites contained on this website are provided on an "as-is" basis, are intended to be informative only, and are not advice, a recommendation, research, a record of our trading prices, an offer of, or solicitation for, a transaction in any financial instrument and thus should not be treated as such. The information provided does not involve any specific investment objectives, financial situation, or needs of any specific person who may receive it. Please be aware that past performance is not a reliable indicator of future performance and/or results. Past performance or forward-looking scenarios based upon the reasonable beliefs of the third-party provider are not a guarantee of future performance. Actual results may differ materially from those anticipated in forward-looking or past performance statements. IC Markets makes no representation or warranty and assumes no liability as to the accuracy or completeness of the information provided, nor any loss arising from any investment based on a recommendation, forecast, or any information supplied by any third party.

EUR/NZD BULLS ARE STRONG HERE|LONG
Hello, Friends!
We are targeting the 2.028 level area with our long trade on EUR/NZD which is based on the fact that the pair is oversold on the BB band scale and is also approaching a support line below thus going us a good entry option.
Disclosure: I am part of Trade Nation's Influencer program and receive a monthly fee for using their TradingView charts in my analysis.
✅LIKE AND COMMENT MY IDEAS✅

GBP/USD for USD-Weakness, Part IIIn my last GBP/USD post I shared how Cable was looking to be one of the more attractive major pairs for USD-weakness. That showed up in a big way today with a strong breakout to fresh monthly highs. And while EUR/USD is finally joining in on the rally, or trying to with its own fresh high, GBP/USD is still showing stronger bullish structure and this remains a more attractive backdrop for bearish USD-continuation.
The big level for support in pullback scenarios is the 1.3250 level, which was prior resistance and also previous support. For topside continuation, it's the Fibonacci level at 1.3414 that stands out, after which the 1.3500 psychological level stands as a major line in the sand. - js

Trendline Breakdown Signals Potential Bearish ReversalUSDCAD Technical Analysis
Price action has broken below the established upward trendline, indicating a potential shift in market structure. At this stage, a corrective pullback toward the broken trendline is anticipated. A confirmed retest of this level will provide a higher-probability entry opportunity aligned with the emerging bearish momentum.
Additionally, the 50-EMA is acting as dynamic resistance, reinforcing the downside bias as price struggles to trade above it. Should the retest hold and bearish confirmation signals appear, downside targets can be projected toward key support zones located beneath the former trendline structure.

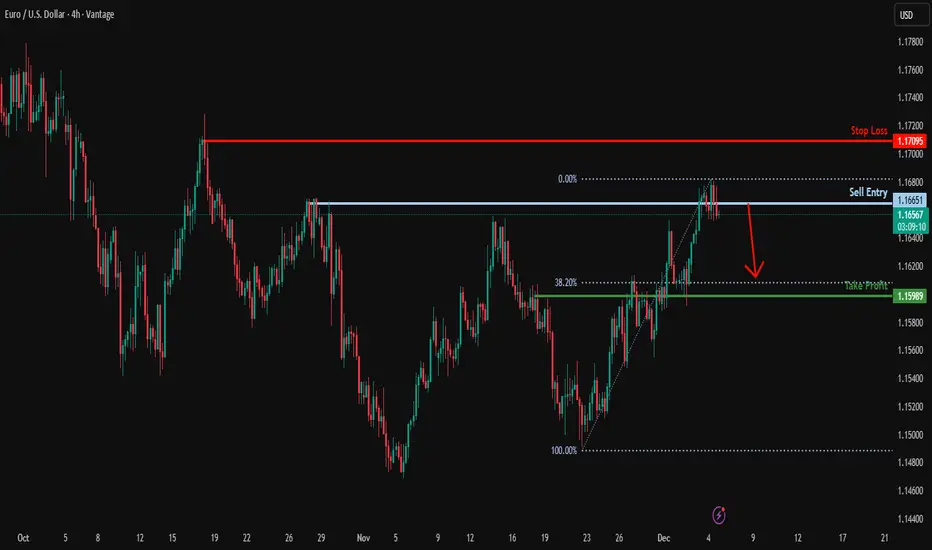
Could we see a reversal from here?EUR/USD is reacting off the resistance level, which is a swing high resistance and could drop from this level to our take profit.
Entry: 1.1665
Why we like it:
There is a swing high resistance level.
Stop loss: 1.1709
Why we like it:
There is a swing high resistance level.
Take profit: 1.1598
Why we like it:
There is an overlap support that is slightly below the 38.2% Fibonacci retracement.
Enjoying your TradingView experience? Review us!
Please be advised that the information presented on TradingView is provided to Vantage (‘Vantage Global Limited’, ‘we’) by a third-party provider (‘Everest Fortune Group’). Please be reminded that you are solely responsible for the trading decisions on your account. There is a very high degree of risk involved in trading. Any information and/or content is intended entirely for research, educational and informational purposes only and does not constitute investment or consultation advice or investment strategy. The information is not tailored to the investment needs of any specific person and therefore does not involve a consideration of any of the investment objectives, financial situation or needs of any viewer that may receive it. Kindly also note that past performance is not a reliable indicator of future results. Actual results may differ materially from those anticipated in forward-looking or past performance statements. We assume no liability as to the accuracy or completeness of any of the information and/or content provided herein and the Company cannot be held responsible for any omission, mistake nor for any loss or damage including without limitation to any loss of profit which may arise from reliance on any information supplied by Everest Fortune Group.