XAUUSD: Gold Continues to Rise on Rate Cut ExpectationsGold continues its upward trend from yesterday, with the current price at 4,159.455 USD. The chart shows that gold is moving within a stable upward channel, and if it maintains above this support level, there is a high likelihood that the price will continue towards the 4,190,000 USD level.
Why is gold continuing to rise?
Weaker-than-expected U.S. retail sales data has reinforced the forecast that the U.S. Federal Reserve (Fed) will cut interest rates in December 2025. This has weakened the USD, which in turn reduces yields and increases gold's appeal as a safe-haven asset. These factors, combined with expectations of rate cuts, suggest that gold has the potential to continue rising sharply.
Next Scenario:
If the price of gold stays above the 4,120,000 USD support zone, there is a high probability it will break through the 4,190,000 USD resistance level. The potential for continued upward movement could push gold to 4,230,000 USD in the near future.
With strong support and a favorable market backdrop, XAUUSD is likely to continue this upward trend, especially as labor market data from the U.S. is released.
M-forex

Gold Rises as Fed Signals Dovish PathHello everyone,
Spot gold closed on 26/11 around 4,162 USD, touching 4,170 USD at one point — the highest since 14/11. The CME FedWatch tool now shows ~85% of the market expecting a 0.25% rate cut at the December Fed meeting, a sharp increase from 30% just a week ago.
Officials such as Christopher Waller and John Williams have signaled support for easing, along with the potential appointment of Kevin Hassett as Fed Chair, further strengthening the case for long-term support in gold. Major banks like Deutsche Bank have raised next year’s average gold forecast to 4,450 USD, while central bank demand remains steady. In short, from a news perspective, all factors favor the bulls.
On the H4 chart, gold has just risen from the ~4,020–4,040 area above 4,150, then consolidated in a cluster of small candles just below the 4,165–4,170 peak. This is a classic high-level accumulation pattern, often preceding the next breakout. Below, two green FVG clusters around 4,110–4,120 and 4,050–4,070 act as strong support platforms, previously providing decisive upward momentum.
Sole forecast: gold continues to RISE.
In the short term, minor pullbacks to 4,140–4,130, or even 4,120 to test the green FVG, are possible. As long as 4,110 holds, these retracements remain part of the ongoing uptrend.

EURUSD Breakout: Pullback or Uptrend Continuation?Hello everyone, looking at the H4 chart, EURUSD has just completed a clean breakout. The price has decisively moved above the Ichimoku cloud and the green FVG cluster around 1.1550–1.1570, turning this area into a new support. This is a notable step, especially as the Higher Low → Higher High structure remains intact, showing buyers are still in control.
The reasons behind the current upswing are clear:
Technical breakout: Price surpassed a key resistance zone, generating a new buy signal.
Weak selling pressure: Candles near the top have short upper wicks, suggesting minimal profit-taking.
Buying trend dominates: Minor pullbacks are just corrections within the ongoing uptrend.
Where might EURUSD head next?
Scenario 1 : If it holds above 1.1550, price may oscillate slightly between 1.1570–1.1590 to test FVG/support, then continue toward 1.1670, and possibly 1.1720 — a convergence of major resistance.
Scenario 2: A break below 1.1550 could trigger stronger selling pressure, potentially invalidating the current upswing.
From my perspective, the higher-probability scenario is that EURUSD will continue rising after testing support.
What about you? Will EURUSD continue its rally or experience more volatility? Share your thoughts!

XAUUSD Bullish Momentum Continues — Target 4,350OANDA:XAUUSD is still trading within a clearly defined ascending channel, with recent price action bouncing off a key support level. This suggests that the bullish trend is likely to continue, with the next target being around 4,350, aligning with the upper boundary of the channel.
A short-term pullback could present a buying opportunity, especially if bullish candlestick patterns like engulfing or hammer appear, signaling strength from the buyers. A decisive breakout above recent highs would further reinforce the momentum towards the expected target.
However, if the price breaks below the lower boundary of the channel, it would invalidate the bullish outlook and potentially signal a shift in market direction.
This is just my perspective on the market, not financial advice. Best of luck!

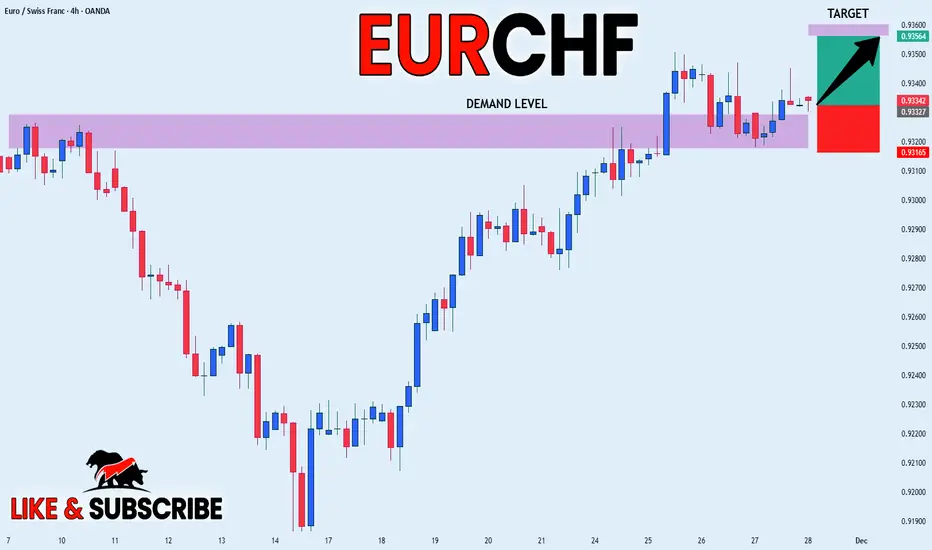
EURCHF FREE SIGNAL|LONG|
✅EURCHF is reacting from the higher-timeframe demand block after clearing sell-side liquidity and showing bullish displacement. With inefficiency above acting as a magnet, price may draw toward the next buy-side target.
—————————
Entry: 0.9332
Stop Loss: 0.9316
Take Profit: 0.9356
Time Frame: 4H
—————————
LONG🚀
✅Like and subscribe to never miss a new idea!✅
NZDJPY to continue in the rally?NZDJPY - 24h expiry
There is no clear indication that the upward move is coming to an end.
Offers ample risk/reward to buy at the market.
15min EMA is at 89.45.
Our outlook is bullish.
Our bespoke resistance of 89 has been clearly broken.
We look to Buy at 89.45 (stop at 89.05)
Our profit targets will be 90.65 and 90.95
Resistance: 89.56 / 90.00 / 90.50
Support: 89.00 / 88.65 / 88.40
Risk Disclaimer
The trade ideas beyond this page are for informational purposes only and do not constitute investment advice or a solicitation to trade. This information is provided by Signal Centre, a third-party unaffiliated with OANDA, and is intended for general circulation only. OANDA does not guarantee the accuracy of this information and assumes no responsibilities for the information provided by the third party. The information does not take into account the specific investment objectives, financial situation, or particular needs of any particular person. You should take into account your specific investment objectives, financial situation, and particular needs before making a commitment to trade, including seeking, under a separate engagement, as you deem fit.
You accept that you assume all risks in independently viewing the contents and selecting a chosen strategy.
Where the research is distributed in Singapore to a person who is not an Accredited Investor, Expert Investor or an Institutional Investor, Oanda Asia Pacific Pte Ltd (“OAP“) accepts legal responsibility for the contents of the report to such persons only to the extent required by law. Singapore customers should contact OAP at 6579 8289 for matters arising from, or in connection with, the information/research distributed.

CISD as an Entry mechanism. How I pair my entry with CISDFPMARKETS:GBPUSD
An example to show you the entry mechanism of CISD

Swing high resistance ahead?NZD/CHF is rising towards the pivot and could reverse to the 1st support, which is a pullback support.
Pivot: 0.46184
1st Support: 0.45882
1st Resistance: 0.46405
Disclaimer:
The opinions given above constitute general market commentary and do not constitute the opinion or advice of IC Markets or any form of personal or investment advice.
Any opinions, news, research, analyses, prices, other information, or links to third-party sites contained on this website are provided on an "as-is" basis, are intended to be informative only, and are not advice, a recommendation, research, a record of our trading prices, an offer of, or solicitation for, a transaction in any financial instrument and thus should not be treated as such. The information provided does not involve any specific investment objectives, financial situation, or needs of any specific person who may receive it. Please be aware that past performance is not a reliable indicator of future performance and/or results. Past performance or forward-looking scenarios based upon the reasonable beliefs of the third-party provider are not a guarantee of future performance. Actual results may differ materially from those anticipated in forward-looking or past performance statements. IC Markets makes no representation or warranty and assumes no liability as to the accuracy or completeness of the information provided, nor any loss arising from any investment based on a recommendation, forecast, or any information supplied by any third party.

Bullish reversal?USD/ZAR has bounced off the pivot and could rise to the 1st resistance that aligns with the 38.2% Fibonacci retracement.
Pivot: 17.0934
1st Support: 16.9763
1st Resistance: 17.2333
Disclaimer:
The opinions given above constitute general market commentary and do not constitute the opinion or advice of IC Markets or any form of personal or investment advice.
Any opinions, news, research, analyses, prices, other information, or links to third-party sites contained on this website are provided on an "as-is" basis, are intended to be informative only, and are not advice, a recommendation, research, a record of our trading prices, an offer of, or solicitation for, a transaction in any financial instrument and thus should not be treated as such. The information provided does not involve any specific investment objectives, financial situation, or needs of any specific person who may receive it. Please be aware that past performance is not a reliable indicator of future performance and/or results. Past performance or forward-looking scenarios based upon the reasonable beliefs of the third-party provider are not a guarantee of future performance. Actual results may differ materially from those anticipated in forward-looking or past performance statements. IC Markets makes no representation or warranty and assumes no liability as to the accuracy or completeness of the information provided, nor any loss arising from any investment based on a recommendation, forecast, or any information supplied by any third party.

EUR/GBP Trade Setup — Bullish OpportunityOn EUR/GBP, price has recently broken above a key resistance area that previously rejected price multiple times. After the breakout, price returned to the same zone, where it is now showing signs of support. This is a classic example of resistance turning into support, suggesting that buyers are defending this level.
At the same time, price has filled a fair value gap (FVG) created during the bullish move. When the imbalance gets filled, the market often establishes a stronger foundation for continuation in the same direction.
With buyers reacting to both the support zone and the FVG, this area becomes a potential bullish entry point. A stop loss placed just below the support protects the position if buyers fail to hold it, while targeting the recent swing high provides a 1:3 risk-to-reward setup.
📈 Bias: Bullish
🟦 Zone of Interest: Support + FVG
🎯 Target: Previous swing high
🛡 Stop Loss: Below support

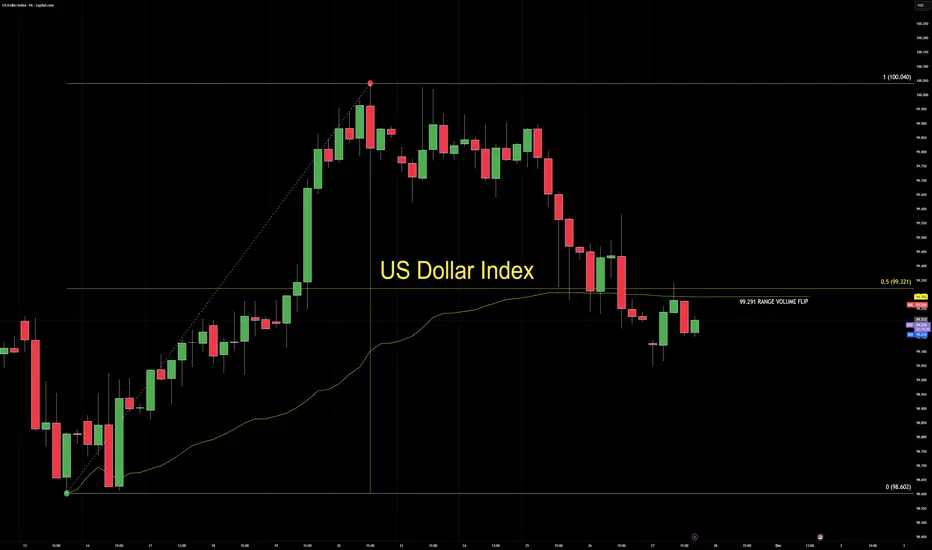
US DOLLAR UPDATEDollar is trading in the discount of the daily bullish range, losing momentum, and flipping the range volume node bearish at 99.291.
Range 98.602 → 100.040.
1. DRIVERS
Softening Dollar with fading participation.
2. STRUCTURE
Discount test with weak rotation.
Bearish node flip shows shifting participation, not a macro break.
3. IMPLICATION
Range location doesn’t confirm a flush.
Cross-market rally only forms when yields, risk tone, and correlations align.
4. CORE5 PILLARS
MSM: discount test
DGM: momentum fading
VFA: bearish flip at 99.291
OFD: no strong absorption
PEM: wait for confirmation
5. TAKEAWAY
This is a probe, not a confirmed reversal.
— CORE5DAN
Institutional Logic. Modern Technology. Real Freedom.
AUDJPY: Weak Market & Bearish Forecast
The charts are full of distraction, disturbance and are a graveyard of fear and greed which shall not cloud our judgement on the current state of affairs in the AUDJPY pair price action which suggests a high likelihood of a coming move down.
Disclosure: I am part of Trade Nation's Influencer program and receive a monthly fee for using their TradingView charts in my analysis.
❤️ Please, support our work with like & comment! ❤️

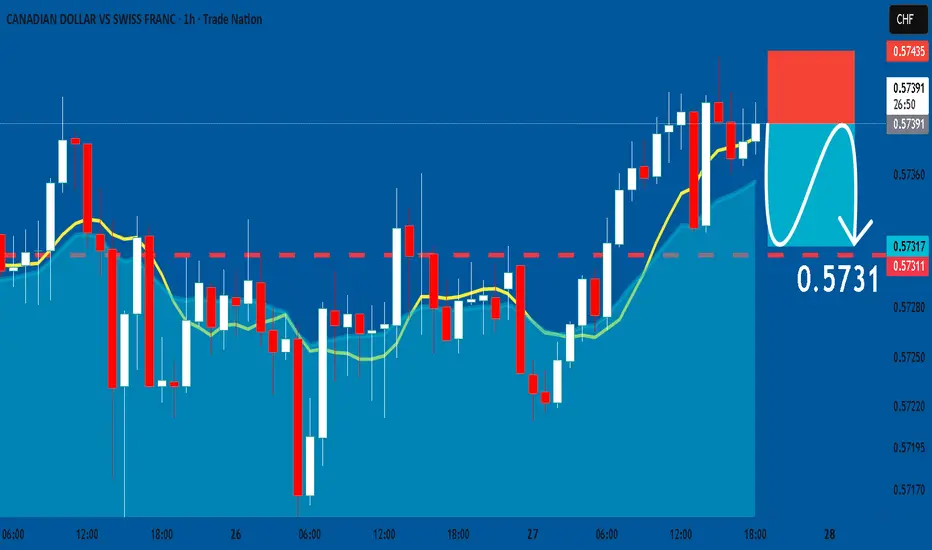
CADCHF: Bearish Continuation & Short Signal
CADCHF
- Classic bearish formation
- Our team expects pullback
SUGGESTED TRADE:
Swing Trade
Short CADCHF
Entry - 0.5739
Sl - 0.5743
Tp - 0.5731
Our Risk - 1%
Start protection of your profits from lower levels
Disclosure: I am part of Trade Nation's Influencer program and receive a monthly fee for using their TradingView charts in my analysis.
❤️ Please, support our work with like & comment! ❤️
AUDJPY Trading Opportunity! BUY!
My dear followers,
I analysed this chart on AUDJPY and concluded the following:
The market is trading on 100.92 pivot level.
Bias - Bullish
Technical Indicators: Both Super Trend & Pivot HL indicate a highly probable Bullish continuation.
Target - 101.16
Safe Stop Loss - 100.81
About Used Indicators:
A super-trend indicator is plotted on either above or below the closing price to signal a buy or sell. The indicator changes color, based on whether or not you should be buying. If the super-trend indicator moves below the closing price, the indicator turns green, and it signals an entry point or points to buy.
Disclosure: I am part of Trade Nation's Influencer program and receive a monthly fee for using their TradingView charts in my analysis.
———————————
WISH YOU ALL LUCK

CADJPY Will Collapse! SELL!
My dear followers,
This is my opinion on the CADJPY next move:
The asset is approaching an important pivot point 111.45
Bias - Bearish
Safe Stop Loss - 111.62
Technical Indicators: Supper Trend generates a clear short signal while Pivot Point HL is currently determining the overall Bearish trend of the market.
Goal - 111.13
About Used Indicators:
For more efficient signals, super-trend is used in combination with other indicators like Pivot Points.
Disclosure: I am part of Trade Nation's Influencer program and receive a monthly fee for using their TradingView charts in my analysis.
———————————
WISH YOU ALL LUCK

GBPNZD Massive Long! BUY!
My dear subscribers,
My technical analysis for GBPNZD is below:
The price is coiling around a solid key level - 2.3126
Bias - Bullish
Technical Indicators: Pivot Points Low anticipates a potential price reversal.
Super trend shows a clear buy, giving a perfect indicators' convergence.
Goal - 2.3243
About Used Indicators:
By the very nature of the supertrend indicator, it offers firm support and resistance levels for traders to enter and exit trades. Additionally, it also provides signals for setting stop losses
Disclosure: I am part of Trade Nation's Influencer program and receive a monthly fee for using their TradingView charts in my analysis.
———————————
WISH YOU ALL LUCK

GBPAUD Technical Analysis! BUY!
My dear friends,
My technical analysis for GBPAUD is below:
The market is trading on 2.0266 pivot level.
Bias - Bullish
Technical Indicators: Both Super Trend & Pivot HL indicate a highly probable Bullish continuation.
Target - 2.0284
Recommended Stop Loss - 2.0253
About Used Indicators:
A pivot point is a technical analysis indicator, or calculations, used to determine the overall trend of the market over different time frames.
Disclosure: I am part of Trade Nation's Influencer program and receive a monthly fee for using their TradingView charts in my analysis.
———————————
WISH YOU ALL LUCK

NZDUSD ShortThe overall direction of the trend has been bearish since July 2025. The trajectory has been on continual decline. Price to make another short bullish consolidation before another continual crash downwards.

Trading quiet markets: General rule of thumbAs North America celebrates Thanksgiving, US stock and bond markets are closed. The currency market continues as normal.
'In general' a good rule of thumb in quiet markets is that 'movent continues in the prevailing direction'. Although likely very slowly.
It is very pleasing that the recent 'risk on sentiment' and the currencies behaving as you would expect, has continued.
I wouldn't blame anyone for placing a risk on trade today, in fact, overall sentiment and currency movement invites a trade. (AUD USD long for example).
Personally, I prefer to wait until liquidity picks up again, which for me, means waiting until at least Friday's European session.
I realise it is easier to sit on the sidelines with two trades under my belt this week.
If you are trading, it is prudent to be aware that some platforms 'widen spreads' in quiet times.

USDCAD BEARISH BREAKOUT|SHORT|
✅USDCAD broke below the supply zone with clean displacement, leaving a fresh imbalance that may act as a breaker on any pullback. Expect price to draw toward sell-side liquidity resting near the lower target area. Time Frame 3H.
SHORT🔥
✅Like and subscribe to never miss a new idea!✅

AUD-USD Bullish Bias! Buy!
Hello,Traders!
AUDUSD pair reclaimed the demand zone after sweeping sell-side liquidity, shifting structure bullish. If momentum holds, price may target the premium inefficiency above as buy-side liquidity gets drawn. Time Frame 3H.
Buy!
Comment and subscribe to help us grow!
Check out other forecasts below too!
Disclosure: I am part of Trade Nation's Influencer program and receive a monthly fee for using their TradingView charts in my analysis.

EURAUD LOCAL LONG|
✅EURAUD has tapped the higher-timeframe demand after clearing sell-side liquidity, signaling a potential bullish reversal. If displacement confirms, algos may drive price toward the next buy-side liquidity target above. Time Frame 3H.
LONG🚀
✅Like and subscribe to never miss a new idea!✅

EUR-CHF Will Keep Growing! Buy!
Hello,Traders!
EURCHF is holding above the horizontal demand after a sweep of sell-side liquidity, hinting at accumulation. If bullish intent confirms, expect continuation toward the next buy-side liquidity at the target level.
Time Frame 8H.
Buy!
Comment and subscribe to help us grow!
Check out other forecasts below too!
Disclosure: I am part of Trade Nation's Influencer program and receive a monthly fee for using their TradingView charts in my analysis.
