GBPUSD H1 | Bullish RiseMomentum: Bullish
Price may pull back toward the buy entry level, which is acting as support. The market is also trading above the Ichimoku cloud, reinforcing the bullish bias.
Buy Entry: 1.3210
Pullback support
Stop Loss: 1.3183
Below pullback support
Take Profit: 1.3267
Multiple swing-high resistance
High Risk Investment Warning
Stratos Markets Limited (tradu.com ), Stratos Europe Ltd (tradu.com ):
CFDs are complex instruments and come with a high risk of losing money rapidly due to leverage. 70% of retail investor accounts lose money when trading CFDs with this provider. You should consider whether you understand how CFDs work and whether you can afford to take the high risk of losing your money.
Stratos Global LLC (tradu.com ): Losses can exceed deposits.
Please be advised that the information presented on TradingView is provided to Tradu (‘Company’, ‘we’) by a third-party provider (‘TFA Global Pte Ltd’). Please be reminded that you are solely responsible for the trading decisions on your account. Any information and/or content is intended entirely for research, educational and informational purposes only and does not constitute investment or consultation advice or investment strategy. The information is not tailored to the investment needs of any specific person and therefore does not involve a consideration of any of the investment objectives, financial situation or needs of any viewer that may receive it. Past performance is not a reliable indicator of future results. Actual results may differ materially from those anticipated in forward-looking or past performance statements. We assume no liability as to the accuracy or completeness of any of the information and/or content provided herein and the Company cannot be held responsible for any omission, mistake nor for any loss or damage including without limitation to any loss of profit which may arise from reliance on any information supplied by TFA Global Pte Ltd.
M-forex

USDJPY H4 | Potential Bullish BounceMomentum: Bullish
The price is falling towards the buy entry, which is an overlap support and also aligns with the 38.2% Fibonacci retracement.
Buy etry: 154.68
Overlap support
38.2% FIbonacci retraceemt
Stop loss: 153.49
Pullback support
50% FIbonacci retracement
Take profit: 156.32
Pullback resistance
High Risk Investment Warning
Stratos Markets Limited (tradu.com ), Stratos Europe Ltd (tradu.com ):
CFDs are complex instruments and come with a high risk of losing money rapidly due to leverage. 70% of retail investor accounts lose money when trading CFDs with this provider. You should consider whether you understand how CFDs work and whether you can afford to take the high risk of losing your money.
Stratos Global LLC (tradu.com ): Losses can exceed deposits.
Please be advised that the information presented on TradingView is provided to Tradu (‘Company’, ‘we’) by a third-party provider (‘TFA Global Pte Ltd’). Please be reminded that you are solely responsible for the trading decisions on your account. Any information and/or content is intended entirely for research, educational and informational purposes only and does not constitute investment or consultation advice or investment strategy. The information is not tailored to the investment needs of any specific person and therefore does not involve a consideration of any of the investment objectives, financial situation or needs of any viewer that may receive it. Past performance is not a reliable indicator of future results. Actual results may differ materially from those anticipated in forward-looking or past performance statements. We assume no liability as to the accuracy or completeness of any of the information and/or content provided herein and the Company cannot be held responsible for any omission, mistake nor for any loss or damage including without limitation to any loss of profit which may arise from reliance on any information supplied by TFA Global Pte Ltd.

EURUSD H4 | Bearish ReversalMomentum: Bearish
The price is reacting to the sell entry, which has been identified as pullback resistance.
Sell entry: 1.1599
Pullback resistance
Stop oss: 1.1648
Swing high resistance
Take profit: 1.1534
Overlap support
61.8% Fibonacc retracement
High Risk Investment Warning
Stratos Markets Limited (tradu.com ), Stratos Europe Ltd (tradu.com ):
CFDs are complex instruments and come with a high risk of losing money rapidly due to leverage. 70% of retail investor accounts lose money when trading CFDs with this provider. You should consider whether you understand how CFDs work and whether you can afford to take the high risk of losing your money.
Stratos Global LLC (tradu.com ): Losses can exceed deposits.
Please be advised that the information presented on TradingView is provided to Tradu (‘Company’, ‘we’) by a third-party provider (‘TFA Global Pte Ltd’). Please be reminded that you are solely responsible for the trading decisions on your account. Any information and/or content is intended entirely for research, educational and informational purposes only and does not constitute investment or consultation advice or investment strategy. The information is not tailored to the investment needs of any specific person and therefore does not involve a consideration of any of the investment objectives, financial situation or needs of any viewer that may receive it. Past performance is not a reliable indicator of future results. Actual results may differ materially from those anticipated in forward-looking or past performance statements. We assume no liability as to the accuracy or completeness of any of the information and/or content provided herein and the Company cannot be held responsible for any omission, mistake nor for any loss or damage including without limitation to any loss of profit which may arise from reliance on any information supplied by TFA Global Pte Ltd.

GBPUSD H4 | Could The Cable Reverse From Here?Momentum: Bearish
The price has rejected off the sell entry, which is a pullback resistance.
Sell entry: 1.3260
Pullback resistance
Slightly below the 127.2% Fibonacci extension.
Stop loss: 1.3322
Pullback resistance
161.8% Fibonacci extension
Take profit: 1.3176
Pullback support
38.2% Fibonacci retracement
High Risk Investment Warning
Stratos Markets Limited (tradu.com ), Stratos Europe Ltd (tradu.com ):
CFDs are complex instruments and come with a high risk of losing money rapidly due to leverage. 70% of retail investor accounts lose money when trading CFDs with this provider. You should consider whether you understand how CFDs work and whether you can afford to take the high risk of losing your money.
Stratos Global LLC (tradu.com ): Losses can exceed deposits.
Please be advised that the information presented on TradingView is provided to Tradu (‘Company’, ‘we’) by a third-party provider (‘TFA Global Pte Ltd’). Please be reminded that you are solely responsible for the trading decisions on your account. Any information and/or content is intended entirely for research, educational and informational purposes only and does not constitute investment or consultation advice or investment strategy. The information is not tailored to the investment needs of any specific person and therefore does not involve a consideration of any of the investment objectives, financial situation or needs of any viewer that may receive it. Past performance is not a reliable indicator of future results. Actual results may differ materially from those anticipated in forward-looking or past performance statements. We assume no liability as to the accuracy or completeness of any of the information and/or content provided herein and the Company cannot be held responsible for any omission, mistake nor for any loss or damage including without limitation to any loss of profit which may arise from reliance on any information supplied by TFA Global Pte Ltd.

GBP/USD for USD-Weakness, Part IIIn my last GBP/USD post I shared how Cable was looking to be one of the more attractive major pairs for USD-weakness. That showed up in a big way today with a strong breakout to fresh monthly highs. And while EUR/USD is finally joining in on the rally, or trying to with its own fresh high, GBP/USD is still showing stronger bullish structure and this remains a more attractive backdrop for bearish USD-continuation.
The big level for support in pullback scenarios is the 1.3250 level, which was prior resistance and also previous support. For topside continuation, it's the Fibonacci level at 1.3414 that stands out, after which the 1.3500 psychological level stands as a major line in the sand. - js

China50 rallies continue to attract sellers.CHN50 - 24h expiry
The overnight rally has been sold into and there is scope for further bearish pressure going into this morning.
We are trading at oversold extremes.
Levels close to the 61.8% pullback level of 15226 found sellers.
15239 has been pivotal.
Bespoke resistance is located at 15250.
We look to Sell at 15215 (stop at 15335)
Our profit targets will be 14855 and 14755
Resistance: 15050 / 15212 / 15253
Support: 14978 / 14850 / 14767
Risk Disclaimer
The trade ideas beyond this page are for informational purposes only and do not constitute investment advice or a solicitation to trade. This information is provided by Signal Centre, a third-party unaffiliated with OANDA, and is intended for general circulation only. OANDA does not guarantee the accuracy of this information and assumes no responsibilities for the information provided by the third party. The information does not take into account the specific investment objectives, financial situation, or particular needs of any particular person. You should take into account your specific investment objectives, financial situation, and particular needs before making a commitment to trade, including seeking, under a separate engagement, as you deem fit.
You accept that you assume all risks in independently viewing the contents and selecting a chosen strategy.
Where the research is distributed in Singapore to a person who is not an Accredited Investor, Expert Investor or an Institutional Investor, Oanda Asia Pacific Pte Ltd (“OAP“) accepts legal responsibility for the contents of the report to such persons only to the extent required by law. Singapore customers should contact OAP at 6579 8289 for matters arising from, or in connection with, the information/research distributed.

GU Rebounds Impressively, but the Uptrend Isn’t “Locked In” YetHello everyone, the recovery of GBPUSD in today’s session is offering several positive signals, but confirming a new bullish trend still requires more solid evidence. After a strong bounce from the 1.3150–1.3170 FVG — which aligns with the bottom of the Ichimoku cloud — the pound is showing that short-term demand remains intact and buyers have not stepped aside.
The news landscape is also favouring GBP, with UK manufacturing PMI outperforming expectations, while the USD lacks momentum as markets continue pricing in the possibility of a mild Fed pivot at the end-month meeting. US yields moving sideways and the DXY staying capped below 100 further support the recovery in major currency pairs, with GBPUSD among the biggest beneficiaries.
Even so, the upward move still faces an important test. Price is approaching 1.3235–1.3250 — an area stacked with old FVGs and the stopping point of last week’s rally. This region has historically attracted strong seller activity, meaning the reaction here will determine whether this rebound is merely technical or the start of a more sustainable bullish trend.

USDJPY: Bullish Push to 158?FX:USDJPY is eyeing a bullish continuation on the 4-hour chart , with price bouncing off an upward trendline near key support, converging with cumulative long liquidation levels that could fuel upside momentum if buyers push through short-term resistance. This setup indicates a potential rally opportunity amid recent consolidation, targeting higher levels with solid risk-reward.🔥
Entry between 155.2–155.8 for a long position. Target at 157.7 . Set a stop loss at a daily close below 155 to limit exposure, yielding a risk-reward ratio of approximately 1:2.5 . Monitor for confirmation via a bullish candle close above entry with increasing volume, capitalizing on the pair's ongoing uptrend.🌟
Fundamentally , USDJPY is consolidating below 157.88 in late November 2025, with the yen weakening amid Bank of Japan signals of potential rate hikes, though momentum favors USD strength from reduced Fed cut expectations and persistent dip-buying. Forecasts point to volatility with upside potential to 158-160 if resistance breaks, driven by diverging central bank policies and global risk sentiment. 💡
📝 Trade Setup
🎯 Entry (Long):
155.2 – 155.8
🎯 Target:
• 157.7
❌ Stop Loss:
• Daily close below 155
⚖️ Risk-to-Reward:
• Approx. 1:2.5
👇 Drop your thoughts below! 👇

EURGBP: Market of Buyers
The price of EURGBP will most likely increase soon enough, due to the demand beginning to exceed supply which we can see by looking at the chart of the pair.
Disclosure: I am part of Trade Nation's Influencer program and receive a monthly fee for using their TradingView charts in my analysis.
❤️ Please, support our work with like & comment! ❤️

AUDNZD: Long Signal Explained
AUDNZD
- Classic bullish setup
- Our team expects bullish continuation
SUGGESTED TRADE:
Swing Trade
Long AUDNZD
Entry Point - 1.1432
Stop Loss - 1.1424
Take Profit - 1.1446
Our Risk - 1%
Start protection of your profits from lower levels
Disclosure: I am part of Trade Nation's Influencer program and receive a monthly fee for using their TradingView charts in my analysis.
❤️ Please, support our work with like & comment! ❤️

GBPJPY LOCAL SHORT|
✅GBPJPY is extending into a premium pocket after displacing above the short-term high, and a corrective swing is likely to draw back toward the inefficiency below. I expect a clean retest of the supply rejection before the next leg into the target zone.Time Frame 4H
LONG🚀
✅Like and subscribe to never miss a new idea!✅

GBPCAD RISKY SHORT|
✅GBPCAD price is tapping into a premium supply pocket after a displacement leg, with algorithmic orderflow hinting at a corrective retrace. A clean retest of the imbalance window is likely before any expansion lower toward target liquidity. Time Frame 2H.
SHORT🔥
✅Like and subscribe to never miss a new idea!✅

USDJPY | H4 | OutlookLooking at USDJPY I’ve noticed that price has finally broken out of the previous strong uptrend and broke below 156.xxx and pushed down to around 155.xxx before going back to retest the 156.xxx level thus giving us a new resistance at our previous 156.xxx level.
Looking forward I can expect that once price breaks bellow 155 and closes bellow that level I’ll be looking for new bearish opportunities to ride out all the way to my next expected major support at around 149.xxx.

GBP-USD Correction Ahead! Sell!
Hello,Traders!
GBPUSD made a nice strong bullish move up and is now pulling back into the mitigation area, where I expect a retest before a correction lower toward the new liquidity pocket.
Sell!
Comment and subscribe to help us grow!
Check out other forecasts below too!
Disclosure: I am part of Trade Nation's Influencer program and receive a monthly fee for using their TradingView charts in my analysis.

AUDUSD BULLISH BREKAOUT|LONG|
✅AUDUSD has broken through the demand ceiling, leaving a clean displacement and forming a fresh FVG. A controlled pullback into the breakout imbalance is likely before the next liquidity sweep toward the target zone. Time Frame 7H
LONG🚀
✅Like and subscribe to never miss a new idea!✅

NZDCHF FREE SIGNAL|SHORT|
✅NZDCHF taps into the higher-timeframe supply and shows displacement, suggesting a short-term drawdown toward the nearest liquidity pocket before any reversal impulse forms.
—————————
Entry: 0.4650
Stop Loss: 0.4659
Take Profit: 0.4634
Time Frame: 7H
—————————
SHORT🔥
✅Like and subscribe to never miss a new idea!✅

EUR-USD Strong Trendline! Buy!
Hello,Traders!
EURUSD is respecting the rising trendline, with price pulling back to sweep short-term liquidity before a potential bullish continuation toward the target zone. Time Frame 2H.
Buy!
Comment and subscribe to help us grow!
Check out other forecasts below too!
Disclosure: I am part of Trade Nation's Influencer program and receive a monthly fee for using their TradingView charts in my analysis.

AUDNZD: Expecting Bearish Continuation! Here is Why:
The charts are full of distraction, disturbance and are a graveyard of fear and greed which shall not cloud our judgement on the current state of affairs in the AUDNZD pair price action which suggests a high likelihood of a coming move down.
Disclosure: I am part of Trade Nation's Influencer program and receive a monthly fee for using their TradingView charts in my analysis.
❤️ Please, support our work with like & comment! ❤️

AUDCAD: Long Trade Explained
AUDCAD
- Classic bullish formation
- Our team expects growth
SUGGESTED TRADE:
Swing Trade
Buy AUDCAD
Entry Level - 0.9188
Sl - 0.9176
Tp - 0.9210
Our Risk - 1%
Start protection of your profits from lower levels
Disclosure: I am part of Trade Nation's Influencer program and receive a monthly fee for using their TradingView charts in my analysis.
❤️ Please, support our work with like & comment! ❤️

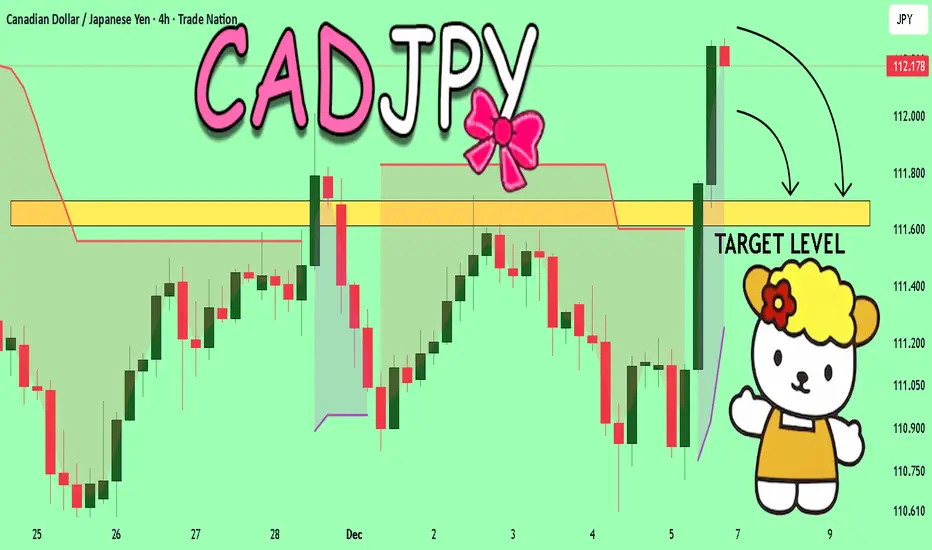
CADJPY The Target Is DOWN! SELL!
My dear friends,
CADJPY looks like it will make a good move, and here are the details:
The market is trading on 112.19 pivot level.
Bias - Bearish
Technical Indicators: Supper Trend generates a clear short signal while Pivot Point HL is currently determining the overall Bearish trend of the market.
Goal - 111.69
About Used Indicators:
Pivot points are a great way to identify areas of support and resistance, but they work best when combined with other kinds of technical analysis
Disclosure: I am part of Trade Nation's Influencer program and receive a monthly fee for using their TradingView charts in my analysis.
———————————
WISH YOU ALL LUCK
EURUSD Technical Analysis! BUY!
My dear followers,
This is my opinion on the EURUSD next move:
The asset is approaching an important pivot point 1.1643
Bias - Bearish
Safe Stop Loss - 1.1635
Technical Indicators: Supper Trend generates a clear short signal while Pivot Point HL is currently determining the overall Bearish trend of the market.
Goal - 1.1658
About Used Indicators:
For more efficient signals, super-trend is used in combination with other indicators like Pivot Points.
Disclosure: I am part of Trade Nation's Influencer program and receive a monthly fee for using their TradingView charts in my analysis.
———————————
WISH YOU ALL LUCK

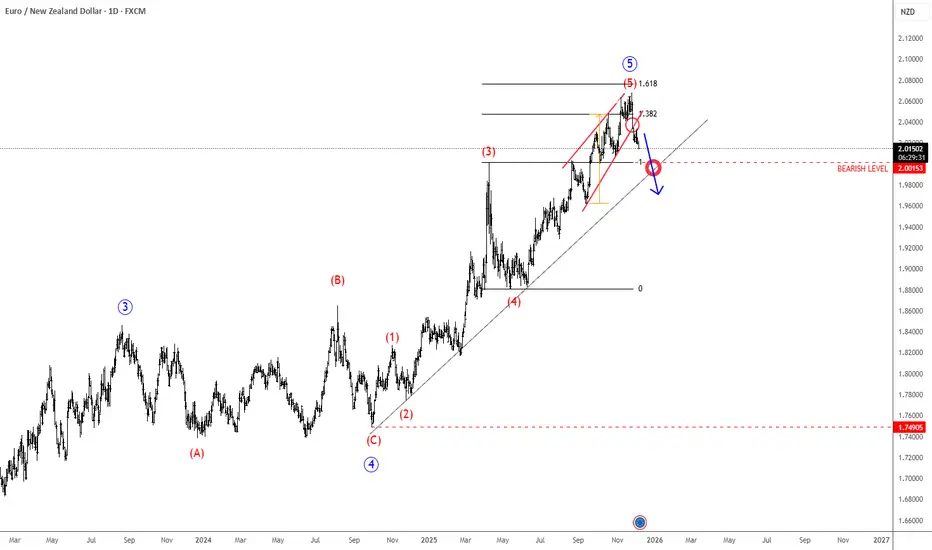
EURNZD May Have ToppedEUR is coming sharply to the upside against NZD, hitting new highs, however, looking at the wave structure, we still see the market is in a fifth wave, but it appears that this wave five has a much more extended structure than initially expected. Still, it looks like the final leg of the impulse up from the 1.7490, with the shape of a wedge now at the top, with potential reversal happening as prices comes down from a wedge, signals more weakness, especially if slips back below 2.00 level.
USDJPY Breakout Below Key Support – Bearish Momentum BuildingUSDJPY – Key Levels Breakdown & Breakout Outlook
Price has been consolidating within a tight range, and today we finally saw a clean breakout below the red support zone, signaling potential bearish momentum. The market rejected the strong support area above (highlighted in green), confirming sellers are in control for now.
🔍 Key Zones to Watch
Breakout Zone (Red): Recently broken. Price is now trading just below it, showing early signs of continuation.
Strong Support (Green): Previous demand zone where price repeatedly bounced. Now acting as a potential retest level if price pulls back.
Strong Resistance (Yellow): A deeper downside target if bearish momentum continues.
Breakout Target Area (Upper Green): If buyers regain control, this is the zone price may revisit.
📌 Trading Outlook
Bearish bias as long as price stays below the breakout zone.
A retest rejection at the red zone could offer a clean continuation setup.
If buyers push price back above the breakout level, we may see a move toward the strong support or even the breakout target area above.
