GBP/USD — Technical Analysis....GBP/USD — Technical Analysis Targets (Based on My Chart)
My chart shows:
Timeframe: 4H
Tools: Ichimoku Cloud, support/resistance zones, and your projected bearish path (blue line).
Price currently around: 1.3300 area
Price is inside a higher‐timeframe supply zone (green region).
From what’s visible, the market structure suggests:
---
📌 Key Levels & Target Zones
🔹 Immediate Resistance (Supply Zone)
1.3330 – 1.3350
Price is testing this upper supply area. This is where my projection shows a rejection.
---
🔹 First Bearish Target (Near-term Support)
1.3230 – 1.3200
This is the highlighted small support block in the middle of the chart. If price rejects from the top, this is the first logical pullback target.
---
🔹 Breakpoint Level
1.3170
You marked this red zone beneath the Ichimoku cloud.
A clean break below 1.3170 likely confirms bearish continuation.
---
🔹 Major Bearish Target (Demand Zone)
1.3050 – 1.3000
This is the large pink demand zone at the bottom of the chart.
My arrow also points to this region.
This would be the full target for the downside move.
---
📉 Summary of Bearish Targets
Target Price Zone Notes
TP1 1.3230 – 1.3200 Minor support, first reaction zone
TP2 1.3170 Key break level
TP3 1.3050 – 1.3000 Major demand zone, full bearish target
---
📈 What To Watch
Rejection candle around 1.3330–1.3350
Kumo breakdown below cloud support
Chikou Span confirming bearish momentum (not fully visible but implied)
M-forex

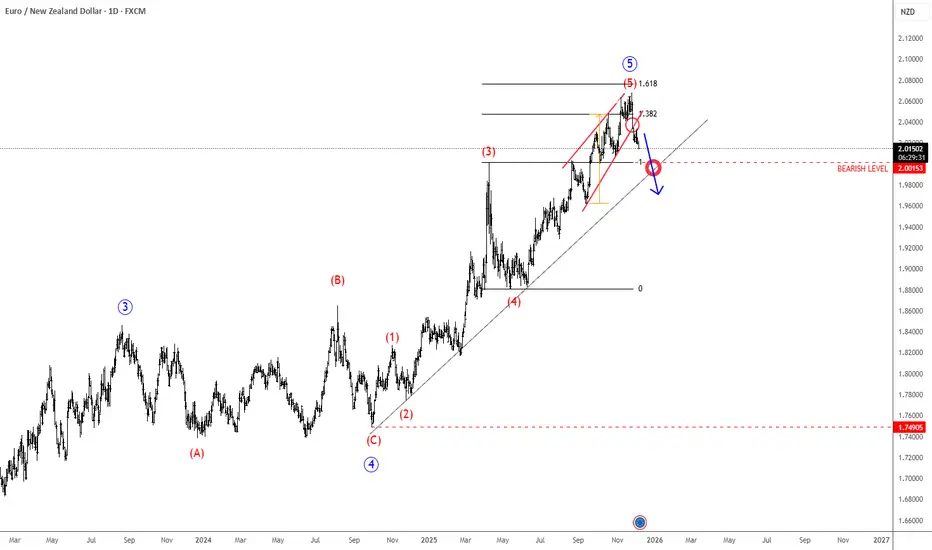
EURNZD May Have ToppedEUR is coming sharply to the upside against NZD, hitting new highs, however, looking at the wave structure, we still see the market is in a fifth wave, but it appears that this wave five has a much more extended structure than initially expected. Still, it looks like the final leg of the impulse up from the 1.7490, with the shape of a wedge now at the top, with potential reversal happening as prices comes down from a wedge, signals more weakness, especially if slips back below 2.00 level.
USDJPY Breakout Below Key Support – Bearish Momentum BuildingUSDJPY – Key Levels Breakdown & Breakout Outlook
Price has been consolidating within a tight range, and today we finally saw a clean breakout below the red support zone, signaling potential bearish momentum. The market rejected the strong support area above (highlighted in green), confirming sellers are in control for now.
🔍 Key Zones to Watch
Breakout Zone (Red): Recently broken. Price is now trading just below it, showing early signs of continuation.
Strong Support (Green): Previous demand zone where price repeatedly bounced. Now acting as a potential retest level if price pulls back.
Strong Resistance (Yellow): A deeper downside target if bearish momentum continues.
Breakout Target Area (Upper Green): If buyers regain control, this is the zone price may revisit.
📌 Trading Outlook
Bearish bias as long as price stays below the breakout zone.
A retest rejection at the red zone could offer a clean continuation setup.
If buyers push price back above the breakout level, we may see a move toward the strong support or even the breakout target area above.

BITCOIN BUYBtcusd looking to scalp into a quick trade using a buy stop as bitcoin will have to return to its previous price point, as it cannot sell forever.

BUY STOP EURJPYEurjpy previously missed our orders by a few points and didn’t trigger the trade , however now we shall use a buy stop to make up for the missed trade

GBPJPY: Bearish Forecast & Outlook
The price of GBPJPY will most likely collapse soon enough, due to the supply beginning to exceed demand which we can see by looking at the chart of the pair.
Disclosure: I am part of Trade Nation's Influencer program and receive a monthly fee for using their TradingView charts in my analysis.
❤️ Please, support our work with like & comment! ❤️

GOLD: Short Trade with Entry/SL/TP
GOLD
- Classic bearish formation
- Our team expects pullback
SUGGESTED TRADE:
Swing Trade
Short GOLD
Entry - 4234.9
Sl - 4245.4
Tp - 4216.4
Our Risk - 1%
Start protection of your profits from lower levels
Disclosure: I am part of Trade Nation's Influencer program and receive a monthly fee for using their TradingView charts in my analysis.
❤️ Please, support our work with like & comment! ❤️

EURCAD Expected Growth! BUY!
My dear subscribers,
This is my opinion on the EURCAD next move:
The instrument tests an important psychological level 1.6182
Bias - Bullish
Technical Indicators: Supper Trend gives a precise Bullish signal, while Pivot Point HL predicts price changes and potential reversals in the market.
Target - 1.6228
About Used Indicators:
On the subsequent day, trading above the pivot point is thought to indicate ongoing bullish sentiment, while trading below the pivot point indicates bearish sentiment.
Disclosure: I am part of Trade Nation's Influencer program and receive a monthly fee for using their TradingView charts in my analysis.
———————————
WISH YOU ALL LUCK

NZDJPY Buyers In Panic! SELL!
My dear friends,
Please, find my technical outlook for NZDJPY below:
The instrument tests an important psychological level 89.694
Bias - Bearish
Technical Indicators: Supper Trend gives a precise Bearish signal, while Pivot Point HL predicts price changes and potential reversals in the market.
Target - 89.517
Recommended Stop Loss - 89.787
About Used Indicators:
Super-trend indicator is more useful in trending markets where there are clear uptrends and downtrends in price.
Disclosure: I am part of Trade Nation's Influencer program and receive a monthly fee for using their TradingView charts in my analysis.
———————————
WISH YOU ALL LUCK

XAUUSD Long: The 4,160 Support Holds – Path to 4,260 is OpenHello, traders! The price action for XAUUSD is currently developing within a well-defined ascending trend structure, supported by a rising major Trend Line from the lows. The market previously showed multiple rejections from the Triangle Supply Line, each marked by clear breakout attempts followed by corrective pullbacks. These reactions formed a sequence of higher lows, confirming that buyers remain in control of the broader structure.
Currently, after the last strong impulsive move upward, Gold reacted from the Supply Zone around 4,260, forming a short-term corrective phase while respecting the rising Triangle Demand Line near the 4,160 demand level. Price is now compressing between the descending supply line and the ascending demand line, creating a tightening triangle structure that signals growing pressure for a directional expansion. This compression reflects a balance between profit-taking sellers at resistance and aggressive dip-buyers along demand.
My scenario for the further development is bullish continuation as long as price holds above the Triangle Demand Line and the 4,160 demand zone. I expect a rebound from current levels, followed by a renewed attack on the 4,260 Supply Zone. If buyers manage to produce a clean breakout above this resistance, Gold may accelerate toward higher targets with strong momentum continuation. However, if the supply zone holds and price breaks below the demand line, a deeper corrective pullback toward the main rising Trend Line could develop. For now, the structure favors buyers, with the key focus on a breakout attempt toward 4,260. Manage your risk!

GBPUSD Will Go Lower From Resistance! Sell!
Please, check our technical outlook for GBPUSD.
Time Frame: 4h
Current Trend: Bearish
Sentiment: Overbought (based on 7-period RSI)
Forecast: Bearish
The price is testing a key resistance 1.333.
Taking into consideration the current market trend & overbought RSI, chances will be high to see a bearish movement to the downside at least to 1.326 level.
P.S
Overbought describes a period of time where there has been a significant and consistent upward move in price over a period of time without much pullback.
Like and subscribe and comment my ideas if you enjoy them!

EUR/USD BEARS WILL DOMINATE THE MARKET|SHORT
Hello, Friends!
EUR/USD is trending down which is evident from the red colour of the previous weekly candle. However, the price has locally surged into the overbought territory. Which can be told from its proximity to the BB upper band. Which presents a beautiful trend following opportunity for a short trade from the resistance line above towards the demand level of 1.158.
Disclosure: I am part of Trade Nation's Influencer program and receive a monthly fee for using their TradingView charts in my analysis.
✅LIKE AND COMMENT MY IDEAS✅

Gold price analysis May 12Gold continues to maintain an impressive upward momentum in today's session, showing that the bulls are still in control of the market and the immediate target is heading straight towards the 429x resistance zone in the US session. At the moment, BUY setups continue to be the main strategy, as long as the bullish structure is not broken.
Trading plan:
BUY Now: 4220
Buy Trigger: When a price rejection signal appears at the support zones 4170 - 4195 - 4115
Target: 4290
Risk: The trend will weaken if the H4 candle closes below the trendline at 4170. If this happens, it is necessary to pay special attention to the next large trendline zone around 4115.
The trend is still favorable for the buyers, so prioritize BUY entry points until the bullish structure is clearly broken.

A lil bit of UJ analysisHere is a bit of UJ analysis for the purpose of educating on how price moves through the matrix.
I cover aspects of liquidity and efficiency.
I hope you find it useful.
- R2F Trading

ForexNickx | Institutional Buy ZoneXAUUSD is currently respecting a key institutional footprint. After sweeping liquidity at the recent lows, price has shifted market structure, confirming that smart money is stepping in.
⚠️ Important Note:
This setup is based on my proprietary algo-strategy, which gives precise entries before the crowd sees them. I have already shared the exact entry price and stop-loss with my private members.
Why this setup matters:
We are seeing a clear rejection of the lower trendline, which aligns perfectly with the institutional demand zone. The consolidation we are witnessing now is likely re-accumulation before the next impulsive move upward.
Technical Confluence:
🐂 Structure: Break of Structure (BOS) to the upside is imminent.
🌊 Liquidity: Sell-side liquidity has been swept; buyers are in control.
🧱 Demand: Price is holding firmly above the psychological support level.
📈 Trade Plan:
As long as price holds above the trendline support, the bias remains heavily bullish. We are looking for a breakout above the immediate consolidation range.
Targets:
🎯 Target 1: 4,230
🎯 Target 2: 4,275
Traders, are you riding with the institutions? Let me know in the comments! 👇

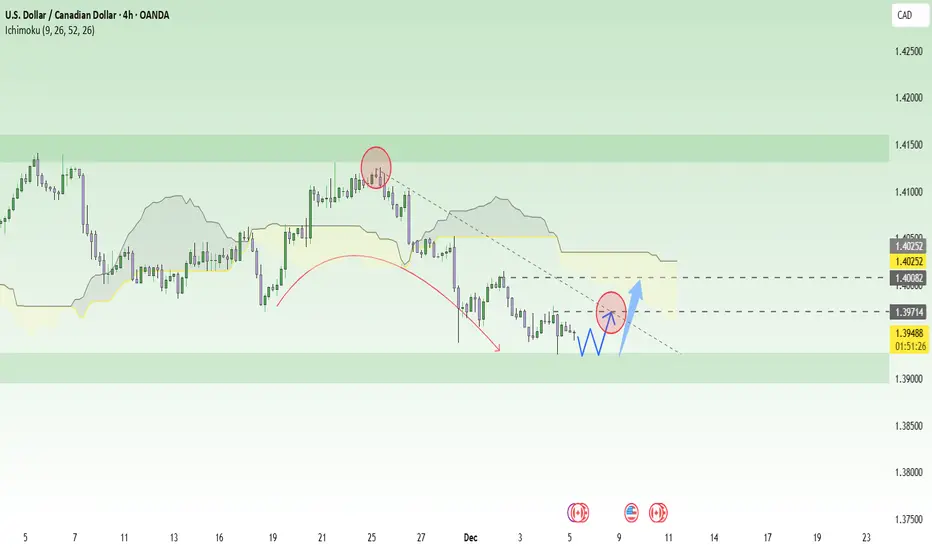
USDCAD – A “Soft Rebound” Forming at Defensive SupportUSDCAD is currently caught between two weak forces . On one side, the USD is losing momentum as markets almost fully expect the Fed to cut rates soon ; on the other side, the CAD isn’t strong either as Canada’s manufacturing data continues to weaken. These opposing forces neutralize each other, preventing a strong trend—but they do create room for a mild technical rebound from the current support zone.
On the H4 chart, USDCAD has slipped out of its upper consolidation range and gradually moved toward the support area around 1.3920, a level where price has reacted strongly multiple times before. The decline is slowing, with candles showing reduced volatility—signs that selling pressure is fading . Above, the zone around 1.3970, aligned with the lower edge of the Ichimoku cloud and the descending trendline, becomes a reasonable upside target for a rebound.
Preferred scenario: USDCAD may continue to test the floor near 1.3920, form a small accumulation pattern, then bounce for a light recovery toward 1.3970, possibly even sweeping slightly higher toward the cloud if USD sentiment stabilizes. However, this remains only a corrective move within a broader weakening structure. Therefore, the optimal approach is to look for short-term buys at support , take profits early at nearby resistance, and maintain strict risk management in a macro environment that remains highly uncertain.
NZDCAD Will Move Lower! Short!
Here is our detailed technical review for NZDCAD.
Time Frame: 1h
Current Trend: Bearish
Sentiment: Overbought (based on 7-period RSI)
Forecast: Bearish
The market is approaching a key horizontal level 0.805.
Considering the today's price action, probabilities will be high to see a movement to 0.803.
P.S
We determine oversold/overbought condition with RSI indicator.
When it drops below 30 - the market is considered to be oversold.
When it bounces above 70 - the market is considered to be overbought.
Like and subscribe and comment my ideas if you enjoy them!

EURUSD Review December 5 2025Short-term price movement ideas.
The price is currently located within a weekly zone of interest, where it has swept several daily highs, which may trigger a potential downside move. After the daily sweep, we received 4H confirmation, which now serves as the main zone to work from. If this zone receives additional confirmation on the 1H timeframe, a short position can be considered with the target of reaching the daily long FVG.
Be flexible, adapt to the market, and the results will come quickly. Good luck to everyone.

GOLD ANALYSIS 12/05/20251. Fundamental Analysis
a) Economy
• USD:
The USD is weakening as the market expects the Fed to maintain its dovish, rate-cut stance in December.
• U.S. Stocks:
U.S. equities are rising on expectations of rate cuts in late 2025, but the rally lacks sustainability due to weak liquidity.
U.S. bond yields are slightly declining → easing pressure on gold.
This creates a mild risk-on environment, but not enough to push gold down strongly.
• Fed:
The Fed remains dovish, with a high probability of rate cuts in Q1/2026 → supportive for gold.
Recent Fed members’ comments lean toward “monitoring but not tightening,” further reducing pressure on precious metals.
• Trump Administration:
The Trump administration is focusing on domestic production support and corporate tax cuts.
However, tensions stirred by Trump in Venezuela and the Middle East provide geopolitical risk that supports gold.
• Gold ETF (SPDR):
SPDR bought an additional 4 tons yesterday → highest reserves in the past 2 months.
This is a strong bullish signal, indicating large capital inflows returning to the gold market.
b) Politics
The Middle East remains tense.
Venezuela – U.S. – China are experiencing conflicting strategic interests.
Escalating tensions push the market toward safe-haven assets → supportive for gold.
c) Market Sentiment
Mild risk-off: defensive flows are increasing, especially as USD weakens and SPDR buys more gold.
Investors are waiting for tomorrow’s Nonfarm Payroll data → gold likely to remain in a tight sideways range like recent sessions.
2. Technical Analysis
• Overall trend:
Gold is compressing within a short-term triangular consolidation pattern.
Short-term MAs are converging → market preparing for a strong breakout.
• Scenarios:
Scenario 1 – Bullish (Primary expectation):
Break above 4239 → 4263
→ Target: 4320
→ If 4320 breaks → price may reach a new all-time high.
Scenario 2 – Bearish deeper correction:
If price breaks 4174 → it may drop to 4120, aligning with the long-term rising trendline.
Scenario 3 – Sideways (likely before Nonfarm):
Price continues moving within the consolidation triangle
→ corresponds to weak liquidity this week.
RESISTANCE: 4239 – 4263 – 4320
SUPPORT: 4174 – 4163 – 4120
3. Yesterday’s Market (Dec 4, 2025)
Gold dipped slightly then rebounded thanks to ETF buying and a weaker USD.
Narrow trading range → consistent with a “waiting for major news” environment.
No strong selling pressure, suggesting buyers are still in control.
4. Trading Strategy Today (Dec 5, 2025)
🪙 SELL XAUUSD | 4264 – 4262
SL: 4268
TP1: 4256
TP2: 4250
🪙 BUY XAUUSD | 4182 – 4184
SL: 4178
TP1: 4190
TP2: 4196

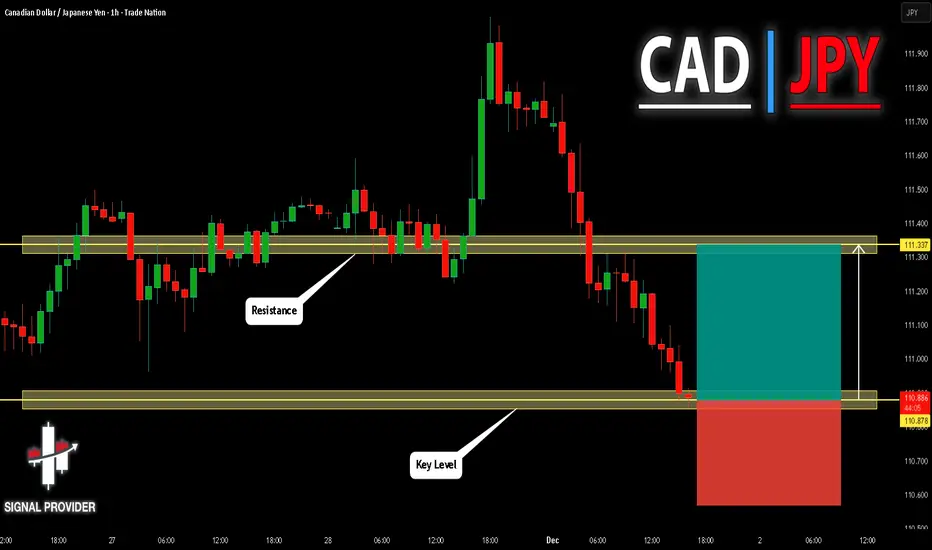
CADJPY Will Go Up From Support! Long!
Please, check our technical outlook for CADJPY.
Time Frame: 1h
Current Trend: Bullish
Sentiment: Oversold (based on 7-period RSI)
Forecast: Bullish
The market is approaching a significant support area 110.878.
The underlined horizontal cluster clearly indicates a highly probable bullish movement with target 111.337 level.
P.S
Please, note that an oversold/overbought condition can last for a long time, and therefore being oversold/overbought doesn't mean a price rally will come soon, or at all.
Like and subscribe and comment my ideas if you enjoy them!
CHF/JPY BUYERS WILL DOMINATE THE MARKET|LONG
CHF/JPY SIGNAL
Trade Direction: long
Entry Level: 192.579
Target Level: 193.023
Stop Loss: 192.284
RISK PROFILE
Risk level: medium
Suggested risk: 1%
Timeframe: 1h
Disclosure: I am part of Trade Nation's Influencer program and receive a monthly fee for using their TradingView charts in my analysis.
✅LIKE AND COMMENT MY IDEAS✅

Bearish Structure and Short SetupYesterday, price action did not unfold as I anticipated. However, today the market has developed a new bearish internal structure after taking out the daily weak higher high (HH). This shift signals a potential counter-pullback and suggests that momentum is turning to the downside.
To align with this emerging trend, I will be looking for short opportunities, confirmed on the 15-minute timeframe. If the bearish confirmation holds, it could provide a favorable setup to capitalize on the continuation of downward pressure.

The Market Doesn’t Wait — But Winners Don’t Hesitate.The market has transitioned into a short-term bearish cycle after sweeping the buy-side liquidity above 4243. A clean CHoCH → BOS sequence confirms the shift from bullish displacement into redistribution, signaling bearish orderflow dominance.
📌 1. CURRENT TREND — MARKET STRUCTURE
The chart is showing a short-term bearish structure on H1 because:
- After forming a HH, price broke the previous low → BOS to the downside.
- Current structure: LH → LL → LH → minor HL → LL.
- Price is heading toward the 4,181 – 4,163 support zone, which is a major structure low.
➡️ H1 trend: short-term bearish (deep pullback)
➡️ Higher-timeframe trend (H4/D1): still bullish → this drop is a corrective move.
📌 2. KEY LEVELS — SUPPORT & RESISTANCE
Main Resistance
- 4,225 — previous swing high and key liquidity target.
Major Support Zones
- 4,181 — mid-range support, likely first reaction point.
- 4,163 — key structure low; strong zone where a new HL may form.
📌 3. MAIN SCENARIOS
Scenario 1 (Primary Scenario): Price taps 4,181 → small sweep → pushes up
Price may form a small internal LL/HL pattern near 4,181.
Potential for liquidity sweep / double bottom.
If price confirms, it will push back toward:
- 4,200
- 4,215
- Main target: 4,225
➡️ This aligns with the higher-timeframe bullish trend + H1 pullback.
Scenario 2 (Cleanest & Highest RR): Price sweeps 4,163 then reverses
- A strong liquidity grab around 4,163 forms a major HL.
- This is where smart money typically accumulates positions.
- A bullish BOS afterward confirms the reversal on H1.
➡️ Best risk-to-reward setup.
📌 4. ENTRY – SL – TP
🎯 ENTRY 1: 4,181 – 4,185 (after rejection/confirmation)
SL: below 4,172
TP1: 4,200
TP2: 4,215
TP3: 4,225
🎯 ENTRY 2 (safer, high RR): 4,163 – 4,168
SL: below 4,150
TP1: 4,185
TP2: 4,200
TP3: 4,225
📌 5. SUMMARY
H1 structure is bearish, but it is simply a deep pullback inside a bullish higher-timeframe trend.
The best long setups are at 4,181 and 4,163.
Once a new HL forms, bullish continuation targets 4,225.
Every pullback is a chance — not a punishment. Stay patient, trust your structure, and execute like a pro.
