REPBTC Broadening Wedge| Structural Resistance| 200 MAEvening Traders!
Today’s technical analysis will focus on REPBTC, in a valid broadening wedge formation with a failed partial raise at structural resistance.
Points to consider,
- Trend bearish – consecutive lower highs
- Structural resistance being tested
- 200 MA – local support
- RSI trading in a channel
- Stochastics in upper regions
- Irregular volume present
Augur is in a clear defined down trend on the macro scale and is travelling in a broadening wedge that will be confirmed with a break of its ascending support line.
The current local support is being established by the 200 MA, a break of this will be in confluence with a break of the broadening wedge.
Staunched structural resistance has been respected multiple times; it is in confluence with the .382 Fibonacci. A close above and consolidation will likely test the upper resistance line of the broadening wedge.
The RSI is in a clear channel, currently neutral, breaking this channel will dictate the direction of the price. Stochastics are currently in the upper regions, can stay trading here for an extended period of time, however lots of stored momentum to the downside.
Augur has irregular volume being present, common in broadening wedge patterns , an influx will be prevalent with a decisive break.
Overall, in my opinion, Augur needs to consolidate above structural resistance and create multiple higher lows to negate this pattern. A break of lower support line will however increase the likelihood of testing lower lows.
What are your thoughts?
Please leave a like and comment,
And remember,
“If you can learn to create a state of mind that is not affected by the market’s behaviour, the struggle will cease to exist.” – Mark Douglas
M-formation
ETC/USD - ETC LIKELY TO BREAK OUTHello everybody!
Today I stumbled over the ETC/USD chart and saw this lovely Ascending Broadening Channel with an Ascending Channel Inside.
It looks like an easy profit if the market continues upwards for a few days more as minimum.
Bitcoin SV/USD just broke its formation strongly yesterday and it looks like DASH/USD could break its formation today.
The Formations/Lines:
- The big Primary formation is an Ascending Broadening Channel ( Purple lines )
- The Secondary formation is an Ascending Channel ( Orange Lines )
- The green line is Horizontal Resistance Line. If ETC close above it, it is bullish and a sign of a try to break the formation to the upside.
- Where the Purple and Orange lines meet is likely where we will find out what way ETC is going. So within 1-3 days.
- Below the formation, we got 2 lines showing the last Strong Resistance/Support zone for ETC/USD
Indicators/technicals/market:
RSI: Pointing upwards, seems to have found support, if ETC breaks the green line and stays over it we will see the RSI crossing over to the upside. ( bullish )
-Stoch: Pointing downwards inside the "control zone" . If ETC again stay over the green support/resistance line the Stoch will turn up and there is room to grow. ( bullish ) But as it is now it is bearish while under the green line.
- Historical Volatility: Falling, but room to move up, just around the last horizontal point of support. It may likely find support and start expanding. (rating 48ish )
- The general market trend is UP ( bullish ) and can continue like this if the market wants it.
Analysis:
- If ETC stays below the green line for a few days longer it is more likely we see sideways movement for longer time or a Pretty big drop in price. But right now the market is still bullish and ETC has had some days to consolidate so continued sideways movement much longer is not likely. We should everything taken into consideration included the RSI and Stoch indicators see a strong move to the UP side or DOWN side =) The side of the movement depends if the market keeps going up or down I would say. We could get a big pullback on bitcoin and all altcoins really soon based on the BTC indicators and Historical Volatility . But we could also go higher before it happens. But it is loser now than since the 7k bitcoin bottom is also a way to say it.
This is for educational analysis only, This is not financial advice, Nobody can predict the future only optimize our odds.
Have a lovely Bullish Sunday everybody =)
I hope someone finds benefit in my analysis!
Confucius
-------------------------------------------------------------------------------------------------------------------------------------------------------------------------------
My DASH Breakout Idea - ACTIVE
USDCAD Reversal Pattern FormingUCAD is forming a rising wedge reversal pattern. Price is starting to slow down which gives us an indication that we may soon reverse. Based on previous reversals for this pair it typically makes multiple rejections at resistance before finally falling. This looks like a really good opportunity next week. If resistance holds we will take a short position. I am not a financial advisor. This is not financial advice. This is for educational purposes only.
JAKS, Moving Averages in Bullish Formation, Waiting for BreakoutThank you for your continued support :)
Strategy: Moving Averages Formation
Bias: Bullish
As seen in the chart, the Year-Line, Half-Year-Line, and Month-Line are moving in bullish formation, while the price is currently in triangle consolidation above key fibonacci level of the long term trend.
Entry: 1.21
Stop-loss: 1.15
1st Target: 1.43
2nd Target: 1.84
Gentle reminder: Plan your trade and trade your plan. Peace out!
BASICS TECHNICAL ANALYSIS - TRENDFOLLOW FORMATIONFORMATION ANALYSIS: PRICE PATTERNS AND CHART FORMATIONS
A trend setting of technical analysis is formation analysis. In doing so, certain combinations of movement and correction are considered.
If such a combination is detected, the trader can try to trade the resolution of the formation.
Basically, a different is made between the trend continuation formations and the trend reversal formations.
They are often caused by resistance and support lines.
Trend continuation pattern:
Confirm the strength of a trend. These are, for example, rising / falling triangles. Even flags and pennants (see picture) are seen as a trend continuation.
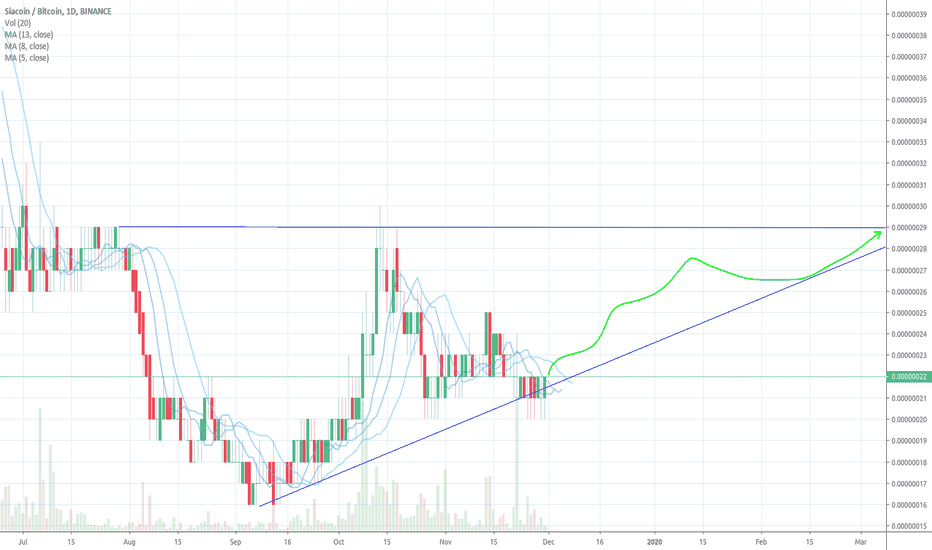
Sia to finish penant bull flag....? Let us know & WIN BIGThis is how Sia will play out until BTC halving in late April (notice i say late April?-Why?, well b/c that is when this will spike, we think ;)
-"ATBT2Y" What does this mean?
First to comment on your opinion for Sia, and correctly gues the 6 digit acrynom, with video or chart stating the next few months of SC and reasons why, on above acrynom gets a crypto holiday treat from us...
i.imgur.com
Whatdya think?
Winner to be announced in 7 days, let the comments begin
BNM
A Structure Above A Structure = Bullish!Looking at the chart above, you can see the original daily structure break to the upside, shown in blue. Then you can see the H4 structure which is forming, shown in green. I have entered the long for wave two on the H4 structure.
Happy Trading
Linton White
JP Markets
South Africa
US 30 Bear Trend; If continuation from bear flag pennantEquities forming a pennant. Usually these are continuation patterns. A measured move down from flagtip would expect to make a bottom half of flag-pole equal to top half, for about 1800+ pips; this would drop index near 24200, or a bit less.
IMO the Megaphone Trend is still dominant. A breakout to upside is still possible if global events magically resolve favorably; this seems doubtful atm. FOMC will likely be too little too late, as usual.
You can see index fell sharply below rising TL, bounced up to retest it, and was rejected. Although another retest is possible, it seems the Bears are gaining traction now.
This alternative Bear Theory to compare & contrast with my earlier pub on a Bullish Reversal. If the Bulls fail this will unwind real fast. Still consolidating- caution is in order!
GTLA trade at your own risk, this isn't advice, just an idea.
NEOBTC Potential Ascending TriangleHello Traders,
Welcome back to another chart, today's chart will be on NEO, formerly known as Ant-Shares, surely a re-brand back?
Points to consider,
- Price testing resistance zone (Red Zone - .382 Fibonacci Zone)
- RSI bouncing of overbought region
- Stochs showing downwards momentum
- EMA's action as support for price at current given time
- Volume is near to none --> Below average
- VPVR is showing low volume of transactions between current resistant zones
NEO could be forming a potential Ascending Triangle which is technically a bullish formation, however this needs to be confirmed with a third touch on the support line. NEO is more probable to retrace from this zone as the RSI is coming of overbought regions, with the stoch's showing downwards momentum, a retracement to the support line is highly probable. If and when NEO breaks out of this current resistant zone, we may see a retest of the .618 Fibonacci Zone quickly as VPVR is showing significantly low volume of transactions between the two zones..
What are your thoughts?
Please leave a like a comment
and remember
"There's no such things as a free lunch"- Milton Friedman
HSBA trending downwards, currently holding supportJust throwing some lines on HSBC (HSBA) .
We have a broadening channel, higher highs and lower lows on a 20 year timeframe.
Currently in a downward trend on the monthly, just about holding historical support.
This would probably be a good place to exit if we are expecting a market downturn.
"These formations are relatively rare during normal market conditions over the long-term" - Investopedia
Bullish pennant formation on USD/TRYDue to Turkish holiday TRY will be traded weakly until Thursday. At these times, values can be more volatile.
We can clearly see the bullish pennant formation on USD/TRY. Tomorrow we have to carefully watch the value. If it will break the pennants resistance, value may go up to 5,62-5,65 channel. We can see that there will be a steep movement from the narrowed bollinger bands.
Parabolic SAR shows the downturn and also moving average does not support the upmove so that we can also expect a steep down move. In case of a down break reaction, we have to watch 5,53 support line.
Good luck all.
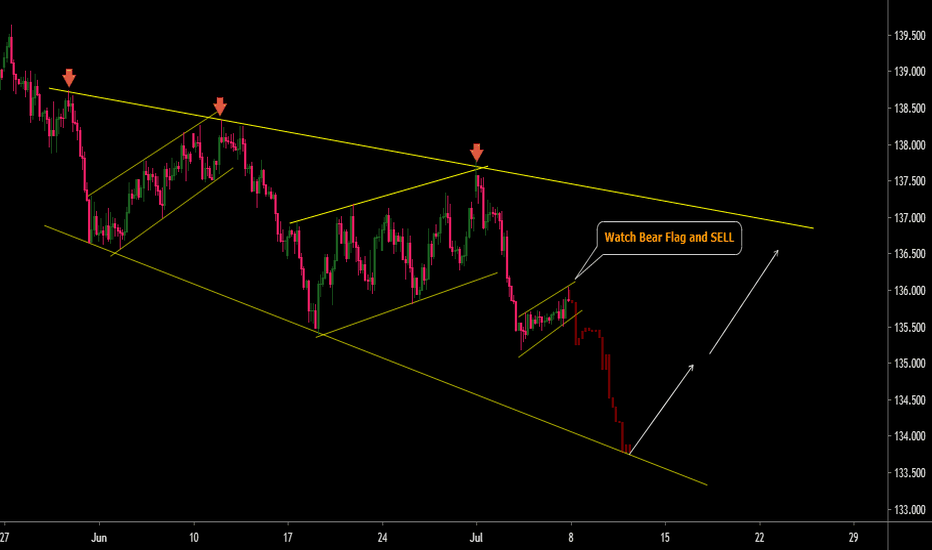
GBP/JPY : Buy and Sell Trade Setups Big Expanding descending Channel or Brod Formation of structure making in GBPJPY. Currently making a Bear flag to Short Term SELL Opportunity .
Buy on Third touch of structure after Confirmation in Lower Time frame -
Let See What Will be Next Move -
Warning- I m Not a Financial Advisor this idea Only For Educational Purpose Only.
Thank You !!


