ZCash Wave Analysis – 21 October 2025
- ZCash reversed from round resistance level 300.00
- Likely to fall to support level 240.00
ZCash cryptocurrency recently reversed down from the resistance area surrounding the round resistance level 300.00 (which stopped the previous impulse wave 1 at the start of October).
The downward reversal from this resistance area formed the daily Japanese candlesticks reversal pattern long-legged Doji.
Given the strength of the resistance level 300.00 and the bearish divergence on the dally Stochastic, ZCash cryptocurrency can be expected to fall to the next support level 240.00.
M-oscillator

$eth 15 min , new york setup 🧠 Session-Based Liquidity & Manipulation
Asia low was swept — liquidity grab confirmed.
Price is now stabilizing above the Alligator, signaling potential reversal.
🐊 Bill Williams Alligator Signal
Alligator is coiling and turning up — bullish awakening in progress.
Price holding above lips/teeth supports long bias.
🎯 Corrected ETHUSD Trade Plan – Long Setup
Entry Zone: 3,846 – 3,850 (retest of Alligator support)
Stop Loss: 3,777 (below recent swing low — as per chart)
TP1: 3,875 (first liquidity above)
TP2: 3,900 (next HTF level & Asia high)
✅ Confirmation Needed:
Bullish candle close above 3,850.
Hold above Alligator lips (~3,840–3,845).
Volume spike on the move up.
Bottom Line:
Asia low taken, manipulation complete.
Alligator supports bullish reversal.
Long above 3,846, stop below 3,777.
— origami_capita133 | TradingView
👉 Like & Follow if this helps your trading. Trade with discipline, not emotion.

The 3 Parts Of The Rocket Booster Strategy The the three parts are simple to remember.
Let me tell you a story.
I still remember the time I broke up with my girlfriend.
I got "Rocket Stocks" by M. Kratter.
I studied that book everyday for about 50 days!
It was not easy.But I wanted to master this skill.
I was deeply sad.
She said "Lubosi am helping you."
WTF - 😡
Well I am now stuck no cash , no hope and no love.
I studied as if this will help me.This was before the pandemic hit the peak months of lockdowns.
Am telling you it was a beast.
Two months pass by this year I start streaming.
I say a small prayer,
" God help me help your people learn how to trade."
Boom 🤯!!!
The Rocket Booster Strategy is boosted.
What is the boost?
20 Day Moving Average.
The price should be below the 20 SMA.
It was right there in our faces and I missed it.
Not only that the price should Touch the support.
Or else it's called a "Random" pattern.
The 3 Parts:
🚀Price above the 50 SMA
🚀Price above the 200 SMA
🚀Price touching support (50 SMA)
🌟 Bonus 🌟
*** Make sure price below 20 SMA
*** High Volume
*** 40 - 60 RSI indicator
That's it 😅
Trade safe.
Rocket boost this content to learn more.
P.S.
The high volume + Earnings Report provides a powerful catalyst.
Disclaimer ⚠️ Trading is risky please learn about risk management and profit taking strategies.
Also feel free to use a simulation trading account before you use real money.

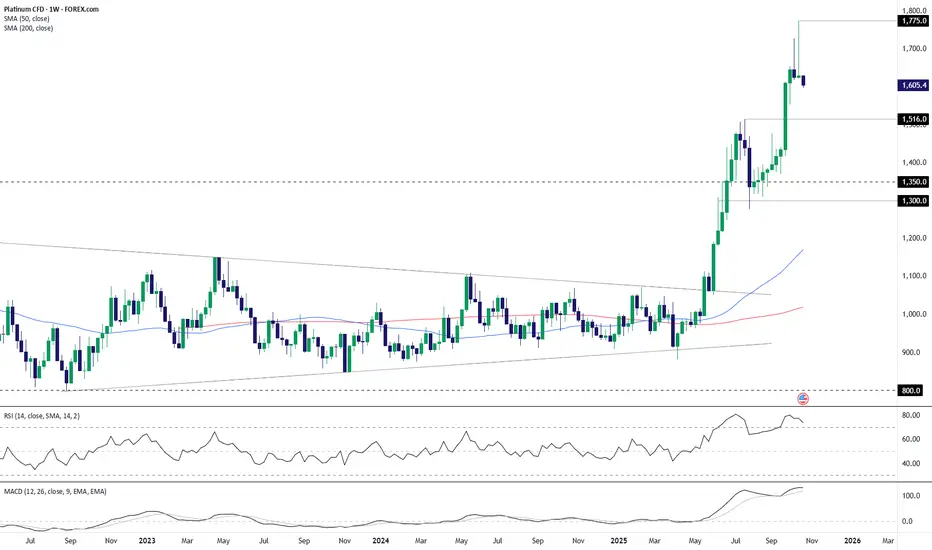
Bearish Key Reversal Puts Platinum Bulls on NoticePlatinum was slaughtered along with every other precious metal on Tuesday, delivering on the risk we flagged 24 hours earlier. Given the scale of the move, the question everyone is now asking is whether that was it? I don’t know personally, but the bearish key reversal candle that printed only adds to the signals from longer timeframes in recent weeks, warning of the potential for more downside to come.
Looking at the price action on the dailies, it’s notable the rout halted Tuesday at $1516—the high that was set in July. That suggests technicals still matter even if some of the selling was likely forced in nature. As such, it’s now the key level to watch when assessing directional risks.
Should $1516 give way, the 50-day moving average is the first point of interest, with $1478 and $1440 other minor levels before more substantive support is found at $1380. Should $1516 hold, $1555, $1675 and $1775 are the levels to watch.
The momentum picture has unsurprisingly shifted quickly as a result of the pullback, with RSI (14) now trending lower beneath 50, indicating increasing downside pressure. MACD has yet to turn outright negative, but it has already crossed the signal line and is accelerating downwards. At the very least, it provides a warning for bulls looking to immediately buy the dip.
Good luck!
DS

FTSE 100 Outlook: Twin Bullish Signals Point to Fresh HighsFresh record highs for the FTSE 100 contract may be on the cards, with consecutive bullish signals pointing to growing upside risks.
The first arrived on Friday with a hammer candle on the daily chart, rebounding strongly after testing the 50-day moving average. That was followed on Monday by another large bullish bar that saw the price break out of the falling wedge pattern it had been trading in for much of the past month. The breakout points to the risk of further upside ahead, putting the record high of 9,579 set on October 8 on the menu for bulls.
Given the twin bullish signals, traders may want to consider initiating longs around these levels or slightly lower, targeting 9,485 or the record highs. Stop placement should reflect the desired risk-reward you’re seeking from the trade.
RSI (14) has broken its downtrend and now sits in marginally bullish territory. MACD also remains in positive territory despite crossing the signal line from above earlier this month and is now starting to flatten out. Combined, the two indicators suggest diminishing bullish momentum may be in the early stages of building again, improving the probability of the breakout playing out in full.
Good luck!
DS

/SI: Going ShortEvery time weekly RSI > 86,
1. 60% of the time it go down after 1 week
2. 80% of the time it go down after 2 weeks
3. 100% of the time it go down after 3 weeks
4. 100% of the time it go down after 1 month
4. 100% of the time it go down after 2 months
4. 100% of the time it go down after 3 months
4. 100% of the time it go down after 6 months

Bearish Candles Flash Warning: Platinum’s Rally May Be OverPlatinum’s breakneck rally since June looks at risk of reversing, with the last two weekly candles delivering notable topping patterns. A shooting star from above $1,700 was followed by an enormous bearish pin, doubling down on the message. With momentum indicators like RSI (14) and MACD rolling over but still in overbought territory, selling into rallies is preferred near term, especially if we see another push above $1,650 where bears were active in each of the past three weeks.
Downside targets for shorts include the July high of $1,516, with the February 2021 swing high of $1,350 and $1,300 as other options after that. Risk management is extremely important for anyone looking to act on the bearish price signals given how far the price has run over recent months, so make sure stop placements above entry are aligned with your desired risk-reward ratio from the trade.
Good luck!
DS
Breaking Down my Strategy for YM Trade46,700 to 45,700 is my prediction this week. I'm breaking down my thought process for journaling purposes.

eth 5293 on 30 min chartall chart indicator on 30 minutes chart
with fibo extension
with stochastics
all the way up

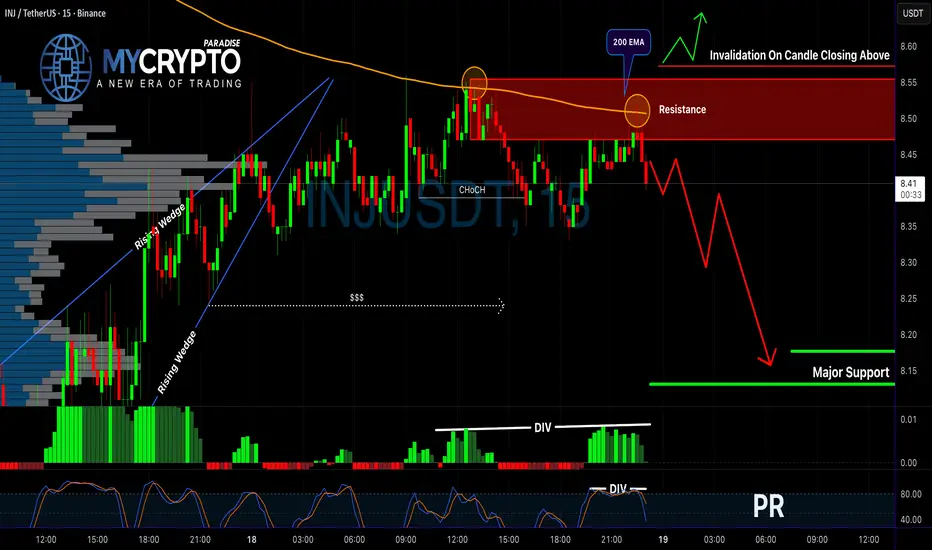
INJUSDT Just Flashed a Bearish Reversal SignalYello, Paradisers! Did you catch how INJUSDT reacted at the resistance zone? If not, you might be looking at the early signs of a deeper drop. Here's what you need to know before it's too late.
💎INJUSDT is currently flashing a clear bearish outlook as price reacts strongly from a major resistance zone. This area is further reinforced by the 200 EMA, adding technical confluence to the rejection. Most importantly, we've now seen a bearish CHoCH (Change of Character), which often marks a momentum shift from bullish to bearish. On top of that, both MACD and Stochastic RSI are showing bearish divergence—this alignment of multiple indicators significantly increases the probability of downside continuation.
💎Aggressive traders may look to enter short positions directly from current levels, aiming to capitalize on early momentum. However, for more conservative and risk-aware traders, a safer approach would be to wait for a minor pullback into the resistance area, followed by confirmation from bearish candlestick formations. This method not only improves the risk-to-reward ratio but also increases the overall probability of success by waiting for clearer market signals.
💎That said, we always account for invalidation. If the price manages to break and close decisively above the resistance zone, it would invalidate the current bearish structure. In such a scenario, standing aside and waiting for a new price structure to form would be the smarter move, rather than trying to force a trade against the new trend.
💎This is where patience and discipline truly set you apart from the herd. If you want to be consistently profitable, you must learn to wait for the highest probability opportunities—just like we do. Avoid rushing, and don’t let emotions lead your decisions.
🎖Strive for consistency, not quick profits. Treat the market as a professional business—not a gamble. That’s the only way to build long-term success in crypto. Be a PRO.
MyCryptoParadise
iFeel the success🌴
126k was the topAs you can see, on the monthly chart we had a peak every time the Ultimate Oscillator reached a value of 53. simple.

WOSG Long - Already in trade. Slim chance of re-entryWOSG Long
Already in this trade but there may be a slim chance of re-entry on a pull back as close as possible to entry price. Otherwise SL is pretty wide and not ideal.
Could ladder in with some DCA orders to entry, but you may not get it.
Price back at historic levels with double bottom type structure.
Spring back test of 340 price level on daily.
Bullish divergence on weekly MACD and RSI, suggesting reversal.
Targeting old highs and significant price levels.
Price action at lower orange levels may experience so congestion/consolidation.
TP1 could be reached quickly.
TP2 and 3 may be far fetched as luxury goods run was probably a result of excess spending during covid and low interest rates, but worth a shot.
Might be worth 50-60% exit on TP1 and see how the trade goes for the remaining TPs, so as to lock in returns.

ETHEREUM TO NEW ATHHow many bullish divergences Ethereum needs to break 4800?
daily RSI
daily MACD
daily STOCHASTIC RSI

Price Action Key for FTSE 100With momentum indicators generating neutral signals and the price resting on support, there are numerous two-way trades to consider in the FTSE 100 contract.
9360 is the level to watch in the short term, coinciding with the high set on August 22. Since being established, it has provided resistance and support, making it a decent level to build setups around.
If we see a clean break beneath 9360, shorts could be established below the level with a tight stop above for protection, targeting either 9315 (the intersection of former triangle resistance and wedge support), the 50-day moving average at 9271, or 9200, depending on the desired risk-reward you’re seeking from the trade.
Alternatively, if the price manages to reclaim 9360 and hold there, the setup could be flipped, allowing for longs to be established above with a stop below for protection. Given the falling wedge pattern the contract finds itself coiling in, convention suggests that if we see a break of downtrend resistance around 9440 today, it could see the price revisit the swing high of 9579 set earlier this month. Resistance at 9485 provides another option for those seeking less from the setup.
There is no firm directional signal from either RSI (14) or MACD, sitting in either neutral territory or indicating waning bullish strength. Price action should therefore take precedence when it comes to trade selection.
Good luck!
DS

Bitcoin WeeklyTarget is 54k
May reverse in the 54-64k zone to fill the gap left at 20k.
Bullish if we can break the double top formation,
Target is 80k-120k
Expected to hit 54k with in the next 6 weeks.

Orionchain24: Arbitrum Stablecoin Supply Hits $5 Billion in 2025In the dynamic Layer-2 landscape of October 2025, Arbitrum has achieved a significant milestone, with its stablecoin supply exceeding $5 billion for the first time, reflecting a 3.92% weekly gain and 1.93% monthly increase. This surge, led by USDC’s 55.65% dominance and $381 million in weekly inflows, underscores Arbitrum’s growing role as a stablecoin hub, outpacing Ethereum in key metrics. With $3.436 billion in on-chain stablecoins and TVL crossing $2.5 billion, Arbitrum now holds 2.6% of the global $249.8 billion stablecoin supply. Orionchain24, a leading analytics platform for crypto and forex trading, analyzes this breakthrough, offering traders actionable insights and strategies. In October 2025, we empower clients to capitalize on Arbitrum’s stablecoin boom, minimizing risks through licensing and audits. Join Orionchain24 to leverage the Arbitrum stablecoin supply milestone 2025 and trade with confidence.
The $5 Billion Milestone: Arbitrum’s Stablecoin Dominance
Arbitrum’s stablecoin supply reached $5 billion, with on-chain holdings at $3.436 billion, up $129.69 million weekly. USDC dominates with 55.65% share, accounting for 60.53% of volume, while Arbitrum captured $381 million in inflows, surpassing Ethereum’s $374 million outflows. This positions Arbitrum with 2.6% of the global $249.8 billion stablecoin supply, a rise from $6.8 billion earlier, driven by 3.92% weekly and 1.93% monthly growth.
Key facts: Arbitrum’s TVL hit $2.5 billion, with stablecoin market cap at $3.436 billion. Ethereum regained 69% of new issuances, but Arbitrum’s rollup structure enables cheaper transactions, attracting $249.8 billion in stablecoins. Lending protocols exceeded $1 billion in supply post-expansion, while quarterly GDP data is now published on Arbitrum One. On-chain data confirms momentum: USDC holds 55.65% dominance, with 61.14% of sales in USDC. Arbitrum’s 186% deployed/bridge ratio signals capital recycling, with DAO treasury at 35.3%.
Why fresh: In 2025, Arbitrum’s stablecoin adoption is at an all-time high, with inflows outpacing Ethereum. The chain’s $381 million weekly inflows and 1.3 million active addresses holding stablecoins highlight its role in scaling dollars on Layer-2. Risks include Maximal Extractable Value (MEV) and sandwich attacks, though less severe than Ethereum’s. Forecast: Stablecoin supply will hit $60 billion by year-end, with Arbitrum capturing 5% of the global market.
Trading Signals: RSI and MACD
Based on recent trends:
ARB ($0.329): RSI at 58 (bullish). Bullish MACD (+0.12)—target $0.40 (22% upside). Fibonacci support at $0.30, resistance at $0.35. On-chain: TVL +3.92%.
ETH ($4,500): RSI at 58. Bullish MACD (+0.12)—target $5,200 (15% upside). Support at $4,200, resistance at $4,760. On-chain: TVL +25%.
Overall: RSI 58 signals longs at supports for 15–22% Q4 gains. Risks: MEV attacks (5–7% dip); hedge with USDC.
How Orionchain24 Helps Clients
Orionchain24, with its license, equips clients with cutting-edge tools to trade during Arbitrum’s stablecoin surge. Our AI Alerts deliver real-time notifications at RSI >60 (e.g., ARB at $0.30), targeting 10–15% yields on catalysts like inflows ($381M) or TVL growth ($5B), integrating on-chain signals (USDC dominance 55.65%) and social sentiment (#ArbitrumStablecoin +150%) for precise scalping (0.5–1% daily profits) or arbitrage. Our On-Chain Tracking monitors Arbitrum’s TVL ($2.5B), whale activity (+15%), and transaction flows across 20+ blockchains, providing dashboards to spot setups like ARB at $0.30 for 22% upside. Portfolio Strategy recommends 20–30% allocation to ARB/ETH, hedging with USDC at RSI >70 for 15% Q4 returns, with AI reducing overfitting by 25% via backtesting. Education includes webinars on Arbitrum stablecoin supply 2025, covering USDC dominance, risk management, and MiCA compliance, plus demo accounts for practice. CertiK audits, AML/KYC compliance, and $100M insurance cut operational risks by 30%, ensuring fund safety. Orionchain24 integrates with blockchain explorers and TradingView, delivering real-time data to analyze Arbitrum’s resilience during 7.5% weekly volatility.
Conclusion: Arbitrum’s Stablecoin Milestone with Orionchain24
Arbitrum’s stablecoin supply surpassing $5 billion in 2025 marks a milestone for Layer-2 DeFi, with 3.92% weekly and 1.93% monthly growth highlighting USDC’s 55.65% dominance and $2.5B TVL. Capturing 2.6% of the $249.8B global supply, Arbitrum’s $381M inflows outpace Ethereum. On-chain data (65,000 TPS, TVL +25%) and 71% bullish sentiment confirm the trend, with a forecast of $60B by year-end. Risks like MEV are mitigated by hedging with USDC, making Arbitrum key for scalping (0.5–1% daily profits) and long-term strategies. With $4.5B weekly ETF inflows and +15% whale activity, it offers 15–20% Q4 gains. Arbitrum’s stablecoin surge isn’t just a milestone but a signal of Layer-2 maturity, simplifying DeFi access and boosting trading efficiency. Join Orionchain24 to trade confidently, leveraging Arbitrum’s milestone to maximize profits in 2025.
Ready for Arbitrum? Track signals with Orionchain24. What’s your goal? Comment below!
#ArbitrumStablecoin #Layer2DeFi #ARB #ETH #Orionchain24
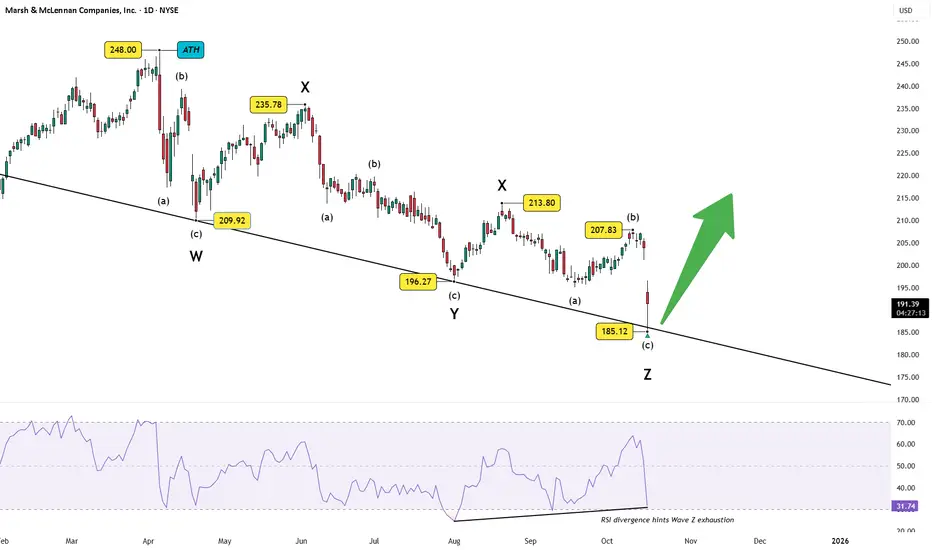
Marsh & McLennan (MMC): Complex Correction Nearing CompletionWave Structure
The larger decline from the 2024 peak at 248.00 appears to have unfolded as a five-part complex combination (W–X–Y–X–Z) .
Each leg subdivides neatly into corrective (a–b–c) formations, with Wave Z recently tagging the long-term support trendline connecting prior W–Y lows around 185.
RSI Window
RSI is flashing a bullish divergence — higher lows in RSI versus lower lows in price — hinting that downside momentum is fading. This setup often precedes the end of complex corrections.
A sustained rebound above 200–207.83 could confirm that Wave Z has completed, paving the way for a fresh impulsive advance.
Fundamental Context
Under the hood, Marsh & McLennan continues to show resilience:
Free Cash Flow has climbed steadily to $3.99 B (FY 2024) .
Revenue doubled over the past decade to $24.4 B , highlighting strong business traction.
Debt levels remain contained around $19 B, and the P/E ratio near 22.8 reflects a healthy, not overheated, valuation.
Together, these metrics support the view that the recent technical correction is more of a valuation reset than a structural breakdown.
Summary
Wave Z’s completion zone aligns with both technical exhaustion (RSI divergence, channel support) and fundamental stability — a combination that often sparks medium-term trend reversals.
Keep an eye on momentum confirmation above 207.83; it could mark the start of a new impulsive wave higher.
Disclaimer: This analysis is for educational purposes only and does not constitute investment advice. Please do your own research (DYOR) before making any trading decisions.
Tesla reports Wednesday; analysts expect EPS of $0.55Tesla reports third-quarter earnings Wednesday after the close, with analysts expecting EPS of $0.55, down from $0.72 a year earlier, on revenue of $26.2B — up 4%. There’s room for an upside surprise after record Q3 deliveries of 497,099 vehicles, boosted by the now-expired $7,500 U.S. EV tax credit, which also trimmed inventories. Analysts will focus on Elon Musk’s plans for robotaxi scaling, autonomy progress, and upcoming models through 2026, along with updates on new “Standard” Model 3 and Y trims. Wall Street projects about 450,000 deliveries in Q4.
Tesla is holding firm near $418, with its RSI turning higher to signal improving momentum. A positive EMA crossover — along with clear angle and separation between the averages — would confirm a strengthening bullish trend.

Breakout buzz in nifty ➡️ OI contracts ~1% as futures premium widens to ~100 pts — short covering underway.
➡️️ Aggressive Put-writing at 25,200–25,300 signals a strong bullish base.
➡️ PCR surges from 0.68 → 0.99 - sentiment turns decisively bullish.

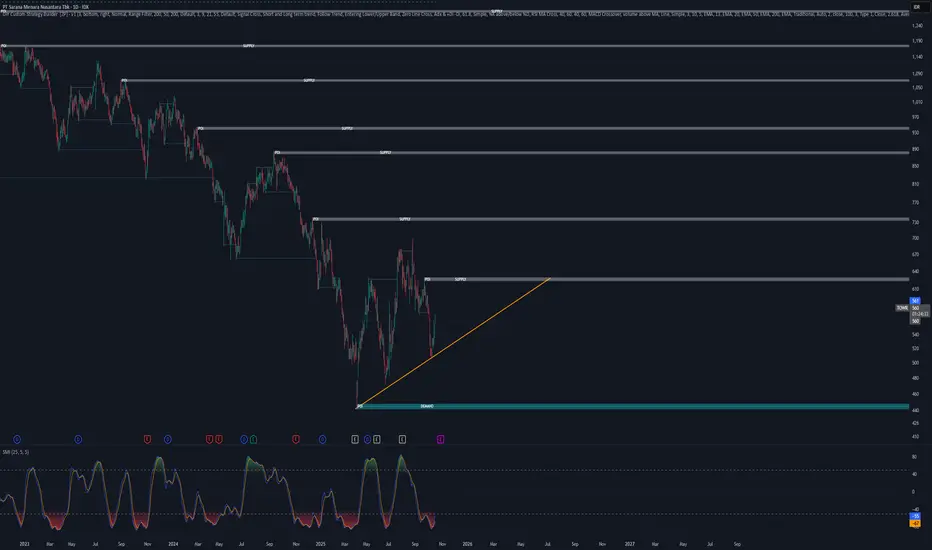
TOWR DiaryTechnical trends to monitor
Key support: ~IDR 520–540 (psychological level & recent daylows).
Key resistance: ~IDR 720 (previous level resistance) and IDR 825 (52-week high).
Moving average: MA50 and MA200 — MA50 cross > MA200 = bullish medium term; otherwise death cross = pressure drops. (Actual MA check on your platform chart).
Volume: a breakout is valid if there is a significant increase in volume compared to the 30-day average.
RAAM DiaryRAAM Catalyst:
In 1H 2025, RAAM is turning losses into profits, this signals a business recovery.
Expansion of the Platinum Cineplex cinema network: there is already information that branches/screens are increasing.
New management/restructuring positions can increase investor confidence (news of changes in directors/commissioners)

The wicks could be warning usThe long topside wicks on the AUD/NZD weekly chart were giving traders a strong message well before Thursday’s weak Australian jobs report, signaling the run-up from the April lows may have run its course and that downside risks were building. Those risks have increased further following the sharp spike in unemployment seen in September. Traders may therefore want to consider selling rallies in AUD/NZD now rather than buying dips, putting short setups on the menu.
Sellers were active on pushes above 1.1350 over recent weeks, making that an ideal entry level for shorts. However, there’s now a decent risk the pair may not get back there, hinting selling around current levels may be required for those looking for downside. Should that be the case, ensure your stop level fits with the desired risk-reward from the trade.
As for potential targets, AUD/NZD did plenty of work either side of 1.1250 back in 2022, putting it on the radar given it’s also located near the 23.6% fib retracement of the April–October high-low. Beyond, the November 2024 high of 1.1180 marks the start of a more pronounced support zone down to 1.1142 where the 38.2% fib level is found. The price was capped below this zone for large periods over the past year, making it screen as a potential target level to reassess the setup should it play out.
Momentum indicators remain in bullish territory, although the break of the uptrend in RSI (14) warns that topside strength is fading. That’s not yet confirmed by MACD, although it’s showing early signs of rolling over toward the signal line. The overriding message is one where bulls should be cautious entering fresh long positions.
Good luck!
DS

Bearish shift in USD/CHFLower U.S. Treasury yields helped trigger a downside break in USD/CHF on Wednesday, with the pair slipping below a zone that includes the 50-day simple moving average and .8000 support. RSI (14) has broken its uptrend and moved below 50, suggesting momentum is shifting toward the bears. MACD hasn’t confirmed yet but is rolling over and already sits in neutral territory.
The break and momentum shift favour downside in the near term.
Those looking to play it from the short side could wait for a bounce towards .8000, allowing for positions to be established beneath the level with a stop above for protection. .7935 and .7912 screen as potential targets. Selling around current levels is also an option targeting the same downside levels, but make sure your stop aligns with a risk-reward profile you’re comfortable with.
Good luck!
DS
