Macdcross

FAANG, macd and MAs divergence.ie minimize risk by buying positions when both MAs(price action) fits macd potential. Divergence is bearish.
maximize gains by ONLY buying good positions.

I love MACD but there's something fishy about 1268% Net Profit!Hey folks, posting this here for you to tinker with.
It's a simple trading strategy idea I have using the Moving Average Convergence Divergence (MACD) indicator for signals on when to enter and exit trades. Let's break down the key components of your strategy:
Inputs for MACD Calculation:
fastLength: The number of periods to use for the fast moving average in the MACD calculation. This is set to 2 periods by default.
slowLength: The number of periods for the slow moving average in the MACD calculation. This is set to 4 periods by default.
signalSmoothing: The number of periods for the signal line's smoothing. This is set to 2 periods by default.
MACD Calculation:
The ta.macd() function calculates the MACD line, signal line, and the MACD histogram (which you are not using, hence the underscore placeholder _).
The MACD line is the difference between the fast and slow moving averages.
The signal line is a smoothed version of the MACD line.
Trading Signals:
A buy signal (strategy.entry) is generated when the MACD line crosses above the signal line and the MACD line is above 0. This is interpreted as bullish momentum increasing.
A sell signal or exit signal (strategy.close) is generated when the MACD line crosses below the signal line. This is to close any open long position based on the assumption that the bullish momentum is weakening.
Plotting:
The strategy also includes commands to plot the MACD and signal lines on the chart for visual reference. The MACD line is in blue, and the signal line is in orange.
This strategy is overlayed on the price chart (overlay=true), which means you can see the buy and sell signals in conjunction with the price action.
The strategy is simple and only based on the MACD crossing signals without any other filters or risk management rules. It assumes that when the MACD line crosses above the signal line with positive momentum, it is a good time to enter a long position, and when it crosses below, it is time to exit.

Strong Support, Daily MACD cross, Daily Bullish Hammer 72% WRateFollowed plan for the most part. Daily MACD looking prime for bullish cross to the upside on a double cross over pattern. This is a major area of support from where previously we saw a rapid extension to 0.5 from 0.18. Plenty of upside movement meaning that sellers are wary of stepping in the way and buyers are entering large positions at this point. Today (6th Feb) we are observing the creation of a bullish hammer on the daily timeframe, along with further convergence on the MACD, along with increasing volume. BTC is also displaying signs that it's about to breakout from it's $43,000 price point which will lead to a certain surge to over $45,000 and beyond in the lead up to the BTC halving in March. There is so much attention in this space right now, ETF ads coming to Google/Facebook/etc, and massive retracements in the alts market which will be filled very quickly from any bullish pressure seen in BTC. This is the time to go hard or go home son. You've nailed this.

CHFJPY 1H Possible Double bottom in an up trend channelOn this 1H chart for CHFJPY we can notice that the price has been moving in an up trend channel for a while now. Recently it dropped to test the up trend support. At this stage the price is forming a potential double bottom. Monitor it for a potential breakout.
Additional confluences:
- MACD can produce a bullish cross if the price starts going up to complete the Double bottom
- The 2 bottoms are re-bouncing from the 200 EMA
- If the price goes up, in can cross above the 20 and 50 EMAs. Monitor for a bullish cross

GBPAUD 4H Double topThe price of GBPAUD has formed a potential double top on the 4H Chart
Additional confluences:
- The pattern is happening at a strong reisstance range created from multiple previous low points in the price
- The 2 tops are showing rejection from the 0.618 Fib level
- The MACD has formed a bearish cross around the middle of the formation of the double top chart pattern

Uranium demand is looking bullish, can #CCJ continue to rally? With COMEX:UX1! spot prices surging by nearly 50%, the performance of NYSE:CCJ has been nothing short of remarkable since it broke out of the wedge pattern in June this year. A significant increase in trading volume further exemplifies this rally.
As uranium spot prices continue to show potential for further gains, the question arises: can NYSE:CCJ sustain its upward momentum? Several indicators suggest a positive outlook.
1. The MACD (Moving Average Convergence Divergence) has recently formed a bullish crossover, signalling strong momentum in favour of the bulls.
2. Additionally, the stock is currently positioned at the 50-day moving average.
3. Furthermore, NYSE:CCJ has successfully tested the $36 resistance level, which has now turned into support, making for a robust double-bottom pattern.
All of these technical signals point to a favourable long position. Investors speculating on NYSE:CCJ at this juncture may stand to gain healthy profits if the current trends persist.

#STMX 1 HOUR PERFECT GOLDEN POCKET BOUNCE🎯🔥🤓Hey there, fellow crypto enthusiasts! 🚀 Let's dive right into the exciting world of cryptocurrency trading with a focus on #STMX (StormX) and its recent 1-hour performance that has got us all buzzing! 📈💥
So, here's the scoop: #STMX has just pulled off a perfect golden pocket bounce on the 1-hour chart. 🌟 What's that, you ask? Well, my friends, it's a pretty cool trading strategy that involves identifying a specific Fibonacci retracement level (the golden pocket), and when the price bounces off that level, it's like hitting the jackpot! 🎯💰
In simpler terms, this bounce suggests that #STMX found solid support at a key level, which can be a really bullish sign for us traders. It means that there's some strong demand for #STMX around that price point, and it's not just a random spike. 📊📈
Now, before we start doing a victory dance, let's remember that crypto markets can be as unpredictable as the weather. 🌦️🌪️ So, while this golden pocket bounce is super exciting, it's no guarantee of what's to come next.
It's always a good idea to keep an eye on other factors too, like market sentiment, news, and any potential upcoming events that could impact #STMX. 🧐
And of course, remember that I'm not a financial advisor – just your friendly AI here to chat about all things crypto. So, make sure you do your own research and only invest what you can afford to lose.
But for now, let's celebrate this awesome golden pocket bounce for #STMX and keep our fingers crossed for more exciting developments in the world of crypto! 🚀🔥😎
SLong

4H to 1WFrom time to time I publish such ideas.
The situation flowing from one timeframe to another timeframe.
So we have a correction, which may first lead the bitcoin to the area of $ 25,200-25,000...
This process may well take the rest of the week or more.
But! Look at the weekly chart with MACD on.
A «bad» cross may well form, if not this week, then as early as next week.
Crosses on the weekly MACD usually cause even more declines.
Given that Cluster Algorithm showed a bearish divergence that has not yet worked out,
I believe we have everything ahead of us.

Netflix Weekly Support Convergence Test so far so goodHi guys. This is a MACRO Technical Analysis on Netflix (NFLX) on the 1 Week TImeframe.
This week we have TESTED Support on the 21 EMA and the Support trendline of the UPTREND channel.
Netflix is heavily supported not only by these 2 mentioned SUPPORT lines but also a 3rd Support, the black horizontal support line as well.
Everytime we've touched the Support line of the Channel, we've bounced to the Top of the Channel.
EXCEPT our most recent touch, that took us only half way before printing a Topping Tail Candle and selling off.
Watch how we close this weeks candle. If we close around or above $428.
That would be the best case scenario, as that would indicate an Engulfing Bullish Candle.
This could invalidate the Topping Tail Bearish Momentum.
BUT for now we need to watch what happens. Keep in mind that the Topping Tails can cause further price DECLINES.
AND we absolutely don't want a UPPER WICK for our current weekly candle. This would imply selling pressure and may indicate continuation of the TOPPING TAIL.
Watch also the VOLUME -> From here we should see increasing volume and or SPIKE in volume so price can continue up the channel.
For whatever reason if we BREAK DOWN from this SUPPORT CONVERGENCE area, the next level would be the 50 SMA.
Also NOTE, along with Topping Tail Candle, indicators are showing BEARish signs.
MACD has crossed BEARISH
RSI Broke BELOW Support Trendline.
For us to continue our UPTREND
MACD needs to CROSS BUllish and print green bars
RSI cannot print below the Horizontal Black line, as that would indicate a Lower low. And Ideally, get back above the Support Trendline and or continue UP.
__________________________________________________________________________________
Thank you for taking the time to read my analysis. Hope it helped keep you informed. Please do support my ideas by boosting, following me and commenting. Thanks again.
Stay tuned for more updates on NFLX in the near future.
If you have any questions, do reach out. Thank you again.
DISCLAIMER: This is not financial advice, i am not a financial advisor. The thoughts expressed in the posts are my opinion and for educational purposes. Do not use my ideas for the basis of your trading strategy, make sure to work out your own strategy and when trading always spend majority of your time on risk management strategy.

PANW Cyber SectorPalo Alto Networks is a cybersecurity company that provides advanced security solutions to organizations worldwide.
I don't think they're going anywhere for a while and are very established already with multiple deals and have been on point with their financials and earnings.
We're looking for a break out of the consolidating 238-240 range which already happened as im typing this.
huge gap down on july 12th looking for a retest to 253. If it falls below 238 it needs to hold 236 level or will retest 232.

Bullish on $CSE:BTC Blue Sky Digital Symbol: CSE:BTC
Blue sky is a prime example of a dormant stock about to bounce!
Note the illustrated section where it notes crossing the MACD and I believe an upward trend to 0.06+ in near future, possibly the next two weeks!
BTC = Buy in my opinion
Note: This is not financial advice and I am not a financial advisor! Do your own research!

Some were too keen on hourly chartsBTC made a cross of the middle lines on the weekly MACD.
It always works reliably.
We can see that it also falls out of the channel.
There was a lot of growth confidence.
The market did its usual trick, went against it.

SINGER | Wave Projection | Major 4-Wave Triangle - MACD GoldenXThe price is currently trading just below 200SMMA as the key resistance under the assumption that its major 4-wave triangle breakout could be possible with double bottom pattern and MACD golden cross.
This bullish scenario has the downside is -8% and the upside is +10 - 20% with RRR: 1.5-2:1.

EURAUD Short Setup 1H TimeframeMoving Averages:
15m TF: Price could go test the 100 EMA (at tp2)
Weekly Timeframe: Price could make a brief pullback at the current resistance zone before continuing to the upside.
Monthly Timeframe: Price is bullish but at a resistance level at the moment. Let's see if price will reject it or break through.
RSI & MACD ready for a downward move on the 15m, 30m, and 1H timeframe.
EURAUD, EURNZD, GBPAUD, GBPNZD all move in the same direction.

How to Use the MACD Indicator?How to Use the MACD Indicator?
🔶 What’s MACD?
That is an abbreviation for Moving Average Convergence Divergence.
This technical indicator is a tool for identifying moving averages that indicate a new trend, whether bullish or bearish.
After all, finding a trend is a key priority in trading because that’s where the greatest money is produced.
A MACD chart typically displays three figures that serve as its settings.
▪️ The first parameter is the number of periods utilized to construct the faster-moving average.
▪️ The second factor is the amount of periods used in the slower moving average.
▪️ The third parameter is the number of bars utilized to construct the moving average of the difference between the faster and slower moving averages.
For example, if you saw "12, 26, 9" as the MACD parameters (which is typically the default value for most charting software), you would read it as follows:
🔹 The number 12 signifies a 12-bar moving average.
🔹 The number 26 denotes the moving average of the preceding 26 bars.
🔹 The 9 is a moving average of the difference between the two moving averages mentioned above.
When it comes to the MACD lines, there is a widespread misperception.
There are two lines:
🔺"MACD Line"
🔻"Signal Line"
The two lines that have been drawn are NOT price moving averages.
The MACD Line is the difference (or separation) of two moving averages. Typically, these two moving averages are exponential moving averages (EMAs).
The MACD Line is the "faster" moving average when looking at the indicator.
The MACD Line in our previous example is the difference between the 12- and 26-period moving averages.
The MACD Line's moving average is the Signal Line.
When viewing the indication, the Signal Line is the "slower" moving average.
The slower moving average plots the previous MACD Line's average. Again, in our previous example, this would be a 9-period moving average.
By default, most charts employ a 9-period exponential moving average (EMA).
This indicates that we are plotting the average of the last 9 periods of the "faster" MACD Line as our "slower" moving average.
The Signal Line's aim is to mellow down the sensitivity of the MACD Line.
The difference between the MACD Line and the Signal Line is represented in the Histogram.
It depicts the distance between the two lines graphically.
It may occasionally offer you an early warning that a crossover is going to occur.
When we look at our original chart, we can see that the histogram grows as the two moving averages (MACD Line and Signal Line) separate.
The faster moving average (MACD Line) is "diverging" or moving away from the slower moving average (Signal Line), resulting in a MACD divergence.
The histogram shrinks as the moving averages move closer together. Because the faster moving average (MACD Line) is "converging" or approaching the slower moving average (Signal Line), this is referred to as convergence .
That is how you get the name Moving Average Convergence Divergence.
So now you are aware of what MACD performs. Let us now demonstrate what MACD can achieve for YOU.
🔸 MACD Trading Guide
Given that there are two moving averages with differing "speeds," it stands to reason that the faster one will respond to changes in price more quickly than the slower one.
The faster line (MACD Line), which reacts first to a new trend, finally crosses the slower line (Signal Line).
It frequently signifies the emergence of a new trend when this "crossover" takes place and the fast line begins to "diverge" or move away from the slower line.
The fast line passed UNDER the slow line in the previous chart, correctly identifying a new downtrend.
You'll see that the Histogram briefly vanished when the lines intersected.
This is due to the fact that there is no difference between the lines at the moment of the cross.
The histogram increases as the downtrend takes hold and the fast line begins to diverge from the slow line, which is a sign of a strong trend.
Let's look at an illustration.
The fast line passed over the slow line in the above 1-d chart of BTC/USD, and the histogram vanished. This implied that the brief downward trend might eventually turn around.
After that, the BTC/USD launched a new upswing and immediately shot up.
🔴 BUT The MACD has one disadvantage.
Moving averages naturally lag behind price. It's only an average of past prices, after all.
Keep in mind that the MACD indicator has three parts:
🔹The MACD Line which represents the difference between two moving averages.
🔹The Signal Line which is a moving average of the MACD Line.
🔹The Histogram which is a graphical representation of the distance between the MACD Line and Signal Line.
However, MACD is still one of the favorite tools of many traders and mine, of course )
If you liked the post and it was useful to you - click <>, let newcomers see! Leave your comments, I'll be so pleased!
Sincerely yours Kateryna

Does You Guys Like Ramps?VIX. Swing Trade. Careful not to get too big early and get volitlity crushed as the market picks a direction over the next days and coming weeks. MAC D Crossing. High Volume at Bottoms. VIXJ2023. $VIX $UVXY $ SVIX

Awaiting doge breakout of channelDoge is in a declining parallel channel. Awaiting breakout of the channel, and clearing the moving averages will setup a long to 0.96, then 0.108 and 0.146 resistance levels.
The rsi is also supportive of such a move with it currently trending upwards and not in an overbought position.
The MACD is also beginning to trend upwards with the MACD line crossing over and signalling a upward trend.
The rate of change ROC is also trending upwards but a note of caution: a pullback in the roc and then the breakout would result in a stronger indicator signal.
Volume is also starting to trend upwards over the past week compared to the preceding period of 27 Feb to 08 Mar, this signalling a move is impending which will have market support (and is more likely to form a trend as opposed to just a temporary spoke or bull trap).
İf taking a long position, depending on risk appetite, putting in a filter of 3 days from the breakout to avoid a bull trap might be advisable.
Alternatively, rejection of the upper boundary of the channel and/or moving averages will setup a downward mice to 0.69 then 0.67 and then to the bottom of the channel.
Best approach is to await a decisive action and enter then with SLs based on chart structure.

ZEUS Bullish MACD Setup - High Accuracy of Winning TradesOur MACD Setup is created to reveal winning entry points for a trade with high accuracy.
In our MACD Setup we combine multiple conditions to recognize only strong entry points.
Multiple factors need to be met in confluence:
1. Recognize the Trend = Bullish / Bearish Trend (50 EMA is Above / Below 200 EMA)
2. There is a MACD Cross = Bullish / Bearish MACD Cross (MACD Cross is Below / Above Zero Horizontal Line)
3. Avoid False Signals in a Sideways Markets = MACD Cross far from horizontal zero “0” line
4. Filter only Strong Trend Situations = Candle Close above/below 200 EMA
5. Avoid Extreme Values in RSI = check if there is way to go before we get oversold/overbought
6. Our Algorithm Filters Signals in Side Trend and Low Volume Markets
Let´s explain the conditions step by step
1. Recognize the Trend
Exponential Moving Average (EMA) is one of the most effective trend identification indicator. Traders like it because of it its simplicity.
EMA is usually used in combination between 200 days (as a slow indicator) and 50 days (as fast indicator of the trend).
Bullish Trend = EMA 50 is Above EMA 200
Bearish Trend = EMA 50 is Below EMA 200
2. There is a MACD Cross
After we recognized the Trend (Bullish Trend in our case) we would like to trade with the trend so we are looking for Bullish MACD Cross.
Bullish MACD Cross is Below Zero Horizontal Line
3. Avoid False Signals in a Sideways Markets
So we found Bullish MACD Cross and now we want to be sure that the Cross far away from the Zero Horizontal Line.
Our algorithm filters crosses and shows only signals with decent distance form Zero Horizontal Line.
4. Filter only Strong Trend Situations
Once we have met the first three criteria (Bullish Trend and Bullish MACD Cross far from Zero Horizontal Line) we need confirmation that the market is still strong and is moving forward in an uptrend.
So we look at price action and there need to be Candle Close Above EMA 200 . Closing about EMA 200 indicates continuation of the trend.
5. Avoid Extreme Values in RSI
The other condition is based on RSI and we are looking only for situations where RSI is not overheated so there is a way for trend continuations.
In our case RSI was in the middle values so we can expect market to continue its uptrend.
6. Our Algorithm Filters Signals in Side Trend and Low Volume Markets
We have developed our own Algorithm which filters signals in low volume markets and side trend.

MACD: Everything You Need To Know!The MACD indicator consists of three parts: the MACD line, the signal line, and the histogram. The MACD line is calculated by subtracting the 26-period exponential moving average (EMA) from the 12-period EMA. The signal line is a 9-period EMA of the MACD line, and the histogram represents the difference between the MACD line and the signal line.
Let's break this down a little further. The MACD line is a measure of the difference between the 12-period and 26-period EMAs. When the 12-period EMA is above the 26-period EMA, the MACD line will be positive. When the 12-period EMA is below the 26-period EMA, the MACD line will be negative.
When the MACD line crosses above the signal line, it's considered a bullish signal. This indicates that the trend is likely to continue upward. Conversely, when the MACD line crosses below the signal line, it's considered a bearish signal, indicating that the trend is likely to continue downward.
One of the most popular ways to use the MACD indicator is by looking for crossovers between the MACD line and the signal line. When the MACD line crosses above the signal line, it's considered a bullish signal, indicating that the trend is likely to continue upward. Conversely, when the MACD line crosses below the signal line, it's considered a bearish signal, indicating that the trend is likely to continue downward.
But using MACD isn't just about looking for crossovers. There are several other ways to use the indicator to make informed trading decisions. For example, you can use the MACD histogram to identify divergences between price and the MACD indicator, which can signal a potential trend reversal.

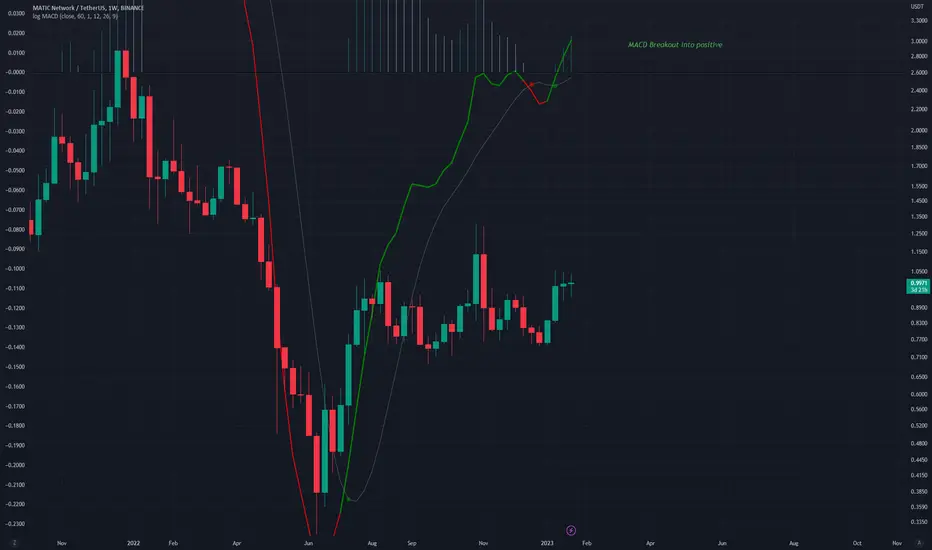
MATICUSD - MACD BreakoutShowing the MACD on the main chart
The indicator slightly dipped before the positive area but quickly climbed back into the positive area. This is a bullish sign.
This strong stance from the indicator is also supported by price, with a sort of bullflag forming along this area of low volatility
MLong
EURSGD - W patternHello traders! We can spot a similar formation on EURSGD as on EURJPY, about which I discussed in my previous post, and which has already reached the take profit. EURSGD also seems to create a strong impulse downwards, completing to the neckline the W that was formed on the daily timeframe . We can see that the MACD is below 0 and EMAs are crossed, showing us a bearish environment. From here, there is a high probability of reaching the neckline of the daily W, going to at least at 1.425
OANDA:EURSGD FOREXCOM:EURSGD

EURJPY - W patternHello guys! EURJPY seems to create a strong impulse downwards, completing to the neckline the W that was formed on the daily timeframe. We can see that the MACD is below 0 and EMAs are crossed, showing us a bearish environment. From here, there is a high probability of reaching the neckline of the daily W, going to at least at 140.8.
FX:EURJPY OANDA:EURJPY
