Watching this beautiful triangleAs you can see the action price already break the last big resistance, it struggle since march last year and now it seems to be coming back, in MACD we have a good volume that shows momentum the two lines are crossing, the four MVA lines(5,20,50,200) now are under the price meaning the beginning of a bullish trend (check that since the very first time for the company the price is above the 200 MVA) and if I could guess, I believe it could be around the 50s in the next six months, for now I expect to reach the other previous resistence that was 30 dollars either tomorrow or friday.
This is the first chart I ever publish please share your ideas so I can keep learning, this is not a financial advise always do your own research.
Thanks for reading.
Show some love commenting below and share what other indicators you would use to reinforce a technical analysis like this.
Ghostrader
Macdcross

Looking to bearishly breakout of a Rising WedgeThis is an update to a previous chart of intel where i took 10 months of price action and called a diamond bottom. Now in this new edition i am adding a Rising Wedge along with the bearish crossing of the MACD. Will price action continue to so smoothly follow the rules of the patterns on Intel? We Shall see..
I believe that a reasonable target for a breakdown of the wedge will be towards the 200 SMA and EMA at Around 54 dollars or so.

REX - Is the Pullback Over?REX has stopped its fall and has decisively bounced off the 200SMA and it seems that the pullback is over and price is likely to move up. MACD has given a bullish cross which is also a bullish sign and a confluence. I am expecting the upswing to continue higher. My trade plan is as follows:
TP - $1.880 (potential 17% gain)
Stoploss - $1.420
Please note these are my own notes, by no means trading advice. Please do your own research before entering into any trade.
RLong

YAL - Ready to take off?YAL has been getting very well supported on the 200SMA and the consolidation is probably gathering energy to push higher. With MACD Bullish Cross as a confluence, I am bullish YAL and expecting it to move higher in the next few trading sessions. My trade plan is as follows:
TP1 - $2.45 (potential gain 7%)
TP2 - $2.55 (potential gain 11.5%)
Stoploss - $2.15
Please note these are my own notes, by no means trading advice. Please do your own research before entering into any trade.

MEZ - Bullish Trade PlanMEZ looks good and ripe for a move higher because of the two consecutive breaks of the Bearish Trendlines with High Volume and has bounced off its strong support of $4.60 level. MACD has got bullish too and maybe we shall see the upswing continue to go higher. My target for this trade would be $6.00 level which could be a potential 18% gain.
TP - $6. 00 (Potential Gain 18%)
Stoploss - $4.50
Please note these are my own notes, by no means trading advice. Please do your own research before entering into any trade.

ANO - Bullish Trade PlanI am expecting ANO to move higher in the next few trading sessions. Price has been getting supported above the 200SMA and 50SMA and has been consolidating and volume is also picking up. Price initially broke out of the Bearish Trendline with very High Volume and MACD has also crossed, giving a Bullish signal. My trade plan is as follows:
TP1 - $$4.60 (potential gain 8%)
TP2 - $$4.90 (potential gain 15%)
Stoploss - $3.90
Please note these are my own notes, by no means trading advice. Please do your own research before entering into any trade.

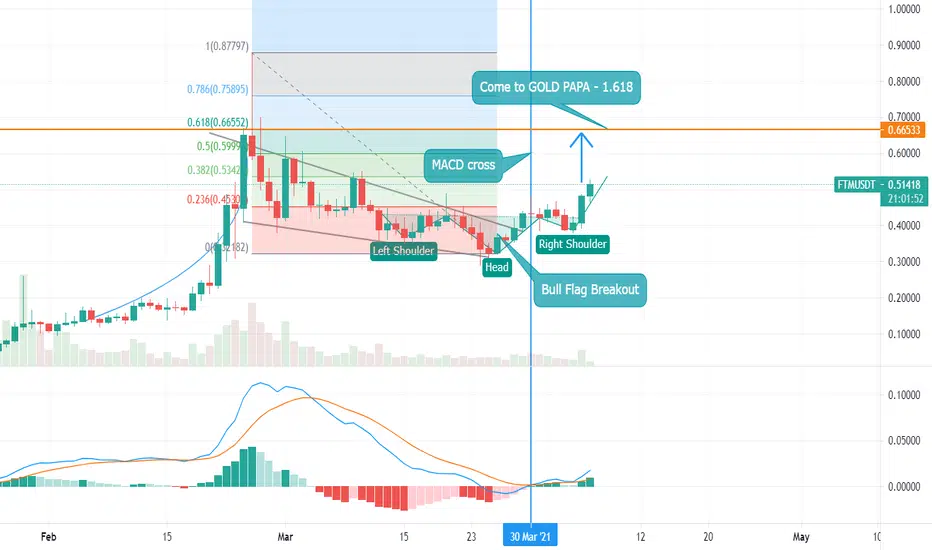
FANTOM, FTM to haunt the golden ratio in her scary upward trendMACD cross and a possible bull flag breakout. I think FANTOM has the ghostly legs to float up to the next GOLDEN ratio of opportunity..... And, if you're wondering, yes, I asked Doug and he agrees. Doug, you know, my iguana. Two taps of the back leg... go long, Three chin dips... go short. Once you understand the mysteries of reptilian trading, it's easy bro.
FLong
$BYOC TP targets for the move up #BYOCChart looking fantastic. If a pullback at open tomm comes it would be a solid entry, but the chart has allot of upside ahead

$ETH Is About To Get Sent!Not much needs to be said here. I shared something similar a couple days ago but we officially have a Bullish cross on the 1D MACD. and it looks like we are headed for a breakout. Price should test the previous ATH before we continue to the target of $2,500.

AUS/JPY descent through diagonal support, going bearish?Hi. Plotted on the 1D chart is a diagonal support line. It has recently been broken.
On it I've also pointed out the near crossing of the Ichimoku conversion line and base line.
The MACD is also turning away from its signal line in a downward direction and if the trend continues is will also soon pass the top line of the Williams.
In the 4h chart the MACD and WIlliams is not as indicative of a downturn but instead the Ichimoku shows a recent crossing into a red cloud which is indicative.
Thank you. Please, if you have any thoughts or comments do leave them below and I would gladly discuss or adjust my interpretations and methods with you.
This does not constitute financial advice.
Any projected prices, even if explicitly stated, are made with intent to discuss the symbol and potential interpretations.
Any trades shown or mentioned are examples and neither recommendations or mandates.

FLNT in a declining channel?Hi. Since the end of February FLNT has been in a bearish trend after barely breaking its high from May in 2020.
I perceive no reason to believe this trend will reverse.
On the chart is a channel within which I anticipate the price will remain as it continues to drop and that the price will imminently bounce off the top line of the channel to then retreat to continue the trend.
The low MACD and its movement to cross its Signal within a week supports this.
The current low RSI also shows that there is room for buy to move the price to the top line of the channel.
Its high volatility could however undermine both these indications, but its improbable.
Two examples are shown on the chart: A long position to profit off the bounce and a following short position for the return to trend.
Thank you. Please, if you have any thoughts or comments do leave them below and I would gladly discuss or adjust my interpretations and methods with you.
This does not constitute financial advice.
Any projected prices, even if explicitly stated, are made with intent to discuss the symbol and potential interpretations.
Any trades shown or mentioned are examples and neither recommendations or mandates.

Price rise as volatility drops?Hi. The Volatility of the Symbol MAGS has for the first time since the turn of the year lowered from a high level down to a center level.
At the same time the MACD is currently crossing its signal while below the MACD 0 value.
The price has also had steady highest lows since the start of the year.
It could be construed that the lowest highs since the spike at the start of February create a triangle together with its corresponding bottom line, but the top line in this triangle is not as clear or strong as its bottom.
The price is currently dancing over the MA 56 after dipping below since the start of March but as the price approaches the tip of the triangle and if the price breaks out of the triangle top line it will also stay above the MA more consistently.
The RSI is currently high, at a value of around -30, but that value is consistent with past price increases which have held a high RSI even as the price has increased over a longer period.
The example long trade shown has a TP that lies just below the high price of the 5th of February spike and a SL just below the low of the 8th of March and a buy line at the crossing of the triangles lines.
Oh, and MAGS is a company that deals with security installations at borders, airports and other sensitive installations. As passage of travelers is increasingly allowed throughout the coming year demand and interaction with systems like these will increase and be amplified by the needs of increased security screenings in both areas of transportation and governmental institutions. Just a thought.
Thank you. Please, if you have any thoughts or comments do leave them below and I would gladly discuss or adjust my interpretations and methods with you.
This does not constitute financial advice.
Any projected prices, even if explicitly stated, are made with intent to discuss the symbol and potential interpretations.
Any trades shown or mentioned are examples and neither recommendations or mandates.
MLong

JMIA may be due for bullish boost according to 6 algorithmsI have changed up how to best display projected movement. In the case of JMIA, 6 of my algorithms signaled a BUY on March 19, 2021. Equities nearly always obey the signal and move up, but sometimes it may continue to move down first.
I have placed two red boxes and two green boxes on the chart. The larger red box depicts all of the historical movement, from a percentage standpoint, that this stock has moved on the Hourly chart after a BUY signal occurred. Therefore, this box represents 100% of previous movement downward before the stock finally moved upward. The smaller red box represents 50% of all historical movement downward, before the stock moved upward. The smaller box is more of a precise target for the potential bottom in this instance.
The green boxes represent the same thing. In this instance, the smaller green box would be my projected target for the final top.
The black dotted arrow represents median historical movement. Medians are a good metric, but they are just one of many I use when forecasting future movement.
As always, the stock could rise the very next bar after the signal without looking back (therefore the red boxes would not come into play) or the stock may never rise (and the green boxes may never come into play).
All statistics and the full analysis are available for free as always at the site below.

FTMBTC - Strong bullish patterns +150% Most of indicators saying a very bullish run for FTMBTC.
RSI divergence, MACD crossing, W waves, close to break MA21 resistance, price in the recharge zone (0.618 - 0.786 Fibonacci), rebound on the support, etc..
Just one word, good luck guys
FLong

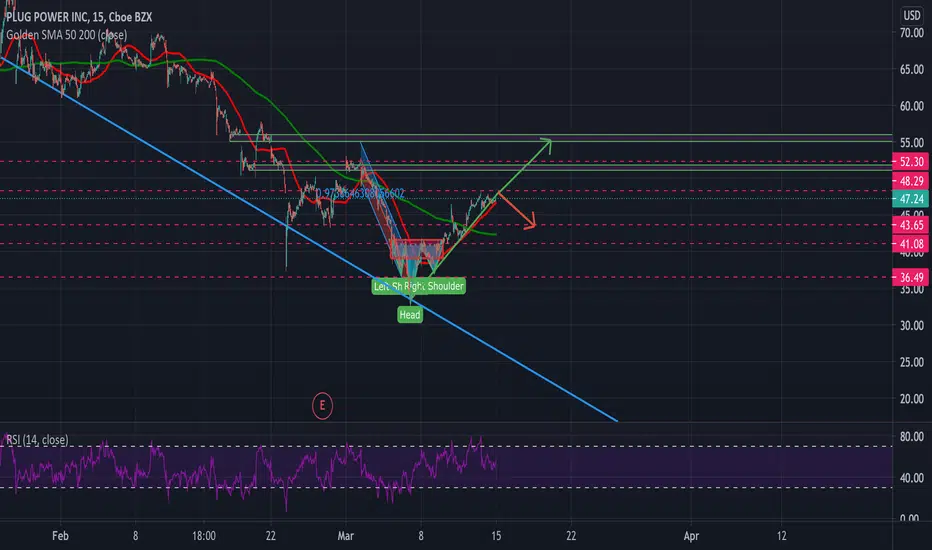
Bullish Reversal- Inverse H&SAfter a long regression, PLUG seems to have found its bottom after falling 40% from its 52-week high ending the regression with an inverse head and shoulders. Bollinger Bands are squeezing on its 6-month chart along with what looks like an impending MACD cross. PLUG needs to break the FIB resistance levels charted which seems relatively likely as long as the broader market doesn't experience a pullback as 10-year treasury yields have been fluctuating. PT1- $51.81, PT2- $56.19
Has strong top resistance at the $69-70 level

$CLOV Found support and is bouncing$CLOV has allot of positive in this chart. Consolidating within support. Mac D crossover. Falling wedges are bullish.
Buy the breakout of the trendline.
AQUA good sign of reversalAfter a rough week, the market slowly recover we might see a reversal
# Morning star
# 200 EMA support
# MACD crossover
first target = 27
second target = 30
ALong

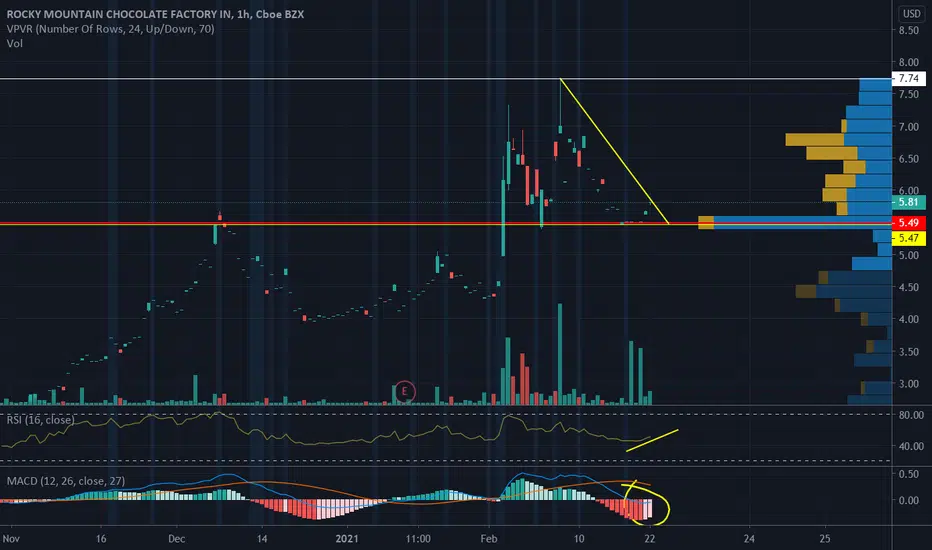
$RMCF Bullish hourly chartWho doesn't like chocolate?
Great looking chart on the hourly.
Please click a like if you like what you see on our chart.
UNI/BTC Breakout from Bull FlagThe UNI/BTC pair has recently cleared a buy point, as it has broken out of an extended bull flag on higher-than-average volume.
Confirmation of this trend reversal is provided by an approaching MACD cross.
The price is also trading above the Ichimoku cloud, indicating that it is safe to take a long position.

$BKMT / $BKLIF Alert!Cup and handle, golden cross, and Mac D cross on the the daily chart.
Amazing time to get a position before the price moves up!


Dollar Tree - Bullish TrendOn the move off of our low support line, DLTR price and daily volume have been consistently increasing. NOTE: bullish run after last reporting (11/24).
Crossing the 21 EMA, good sign for continuation to the top of our rising wedge.
MACD starting to turn, will require forward momentum.
