GBP/USD No 1) From Institutional Stand Point There is And Wick entry Which Could Take place.
No 2) The Boss of all Confirmation !!
15 Minutes Break and Retest Divergence.
No 3) Price just hit the Trend for the 4th TIme and Reacted so, What you are expecting that it is going to do when it comes down again !!
Indeed Destroying that trend and going Short !!
No 4) If you Check this particular Pair you on 1 or 4 hours time frame It has already formed a wedge pattern and the price is botteling inside of it !
Rising Wedge === Short !!
Merry Christmass Family, Have a Wonderful Weekend !!
Follow me on Insta to Get connected @Manish686 or Manish_Yadav .
Lets Get connected and grow Together
PS- I learned BlacJac Theory and Divergence Trade From One and only Manny Q ( Master Millionare Educator Of IML)
Macdivergence

Christmas ShortUber has had a lot of recent small bodied candles with bullish wicks. Small body represents small price movement and the long bull wicks show where highs reached during that session. Based off the candles I can see UBER briefly hitting $54 a share but the MACD shows growing bearish divergence and D+ also shows growing divergence. Bollinger Bands have initiated a double sell signal, and RSI is flying high greatly overbought at 63.70.
My trading plan is to short it to $52 a share by 1/8
I will buy 10 contracts as close to $1.00 a contract as possible and let the market take its course.
Looking to make a modest profit of $1-2k
Comment your thoughts below!

Apple To Break Resistance On The 45minI am extremely bullish on AAPL. Technicals are screaming buy and here is everything in detail!
First check out the big green arrow pointing at the top bands, they have crossed at the bottom initiating a buy signal.
Second, candlestick analysis which is my speciality. If you look at the two blue arrows, you can see that small green candles have low hanging bearish wicks. The wick is how low the price went during that 45min interval but did not close. We can see that there is a point of resistance there and it the bulls will not let it fall through. How do I know this? Look at the thin green arrow between the blue arrows, there is a green shadow. This green shadow is bullish divergence meaning bulls are getting stronger. To further go based on divergence, check out the MACD. It went from solid red to a weaker shade of red meaning bearish divergence is weakening. Trend lines have yet to cross, but this could be the week. With an Insanely low RSI of 43.71 compared to where Apple has been sitting, we can expect price to jump up as the stock is underbought.
The teal cloud that the candles are sitting in is a Karutoga Cloud and this shows support and Apple is in the cloud and looks to come back above it continuing its bullish trend.
This is a very exciting technical analysis and I will be putting a medium sized position for this week. I see $130 by the 24th.

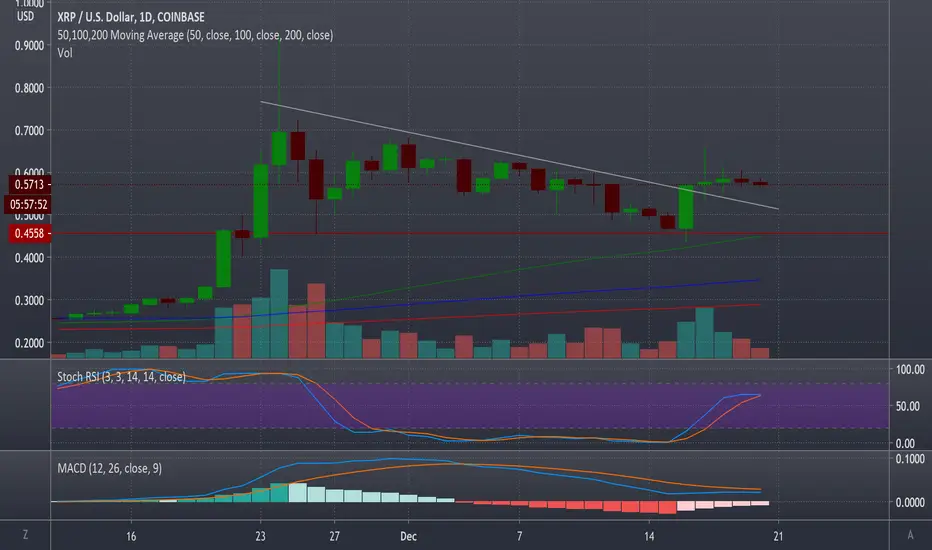
XRP Spring Is Set --> Soon To ReleaseDaily chart showing major consolidation over the last few days.
We are set to make a big move very soon.
This trade could go either way but due to where we are in overall crypto market cycle (dominated by BTC and its 4 year halving's) I think the Bulls will regain control of this market for the foreseeable future.
Corrections and sell offs will happen. They are opportunities to take profits or increase your position.
Santa might bring a little gift called xrp moonshot but only if Mrs. Claus allows....
TIME WILL TELL ALL.
Best wishes.

Friday Price PredictionThis prediction is based on the 4hr chart. MACD shows weakening bearish strength while Bollinger Bands are also starting to trend up.

Long Way From ResistanceUBER is far from resistance, and with growing bullish divergence we can expect it to hit $52 again. I have 10 calls for $52 a share by Friday. On top of the bullish divergence, we already received a buy signal from the Bollinger Bands.
Comment Your thoughts below!

Dip Below $630We should expect Tesla to drop below $630 to re-test resistance. It could possibly near $600. I currently own a $600 put for Friday and I am up 14%. Looking to sell out with a modest profit.
With support nearing $600 a share, and candles indicating a downward swing, I am confident in my position.
Also MACD shows increase in bearish momentum.
Comment your thoughts below.

$600 By FridayHaving fun with weekly option swing trades, I see TSLA falling to $600 a share by Friday. Bollinger Bands about to cross at a high point, moderate RSI, and MACD shows weakening bullish divergence. Cloud shows resistance at $620 a share, and bearish divergence is growing based on the Divergence+ Indicator. My plan is to buy my put when TSLA is up tomorrow and Sell Wednesday or Thursday for a quick profit.
Stay tuned for trade activity


Price Movement Here is my Tesla price movement based on technical analysis. Based on this analysis, I can see the stock price nearing $600 a share or lower by Friday. First, based on the latest three 3hr candles you can see that the price has maxed out at $650. $650 may be the top for Tesla before it tumbles down. Also Bollinger bands are about to cross at the top of the chart initiating a sell signal. RSI is irrelevant in my opinion due to the nature of this stocks fluctuation, however I included it for those who are interested in that piece. MACD is key in this play, it looks as if it will start to trend down. Meaning that bullish strength is weakening.
This is a bold claim to make about a very difficult stock to predict, however I am 2 for 3 on my bold claims. ( See AAPL, BABA, and ROKU publications )
Comment your bold prediction below. Love the support from everyone. Thank You!

The Start Of A Downtrend This may be the start of a downtrend for Tesla, MACD is falling and Bollinger bands have given a sell signal. There is also a sell signal by Divergence+
Comment your thoughts below, how low do you think it will go before an uptrend starts again?
Will be watching on the 1 HR chart all week. I plan on selling my put this week also, already up 40%.

Shorting Watch Party Tesla is due for a major correction but there could be quite some time until that happens. I am looking at the weekly candle for this analysis and I still see room for growth. Bollinger bands have not given a sell signal yet. RSI is capable of going much higher, and MACD shows room for growth. Once I get a sell signal on the weekly. I will be shorting Tesla's correction. I will be updating this daily. ( days the market is open ) and constantly updating the weekly candle chart and as soon as I get a sell signal, I will be shorting.

Almost A BuyAfter an earnings defeat, Zoom is almost a buy again. There are many indicators that explain why I believe it still has room to fall.
I see Zoom hitting or nearing a previous low of $366. Here are the indicators that support my thesis.
MACD: Shows weakening bull strength giving the bears more opportunity to take over as the stock continues to trend down.
Divergence+: Shows no sign of bearish divergence and I believe the stock still has room to fall before retesting a new support
Bollinger Bands: Show that the stock is still at a strong buying point, but trending downward which supports the value to decrease
Kurotoga Cloud: With the candles just falling below the cloud, which shows support and resistance, we can see that a bear cycle is about to start.
Once MACD starts to trend up and bullish divergence grows, I will be buying in.

#GOLD - 1H - What price doesn't reveal. BARRICK GOLD CORPORATION.
Sometimes, price doesn't reveal all the information that the markets might tell. And then, we have to recur to other indicators like volume and hidden divergences.
In this case, we can observe that GOLD (company and metal as well too) have suffered a big hit after or in consequence of US Elections. Down almost -23% since November 6th.
From November 11th to November 24th, the price continued falling but this time, MACD formed ascending minimums. This type of correlation is known as bullish divergences (See pink arrows). Also, if we take a look at volume, there's a MASSIVE amount of operations on November 25th . This type of volume hasn't been seen since March when GOLD started its bullish rally.
The most curious about this session is that this volume took place in a tiny candle with almost none price variation and really near to support. This could be a clear sign of consolidation.
On the other side, GOLD (Metal) is showing signs that bears are no longer in control and price suddenly stopped at USD 1.800 per Oz.
We might spect lateralization with high volume over the next sessions. Then, once the price breaks USD 23.5, we can confirm our hypothesis and open a long position.

OXTUSD: Possible Cup & Handle Pattern FormingHello Traders, we may be seeing a possible cup and handle pattern forming if we hit resistance at the .30 price point. A price movement upwards would be expected upon a successful break of the .30. I've highlighted a few TP price points I will be eyeing as this plays out.
MACD just crossed on the 4Hour.
Very interesting movement. This one has a few different options. So keep tight stop losses and conservative Take Profits.

NZDUSD - Bearish Crab - ShortFX:NZDUSD
A bearish Crab Harmonic pattern has formed on the kiwi-dollar.
We have a 0.618 point B (within 3% margin)
We have a Potential Reversal Zone (PRZ) of 1.618 XA & 3.14 BC at point D.
PRZ connects with resistance line (dotted).
Trade Entry:
On a 4H chart we see a MACD divergence.
Look for reversal candle to form to enter the trade.
Stop loss at 2.0 XA
Take Profit 1 at 38.2% AD
Take Profit 2 at 61.8 AD
Happy Trading!

XAUUSD Technical Analysis 20201123OANDA:XAUUSD
Take at your own risk:
Gold has officially broken through the 1860 Support.
Gold is now in a downtrend in 4H as it has formed a LL and LH in 4H TF.
Daily TF is showing a potential Supply & Demand Area between 1818 and 1875 where Volume Traders and Institutional Traders might come in.
4H TF is showing Divergence in MACD.

BABA Dip Buy Blink WinAlibaba should dip at the open on Wednesday based on the Bollinger Bands, and MACD. However if you look at bearish volume on the MACD you can see it declining. We are getting set up for upward potential. We are far from the moving average and resistance according to the Kurutoga cloud. Moving average is $271 while resistance is $282. These are accurate but Alibaba has the potential to outperform these numbers in the coming weeks. I look to Triple my BABA Call position during the dip tomorrow. IF THERE IS ONE. My predictions are just predictions, I am not an expert. I have been doing well though if you look at my past work. You will see my big wins and fails. Having a great time trading and I am very impressed with all the feedback I received on my first post about BABA. Follow for more and share your thoughts in the comments. I will update those following on my position. MEGA profits ahead of us!

GBP/CHF Long opportunity at 4HGBP/CHF Long opportunity at 4H. Follow for more. Have a nice trading week!

EURUSD 1HR analysis macdas we can see price has had a bullish momentum, but the macd has been going lower toward histogram cross. price could still move higher but the chance is there for a drop
MA values: 55 and 200

RVN slow and easy move!With a lot of correction I am bullish on this coin. it has shown us before that has an unpredictable manner. RSI dipped enough and MACD is turning into green. so I expect that it must touch the edge of KOMO cloud. candles got very far away from the cloud an it must get itself to the edge. so it must go up to the range 250-260 in few weeks.
RLong

