Marketcycle

XRP Holders: XRP goes to $1 dollar soon!!!Waoh guys, we see that XRP still large bulish toward the $1 dollar. Are you interesting to take this trade and let's that XRP work for you!!! I want too!!!
Now, XRP it's so bullish and right now it's into this re-accumulation zone to continue bought!!! And also, using elliot wave analysis we are in the correction #4 in the end phase to then, see a strong impulse so bullish toward the $1 dollar.
So, if you looking the Daily chart, we are into this bullish rising wedge with huge potential to long so long position to earn a good money in medium term.
So guys, I see that XRP it's a brilliant opportunity to buy in these level and also make trading with XRP to long position!!!
So, t put a long posiiton in XRP in the market price with a SL at $0.40 cents toward the $1.10 USD, that it's my target profit trade in 3 Daily chart, the 3 Daily chart it's a chart to trade to medium term to long term to earn good profit!!!
So, guys, good luck in this position!!!

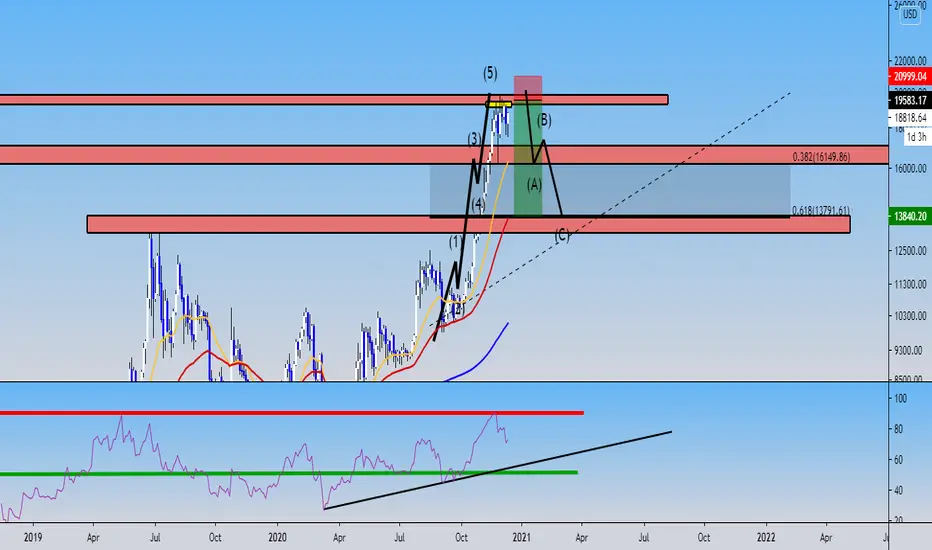
Overview: Perspective for bearish scenario!!!Hello guys, in this overview, I want to include a strategy to sell Bitcoin when Bitcoin reach up the $19k level. In that psycological zone, we would need to take decision.
So, I did analyze the 3 Daily chart and we touch this red zone in the RSI, that indicate sell inminent. Lets me to explain you that:
creating this function, I see that in the pass when in hte end of the bull rally on 2017 that was a important point in the RSI and price action near of $20,000 USD. As a second time Bitcoin touch the highly point in the RSI indicate sell that I remember in June 2019 that Bitcoin was around of $13,800 USD near of $14,000 USD, we have a correction ending the year 2019 with a cotization of $7,200 USD in December 2019. I remember that thing when Bitcoin make this correction in the past year.
And right now, we are in the same time to sell Bitcoin touching as third time, a inminent sell that we would need to see in Bitcoin.
Now in he weekly timeframe, we see the same situatin just using this timeframe and using the RSI to modify the points key, so, I see that we turn to bearish in the next days, just we would need to have a good decision to shorting Bitcoin, and also including the market hunters and manipulations that whales and institutionals make for traders amateurs to will be liquidated. That thing we would need in our hand if in case that Bitcoin it's above of $20,000 USD and break up this mark, we would see in any case possibile hunters here to bear scenario. But looking in my perspective. we have 2 correction if you apply the Fibonacci using the 0.382% and 0.618%. The value are $16,150 USD and $13,800 USD approimately looking these level to bought Bitcoin for discount.
now, remember that I'm in the trade in long time and I say you that maybe Bitcoin it's go back to the $19,500 USD and it's happen right now, the price in this moment it's around of $18,800 USD and we're in profit in Bitcoin and Ethereum. So, I hope that Bitcoin it's touch my target profit at $19,500 USD and later that Bitcoin make it. I will going to hope the Daily's candlestick to know where Bitcoin it's going on. And also, the Daily chart it's important for this case. So, I will still alert on the $19k levels if Bitcoin make any manipulation or good entry to shorting in these levels.
So guys, if you like this idea and plan, please get me a like,share this analysis with your friends, traders or people enghusiastic in the trading of cryptocurrency
Pay Attention on the chart: Bitcoin it's form a bullish signal!!Ok, at the moment, I trade over H4 timeframe. So, to discuss we see that Bitcoin formed 2 chartist pattern, the first chartist pattern it's the bearish channel and the second chartist pattern it's an ascendent triangle. both chartist apttern are indication that the trend it's still bullish.
Ok, at the moment as yesterday I entry around of $18,050 USD and today in the early in the New York time Bitcoin was down arounf of 3%, so it's so nearest that Bitcoin touch my SL, but at the moment my trade it's active for just $87 USD of distance of the SL at $17,550 USD. Waoh, but so incredible how the bulls are still the trend.
So guys, the only update for there was these chartist pattern and my target profit I will going to change a little mroe of $19,500 USD and I believe that Bitcoin needs to go up!!!
So, i didn't say that this scrreenshoot it's very well, but if Bitcoin it's into this ascendent triangle and then, break up, so this elliot wave analysis could be invalided and in this place it's will being the correction #4 of the this cycle to then watching a new impulse #5 toward the near of $23,000 USD.
So guys, we will continue update this par. Also, remember that you can to put a buy order limit in Ethereum, the price action it's confirmed!!!

2nd entry of the gold shorts intraday setup After clearly smashing my previous Gold Intraday target (Prev week highs) Im seeing a possible continuation for this week cycle into the current LOW (Low of the week). Looking for a retest into my level to short this commodity again! LFG!!!

BTC Projection for 2020 using an older marketcycle(2016-17 run)I tried overlaying the old marketcycle to the current. I am really curious how the market will play out, and if similar patterns can be found.
Its still WIP.

BTC Market CyclesBased on this Market cycle map I am predicting that the bull run could last until May 2022.
It would make sense for the top to tag around 100k, but we definitely can ago alot higher.
I would think a 10x from the last high of 20k would make the most sense but an over shoot and push to around 240k to suck over confident bulls in before a new bear market starts and we pull back around 80% to around 35-40k
This is just an estimated based on previous market structure, anything could happen this cycle has we start to see real institutional money start to flow in with the key infrastructure for family offices and high net worth individuals to feel a lot more comfortable putting capital into BTC, and then the fomo begins....

BATUSDI am anticipating a reversal here, this is for investment not necessarily to margin trade. My first target is at $0.40, which would already be doubling your investment.

Trillions IndustryThis Industry is about to catch a part of the fiat supply.
Some of the wealthier person in the world buying big chunk of $at.
.
.
.
.
.
Billions and Billions and Billions and Billions Billions and Billions and Billions and Billions ... www.youtube.com
.
.
.
To bitcoin


Updates: Bitcoin formed a simetric triangle flag!!! Good signalWe're in Bitcoin from Friday and Bitcoin is prepare to a up movement!!! So, investor are buying in this simetric triangle of re-accumulation!!!
As we are in consolidation and re-accumulation in this zone, Bitcoin is prepared to a bullish movement!!! So, I believe that it's arukk a good signal to continue buy more Bitcoin. But, as I have 0.06 lots inverted between these 2 trade, I just trade with 0.06 lots that i still open up these posiiton one from Friday and one from yesterday.
And also, guys, we're forming a elliot wave analysis using this model that I am to prepared for you to understand in the cycle of trend. Remember that my own target is $12,000 USD.
We're in profit in our first trade of Friday protecting our long position and then, our second position is in profit, so at the moment, the break even it's keep in this zone until we see any updated for tomorrow or the next days!!!
Good luck on this position!!!

EGNice distribution phase, not to look ahead too much but this has a big potential to the downside. First TP at EQLs as indicated.


Litecoin is into the good zone of Accumulation: Bullish too!!!In weekly timeframe, we could to appreciat that Litecoin is fomred a simetric triangle, and that obviously show a Litecoin so undervalued and for future, I see a Litecoin so bullish, this is another cryptocurrency that I don't missing out the radar!!!
Also, we could to appreciate a strong resistance line formed on May 2018 and that, the trend was bearish, now, Litecoin is more of 2 years of accumulation and this is another cryptocurrency that I'm in fromd of my eyes to studying!!!
Also, guys I add my link to related ideas about all of Litecoin!!!, and then what we expect for the future of Litecoin!!!

Ethereum is bullish: Stay alert of the chart!!! Long-Term
This is all target to reach the Ethereum as Investment for long-term!!!
Guys, I dont have word to say you, I believe that Ethereum is goes to the parabolic bull run, I don't have any clue that Ethereum goes to down the price, not, we are in the 0.618% of Fibonacci and we are for bulls!!!
Also, if you want to read the future of Ethereum, you can to check it, also I add of Bitcoin too!!!

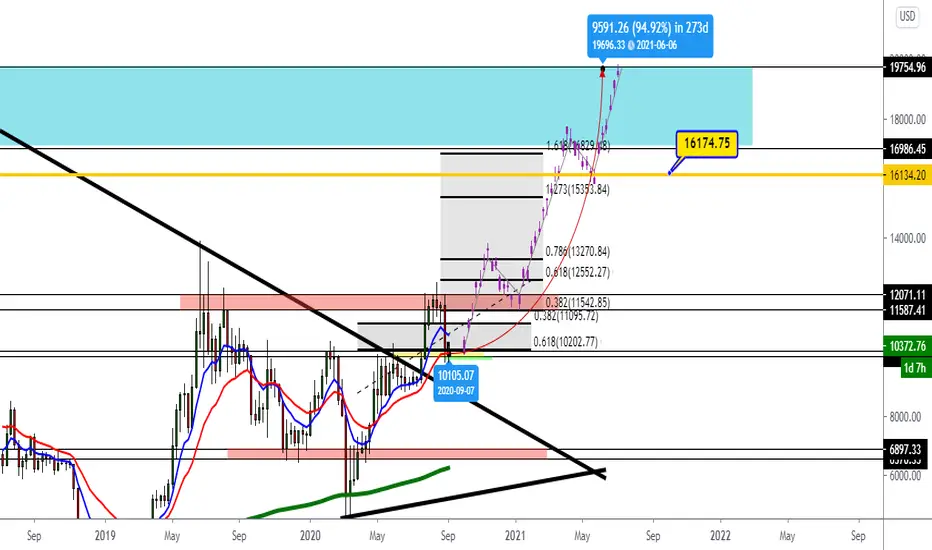
Special Analysis: Why Bitcoin is leading to the bull run?It's a good question that maybe traders, enthusiastic and people ask in their minds. Well , I can see a possible strenghten of the Bitcoin, in any case if Bitcoin is goes to make a consolidation between the $10,000 USD and $12,000 USD, this could be a good signal to buy more Bitcoin and accumulate more Bitcoin between the medium-term and long-term.
Well, in weekly as in Daily timeframe, I speak here in my previously analysis that BItcoin is leave at the 0.618% of Fibonacci. Now, Bitcoin is still bullish for medium-term and also, we could see a possible started of bull run, and guys, it's so imprensidible to buy Bitcoin before to be late, becuase if you not re-accumulate Bitcoin while you make trading operations whether is on Forex, commodities, stocks or cryptocurrency, that options it;s a good idea to earn and accumulate Bitcoin or satoshis.
Also, I have the forecas taht maybe, in 273 days we could see a Bitcoin on the previously maximum so nearly of $20,000 USD on the end of 2017.
Also guys, to leading in the trend, I use the Finonacci trend as point exact to reacch target or all targets and while hte model of possible elliot wave!!!
Also, if you interesting another analyze, I have this analysis of the future of Bitcoin to look out:
Alert: Bitcoin is forming another chartist pattern; not bullish!Hello, in this analysis, Bitcoin is forming a descendent triangle, that is a bearish expectative.
So, guys, in summary, as we are into this kind of chartis pattern, the probability is that we are in fight of bears and bulls, well, as this week the Bitcoin movement was boring, but, I found out another chartist pattern that inmediately we need to see another perspective of the market. I reccomend to closed up your long position, becuase I believe that we may to see another crash taht Bitcoin want's to leading to the $9,000 USD zone's.
And guys, this is H4 timeframe and we see that we are on the elliot wave triangle cycle of ABCDE, and we finished the E to later see a crash inminent, also, if the S&P 500 crash, Bitcoin could to make follow hte S&P 500, that they both we need to check out and make the comparasion.

Ethereum has complete the ABCDE triangle (Elliot Wave Analyze)Well guys, in the moment, Ethereum has the same signal of what Bitcoin do, We are on this ascendent triangle, that mean a bullish pattern and reversal of the trend, magically if Bitcoin up, Etherum up too.
In H4 timeframe we could to appreciate a ascendent triangle in formation to later explode up!!!

Bitcoin entry in Re-accumulation's cycle marketIn the long-term, Bitcoin show a interesting cycle of re-accumulation to continue bought throught the 2020, and also we could to formed a consolidation between the $10,191 USD and $12,000 USD, that is a data that I could to show you and believe it.
But remember that technical analysis in micro-trend we could to experiment and know what Bitcoin do in short-term while the candlestick's studies and supply and demand zones.
Also guys, I invited you to look out my old technical analysis of the future of Bitcoin, it's so interesting to know the model that I prepared for you!!! And the Gold.

What Bitcoin do if could be a sell off in the macrotrend???In this overview, I will focus more in Bitcoin, because we could see for the next days a possible sell of Bitcoin price, so guys, in this timeframe in Daily we found out a shoulder head shoulder, that is a signal of change of trend and maybe we could be to prove lowe levels soon!!!
So, I will focus in mid-term with possible medium term of what Bitcoin could be to make.
I mark this key support line, because is more important and Daily see that we could not to break down, in case that Bitcoin is break down the trend line + Daily support at $10,400 USD, we could see a possible movement at the $9,000 USD. to retest that I see, the part up of the line simetric triangle, that could be the unique and latest confirmation of the starting the bull run.
Now, in weekly remember that we could see a possible accumulation on this zone that I mark, also in the latest 2 weeks ago, I mentioned a possible accumulation that today we could see it.
Stay alert because in minutes I will going to open up a position on Bitcoin because I see a interesting movement!!!

Where Are You Buying Bitcoin? Embrace The BEARGo on, give the bear a hug.
This is where the money is made. Low orders. Long term holds.
Simple Investing.

Eur/Usd Buy setup!!Have a eye on The liquidity level i explained on the video key area before seeing price move to the upside. a lot of buying pressure from institution .
Manage your risk well
Follow me for more upcoming Setup

GOLD/BTC -99.18% CYCLE! Mr.FIBONACCI SUPPORTS BITCOIN BULLRUN!🚀Structure
CORRECTION WAVE: 1 year (13 Bars) ---> 13 = 7th FIBONACCI NUMBER
-99.18% WAVE: 3 years (34 Bars) ---> 34 = 9th FIBONACCI NUMBER
Next TVC:XAUBTC target = 0.0032 BTC
If #Gold pumped 2.5x to 5000$, #Bitcoin will be pumped 100x to 1562500$
Gold est. Market Cap = 25T$
Bitcoin est. Market Cap = 32T$
THIS is VERY RATIONAL since THE FED has been and will be VERY IRRATIONAL
P.S. This Cycle will be trash IF AND ONLY IF money printer go rrrrrrb
#MoneyPrinterGoBrrrr
#NewMonetarySystem
#NextReserveMoney
#PeopleMoney
#BitcoinForLiberty🗽
