ETHUSD Distribution Near Resistance – Breakdown Risk IncreasingEthereum price action is clearly showing distribution behavior below a major resistance zone, where buyers failed to sustain momentum after the impulsive move up. The rejection from the top and the marked Break of Structure (BOS) confirm that smart money has shifted control to the sell side.
After the BOS, price formed a lower high (swing high) and respected the last low, indicating weakening bullish pressure. The current consolidation looks like a bearish continuation setup, where any move toward the swing high can be treated as a potential sell-on-retracement area.
If price breaks below the last low, downside liquidity is likely to be targeted, opening the path toward the major support zone marked on the chart. As long as ETH remains below the resistance and BOS level, the overall bias remains bearish.
Marketstructure

PENDLE – Weekly Structure Higher timeframe structure remains bearish
Price continues to trade below a key resistance after a clear rejection
Previous support has flipped into resistance
→ R/S flip is holding, keeping downside pressure intact
Recent downside move fully filled the lower wick
This indicates liquidity has been taken and short-term relief is possible
On the lower timeframe, a Market Structure Shift (MSS) has formed
→ This suggests a potential corrective move
As long as price remains below HTF resistance, any bounce should be treated as reactive
Bullish continuation only becomes valid after a reclaim and hold
Level-to-level market
Wait for confirmation, not anticipation
Do you expect a corrective bounce or continuation to new lows from here?
Should I break this down on the lower timeframe?
MrC

Microsoft (MSFT) - Context after a pullback | 1DThis chart is not about predicting the next move.
It’s about understanding where the market currently is in its process .
After a strong multi-month uptrend, MSFT entered a corrective phase that brought price back toward its long-term mean. Instead of continuing lower, price began to stabilize and compress , forming a base rather than accelerating to the downside.
Notably, this same price area previously acted as a zone of accumulation , where downside pressure faded and longer-term positioning started to build before the next leg higher. The current behavior shows similar characteristics: reduced volatility, overlapping ranges, and diminishing downside follow-through.
This does not imply an immediate continuation or guarantee higher prices.
What it does suggest is a shift from directional movement into a context-building phase , where risk conditions differ from both trend expansion and panic-driven selloffs.
At this stage, the key question is not “how high can it go?”
It’s “is downside risk still expanding, or has it begun to compress?”
Recognizing that transition helps avoid emotional decisions and premature entries during consolidation.
Context first. Decisions later.

XAUUSD – Structure Holding at the Blue BoxHi fellow traders,
On the 1H XAUUSD chart, I am applying Elliott Wave principles to outline a potential continuation scenario. After a sharp corrective move, price is reacting from the blue box and holding above the key structural level, suggesting the correction may be complete and continuation to the upside remains possible.
I am entering at the current price, with a Stop Loss at 4270.00. My Take Profit is set at 4574.60, targeting continuation within the larger impulsive structure.
If price breaks below the stop level, this trade is no longer valid.
Structure first. Noise second.
Good luck and trade safe!

BTCUSD.P — Wick Above High ≠ Bullish Break of Structure📌 BTCUSD.P — Wick Above High ≠ Bullish Break of Structure
Timeframe: 15m
Market: BTC Perpetual (Bybit)
🧠 Key Observation
Price did not break structure bullishly here.
Although BTC wicked above the prior high, there was no full-bodied close above the previous high’s wick. That distinction matters.
A wick alone shows reach.
Structure requires acceptance.
🔍 What This Means
The prior high was tested and liquidity was taken
Buyers failed to secure a close above resistance
Price immediately stalled rather than expanding
This behavior is consistent with a liquidity sweep, not a confirmed bullish shift in market structure.
⚠️ Why Early Longs Are Dangerous Here
Entering long on the first touch or wick break:
Assumes continuation before confirmation
Exposes the trade to a sweep-and-reverse scenario
Treats intent as fact
In this context, an early long can easily become exit liquidity.
✅ What a Real Bullish Break Would Require
For this to qualify as a valid Bullish BoS:
A decisive candle body close above the previous high’s wick
Follow-through or acceptance above the level
No immediate reclaim back below resistance
Until then, structure remains unbroken.
🧭 Execution Guidance
Patience > prediction
Let the market prove acceptance
If price reclaims the level with strength, bias can flip
If price rejects, the sweep thesis gains validity
Structure is not about being early.
It’s about being right after confirmation.
🧾 Final Thought
Wicks hunt liquidity.
Bodies establish control.
Knowing the difference keeps you solvent.
❗ Disclaimer
Educational purposes only.
Not financial advice.

ETHUSD Bullish BOS | Buyers in ControlEthereum (ETHUSD) is showing clear bullish intent after respecting the key support zone and forming a strong last low, which signals that buyers are firmly defending downside levels. The market has already delivered a Break of Structure (BOS), confirming a shift in momentum from consolidation to bullish continuation.
After a brief pullback and liquidity grab near the BOS level, price quickly reclaimed bullish strength, indicating strong demand absorption. The current structure suggests that buyers are now in control, and price is preparing for a push toward the next resistance and liquidity highs marked on the chart.
As long as ETH holds above the last low, the bullish bias remains valid. Any short-term retracement into structure can be seen as a potential continuation entry, while a clean breakout could accelerate price toward higher targets.

EURUSD – Pullback Into New Support | Continuation ScenarioEURUSD has completed a structural breakout, flipping prior resistance into new support. Price is now pulling back into a clearly defined demand zone, where buyers previously stepped in aggressively.
The blue trendline shows the broader bullish structure remains intact, while current price action suggests consolidation before the next move. As long as price holds above the green support area, the bias favors continuation toward the higher resistance and target zone.
Failure to hold this support would invalidate the setup and signal deeper retracement, making this area a key decision point for the market.
Compression after expansion often leads to another impulse — patience and confirmation are key.
Educational idea only. Not financial advice

EUR/USD Bearish Continuation Inside Descending ChannelThis is a EUR/USD 2-hour chart showing price action moving inside a descending channel, suggesting a short-term bearish structure. Price recently rejected from a clearly marked resistance zone near the upper boundary of the channel and is now consolidating below it.
Key horizontal levels are highlighted around 1.1754 and 1.1726, acting as interim support targets. The chart also marks a lower demand zone near the 1.1700 area, which could be a potential reaction point if bearish momentum continues.
The projected arrows indicate a continuation move to the downside, aligning with the overall channel trend and lower highs/lows structure.

Bullish Channel Breakdown Signals Bearish ContinuationThis is a 3-hour XAUUSD (Gold vs US Dollar) chart from TradingView showing a clear trend transition:
Strong bullish trend earlier, guided by a rising ascending channel.
Price respected the upper and lower channel boundaries while making higher highs.
A sharp bearish breakdown occurred, with price decisively falling below the trend channel — signaling a potential trend reversal.
After the breakdown, price attempted a weak pullback but failed to reclaim the channel.
Two key downside targets are marked:
1st Target: ~4,255
2nd Target: ~4,170
The blue dynamic bands (volatility / Donchian-style channel) show expansion followed by contraction, supporting increased downside momentum.
The projected arrows suggest continued bearish pressure into early 2026 if support levels fail.
Overall, the chart highlights a shift from bullish structure to bearish continuation, with clearly defined downside objectives.

GBP/USD Bullish Continuation Setup – Buyers Holding Strong AboveGBP/USD is trading on the 1H timeframe within a clear bullish structure. Price previously moved inside an ascending channel, showing strong buying momentum, and after reaching the upper area, the market entered a healthy consolidation phase rather than a breakdown—this is a sign of strength.
The support zone below has been well respected, and the marked last low remains intact, keeping the bullish bias valid. As long as price holds above this last low, buyers stay in control and downside risk remains limited.
Currently, price is consolidating just below the key resistance zone, forming higher lows and compressing price action. This type of structure often signals accumulation before expansion. A strong break and close above resistance could trigger the next bullish impulse toward higher levels.
Overall, GBP/USD favors a buy-the-dip and breakout continuation scenario. Holding above support keeps the trend bullish, while a confirmed resistance breakout may lead to strong upside momentum in the coming sessions.

News Only Matters When It Breaks Market StructureDow × News × Market Structure
In trading, news is not powerful because the numbers are big or small. Most information is already priced in by the market. What truly determines the impact of news is not the headline itself, but whether it forces the market to change its existing structure.
According to Dow Theory, a trend remains in place until there is clear evidence of reversal. This leads to a simple reality: good news will not push price higher if the primary trend is still bearish, and bad news will not crash the market if a bullish structure remains intact.
That is why market reactions to news often look “strange.” Sometimes CPI comes out better than expected and price barely moves. Other times bad news hits and price only shakes briefly before continuing in the same direction. The issue is not that the news is wrong, but that it is not strong enough to break the current structure.
News only becomes meaningful when it does one of two things: breaks a key high or low, or ends an existing sequence of higher highs–higher lows or lower highs–lower lows. When price closes beyond the old structure, the market has accepted new information and entered a different phase of movement.
On the other hand, if price spikes on news and then quickly returns to the prior range, the structure has not changed. These moves are mostly noise—emotionally charged, but trendless. The market is merely releasing energy, not changing direction.
In practice, many of the strongest moves actually come from news that is not particularly surprising. That is because the structure was already in a vulnerable state. The news acts as the final catalyst, not the root cause.
So the real task is not “trading the news,” but reading the structure before the news hits. Define the trend using Dow Theory, mark the key structural levels, and then observe whether the news has enough force to break them. Only when structure changes and price confirms does news truly gain trading value.
The strongest news is not the one that creates the biggest volatility, but the one that forces the market to change how it moves. If structure is not broken, every reaction is just an opinion. Only when structure fails does the market give a real answer.

BTCUSD | Intraday Long — Range Re-Expansion ContextContext
An abnormal sell-off during the Asian session positioned price for a re-expansion above the 88,000 level.
As a result, today’s focus shifts toward a long-biased intraday context.
Plan
I am monitoring the 87,300 – 87,500 zone for potential long consideration, only if confirmation factors are present.
Targets
-88,450
-89,000
Risk
Position risk is reduced relative to standard sizing.
This is a context-driven idea, not a blind entry.
Invalidation
The long scenario will be invalidated in the event of an aggressive move and firm acceptance below 87,100.

USD/JPY BULLISH CONTINUATION TREND CHART ANALYISISTechnical Breakdown
Trend Context:
Price previously moved in a rising channel → bullish structure intact on higher timeframe.
Pullback Phase:
The drop from the channel top looks like a healthy correction, not a trend reversal.
Demand Zone / Support:
Price is reacting from a strong demand + horizontal support zone (≈ 155.70–155.85).
Liquidity Sweep:
Stop-loss hunt below support suggests smart money accumulation before continuation.
Market Structure Shift (LTF):
Rejection wicks + consolidation indicate buyers stepping back in.
Trade Plan (Bullish Continuation)
Entry Zone: 155.80 – 155.85
Stop Loss: 155.60 (below demand & structure)
Target 1: 156.11
Target 2: 156.39
Confirmation Signals to Watch
Bullish engulfing / strong bullish close on 15–30 min
Break & close above 156.00
Volume expansion on upside

BTCUSDT — When Price Is Asking Questions, Not Answering ThemBTCUSDT — When Price Is Asking Questions, Not Answering Them
Date: 2025-12-30
Session: NY Futures
Last Price: 87,872
If you’re feeling like price has been almost doing something but never quite following through, you’re not alone. This is one of those environments where clarity feels close, but structure hasn’t actually resolved. I treat that feeling as information, not a problem. Markets often get quiet before they get directional — and forcing certainty during that phase usually comes at a cost.
Recent behavior (last 24 hours)
Over the past day, BTC has remained contained inside its broader daily range. Attempts to move higher and lower have both struggled to hold. Instead of expansion, we’ve seen rotation — back-and-forth movement that suggests the market is still negotiating value rather than escaping it. That behavior matters more to me than any single candle because it speaks to participation and conviction.
Right now, nothing feels urgent. That in itself is useful information.
Why traders struggle in this zone:
This area sits uncomfortably close to levels that could matter without actually crossing them. That’s where traders tend to get trapped into reacting to small moves as if they’re meaningful. When triggers are nearby, every push can feel important — even when it isn’t.
The real danger here isn’t picking the wrong direction. It’s acting as if the market has already made a decision when it clearly hasn’t.
How I’m framing structure today"
Rather than thinking in terms of outcomes, I’m focused on decision boundaries:
Daily Resistance: 90,367.6
Daily Support: 86,406
Upside Trigger: 88,502
Downside Trigger: 87,621
These levels don’t predict anything. They define where behavior can change if price earns it. Until then, they simply frame the environment.
Conditional environments (not expectations):
Above the upside trigger:
Acceptance above this level would suggest the market may be willing to explore higher value. Without acceptance, moves above it remain attempts rather than conclusions.
Below the downside trigger:
Acceptance below here would indicate willingness to explore lower value. Without that, downside movement stays rotational.
Inside the range:
Between these triggers, I treat the market as neutral. This is where overtrading does the most damage. Standing down here isn’t passive — it’s aligned.
Closing thought:
Days like this tend to reward restraint more than activity. I don’t need to anticipate the next expansion — I need to recognize whether it’s actually happening. When structure is balanced, my focus shifts from participation to observation. Letting the market prove intent keeps me aligned with risk, capital, and discipline. If nothing resolves, that’s not a missed trade — it’s confirmation that patience was the right behavior.

ETH/USD Bearish Rejection from Resistance – Breakdown Toward MajEthereum (ETH/USD) on the 1H timeframe shows a clear bearish rejection from the upper resistance zone, where price failed to hold above the recent highs. After the strong impulsive move up, the market formed a sharp reversal, indicating seller dominance at premium levels.
The structure highlights a last low that has now been tested, and price action suggests weak buyer follow-through. With momentum shifting bearish, ETH is likely targeting the major support zone below, as marked on the chart. A decisive break below the recent consolidation confirms a bearish continuation scenario.
As long as price remains below the resistance area, sell-side pressure may continue, and any pullback toward resistance could offer short-selling opportunities, while buyers should wait for strong confirmation from the support zone before expecting a reversal.

HYPE – Weekly Structure Price got rejected from a major weekly resistance
Clear distribution at the highs → structure shifted bearish
Previous support has flipped into resistance (R/S flip)
As long as price stays below this level, downside pressure remains valid
Price is currently consolidating above a local support zone
This area is critical for short-term direction
If support fails on a weekly close, continuation to the downside becomes likely
Bullish scenario only activates if price reclaims resistance and holds
Level-to-level market
No prediction — wait for confirmation. Monitor on the LTF
What’s your bias from here: support hold or further continuation?
MrC

$UNI / Uniswap's $6.00 Is HoldingThe $6.00 weekly level seems to be holding for Uniswap nicely as a reclaim looks to potentially be forming.
We had a break of the downtrend most recently and the slow stochastic is extremely oversold as well. In addition to this, the current weekly candle is above the support point within the demand zone (green rectangle). We still have a lot of week left in the candle though but if we close still above these areas, I will add more to my BME:UNI position.
We shall see. (my prior buys are in the green labels)

QNT 1hr long idea QNT is currently on my active long watchlist, together with other longs I shared earlier.
Price printed a Market Structure Shift (MSS) After the MSS, we now see a healthy retracement back into a key support area.
As long as price holds above support, this zone offers a clean risk-to-reward long setup with upside toward previous highs
Not financial advice. Always manage risk.
👉 Do you think QNT will continue this bullish move, or do you expect a deeper retrace first?

YM at All-Time Highs: Key Levels for Continuation or RotationUnderstanding YM and the Current Market Environment
The Dow Jones Industrial Average futures contract, commonly referred to as YM, represents a price weighted index composed of 30 large, established U.S. companies across industrials, financials, healthcare, and consumer sectors. Unlike the S&P 500, which is market capitalization weighted and broader in scope, the Dow tends to reflect performance in more mature, cyclical, and value oriented companies. Because of this composition, YM often behaves differently from the S&P 500 during periods of rotation between growth and value or when interest rate and macro expectations shift.
Over the past month, YM has generally tracked the bullish tone seen in the broader equity indices, though with its own internal rhythm. While the S&P 500 has continued to be driven by mega cap technology and growth names, YM strength has largely come from financials, industrials, and defensive value stocks. Recent price action suggests a market that remains constructive but increasingly selective, with participants sensitive to valuation, positioning, and year end flows. Overall sentiment remains cautiously bullish, though signs of short term exhaustion have appeared near the highs
What the Market has done
• Since the start of December, buyers have consistently stepped up bids, establishing higher value and maintaining control of the broader auction.
• During the second week of December, buyers defended the 1 December weekly High Value Node, which provided a clear structural base. This defense allowed prices to rotate higher and ultimately make new all time highs.
• In the third week of December, profit taking emerged from buyers near the highs. The market was unable to accept at all time highs and began auctioning lower.
• Price rotated back down toward the 1 December weekly High Value Node, where buyers once again responded and bid price higher, pushing the market back toward all time highs into last week.
• This behavior reflects a market that remains supported structurally but is increasingly two sided near extremes.
What to expect in the coming week
The key level to monitor is the 48650 area, which aligns with the previous week’s VPOC and the 15 December weekly Value Area High
Bullish scenario
• Buyers could initiate from the previous week’s close at 48998 and attempt to push price higher toward new all time highs.
• Alternatively, price may retrace back toward the 48650 area, where buyers are expected to respond and defend the level.
• A successful defense at 48650 could lead to a rotation back up toward 49294, the current all time high.
• Continued buying pressure could extend the move toward 49430, the weekly 0.5 standard deviation high.
• Profit taking may emerge near 49430, potentially causing the market to rotate lower in the short term.
• If buyers are able to maintain acceptance above this area, continuation toward 49838, the weekly 1 standard deviation high, becomes possible.
Neutral scenario
• If the market makes new all time highs but fails to accept above the 48998 previous close, sellers may respond.
• Seller response is likely near the 49420 area, which aligns with the weekly 0.5 standard deviation high.
• A failure to accept higher prices could result in a rotation back down toward the 48650 area.
• Buyers are expected to respond again near 48650, supporting price and slowing downside momentum.
• A two way auction may develop as the market works to establish higher value.
Bearish scenario
• If buyers fail to defend the 48650 level, this would indicate a breakdown in short term market structure.
• A failure at this level would likely lead the price to move lower through the 15 December weekly value area.
• The market could then auction down toward the 48170 area, which aligns with the 15 December weekly Value Area Low and the weekly 1 standard deviation low.
Conclusion
YM remains in a structurally bullish environment, but recent price action suggests a market transitioning from directional strength to balance near the highs. How price behaves around 48650 will likely determine whether buyers can continue pressing higher or whether the market needs additional time to rotate and build value. As always, context, acceptance, and response at key levels will be critical.
If you found this analysis useful, feel free to like, comment, or share your own view on YM below. Please give this a boost so that more traders in the community can participate. Thank you.
Disclaimer: This is not financial advice. Analysis is for educational purposes only; trade your own plan and manage risk.

BTC/USD Bullish Structure Shift After Strong Support Reaction (1
This 1-hour BTC/USD chart highlights a clear bullish structure forming after a strong reaction from the major support zone. Price respected the support area and printed a solid swing low, followed by a sharp impulsive move upward, signaling renewed buyer strength.
The market successfully created a Break of Structure (BOS), confirming that buyers are regaining control. After forming a higher high (swing high), price pulled back in a controlled manner and defended the last low, which now acts as a key demand area.
The current price action suggests continuation potential, with buyers targeting higher liquidity zones above previous highs. As long as price holds above the last low and support zone, the bullish bias remains intact, and upside expansion toward the next resistance levels is likely.
Key Highlights:
Strong reaction from higher-timeframe support
Break of Structure confirms bullish momentum
Higher low formation shows buyer dominance
Pullback looks corrective, not impulsive
Upside targets remain valid above recent highs

SOL 4H — How a Premium Zone + MSS Creates a Sell OpportunityOn the 4H timeframe, SOL shows a clear example of how market structure and premium/discount theory can be combined to identify high-probability sell opportunities.
After an impulsive bullish leg, price traded into the premium zone (above equilibrium / 50%), where selling pressure is statistically favored in a bearish or transitioning market. Rather than selling blindly at premium, confirmation was required.
At the marked swing high, price delivered bearish displacement, followed by a Market Structure Shift (MSS) as a key prior low was broken. This shift signals a change in order flow from bullish to bearish, indicating that sellers have taken control.
Using this displacement leg, Fibonacci was drawn from the structure high to the displacement low, clearly defining equilibrium and premium. Price then retraced back into the premium zone, aligning with a previous supply / reaction area, forming a high-confluence sell area.
This setup is built on:
HTF (4H) market structure context
Valid swing high that caused displacement
MSS confirming bearish intent
Premium zone as a location for shorts, not a trigger
Entries are refined only after price reaches premium, with invalidation above the structure high. Targets are aligned with opposing liquidity and prior lows.
⚠️ This idea is shared for educational purposes only, demonstrating how structure + displacement + premium zones work together. Always manage risk and wait for confirmation aligned with your trading plan.

XAUUSD Bullish Setup – Buyers in ControlXAUUSD on the 1H timeframe is maintaining a strong bullish structure. Price is moving above a rising trendline, clearly forming higher highs and higher lows, which shows sustained buyer dominance. The pullbacks are shallow and are being bought quickly from the support zone, indicating strong demand in the market.
The last low is well protected, and as long as price remains above this level, the bullish bias stays intact. Current consolidation above the trendline suggests accumulation before the next move. A successful continuation from this area can open the door for further upside expansion, making buy-side momentum the primary focus.

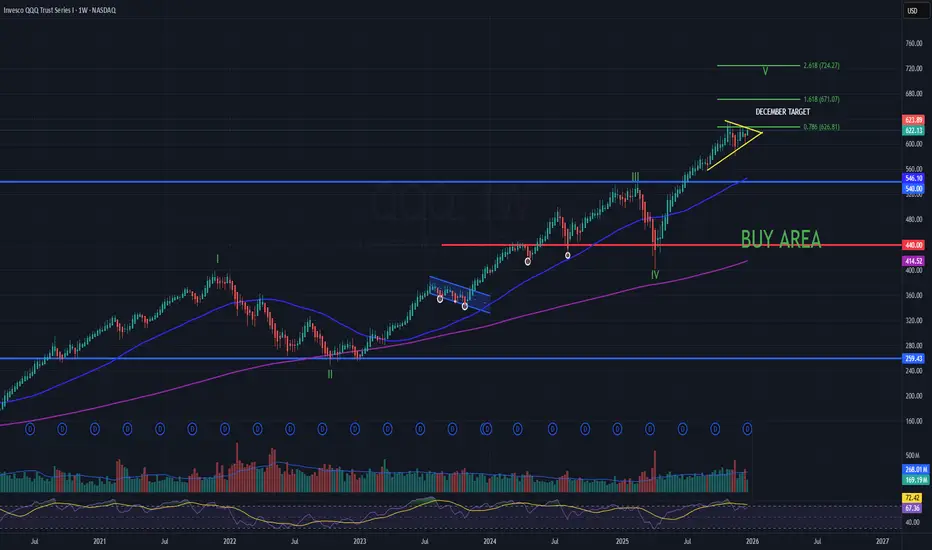
QQQ – Weekly Structure OverviewThesis
Weekly uptrend intact. Price is extended; next decision is breakout vs. consolidation near highs. We are next to the end of the long term bull trend.
Context
200WMA is rising and aligns with major support near 440 (long-term mean reversion / reset zone).
What I see
- Prior stress phases reverted toward the 200WMA (2022 and early 2025).
- Current structure is a rising consolidation near highs (compression).
What matters now
- Continuation remains favored while price holds above key trend support ($600 on chart).
- A clean weekly expansion above the consolidation keeps upside structure intact.
Buy / Accumulation zone
- Long-term accumulation zone: $440 area (200WMA + horizontal support confluence).
Targets
- Extension reference: 2.618 Fib $720s (measured upside within current structure).