XAUUSD Bullish Continuation After 5,076 Reclaim (F.R.I.D.A.Y.)Gold remains in a strong bullish market structure, despite the recent corrective pullback. The bearish move seen on the chart represents a liquidity sweep and momentum reset, not a structural breakdown. Price continues to respect higher-timeframe support, keeping the overall bias firmly bullish.
Under the F.R.I.D.A.Y framework, this type of pullback is expected during strong trends and is often followed by continuation once key intraday levels are reclaimed.
🔑 Key Level in Focus: 5,076.92
If price reclaims and holds above 5,076.92, it will jump to 5100.82m this level acts as:
- A bullish continuation trigger
- A reclaim of prior intraday supply at Confirmation that buyers are back in control
This is invalid if the bullish idea for price: Fails to hold above reclaimed resistance it will fall back to 5032.86
Breaks and closes decisively below the higher support structure
Overall sentiment: LONG ✅
Here’s the clean F.R.I.D.A.Y justification behind that call:
HTF structure is bullish (higher highs, higher lows still intact)
Recent sell-off was a liquidity sweep, not distribution
Price is holding above key demand / reload zones
Momentum is resetting, not reversing
Buyers are defending structure, sellers lack follow-through
Under F.R.I.D.A.Y logic, this environment favors buy-side continuation, not shorting.
What would flip sentiment to SHORT?
Only if:
Price fails to reclaim 5,076.92
And breaks + closes below key support with displacement. Until that happens, shorts are counter-trend and lower probability.
Our Bias stays LONG until structure says otherwise.
Marketupdate

Three Indicators I Use to Read the Market: EMA – RSI – VolumeAfter years of observing different markets—from gold and forex to crypto—I’ve come to a very clear realization: price never moves randomly. Every move only truly matters when it exists within the right context. And to read that context, I don’t need a chart crowded with indicators. I keep just three familiar tools—enough to understand what state the market is in and how I should respond to it.
For me, EMA is the market’s skeleton. When price holds steadily above the EMA lines and pullbacks remain clean and controlled, I can clearly feel that a trend is being maintained—calm, orderly, and without panic. On the other hand, when price stays below EMA and rebounds are weak and short-lived, the picture becomes clear in the opposite direction. What matters most is the slope of the EMA. An upward-sloping EMA tells a very different story from one that is flat or starting to roll over. With just that, I can already tell whether the market is trending, correcting, or stuck in balance. And simply identifying the correct state of the market already determines most of the quality of any analysis that follows. In practice, EMA 34 and EMA 89 are the two levels I rely on the most—they act as familiar anchors to help me orient myself.
RSI plays a different role. It doesn’t give me structure; it gives me rhythm. When RSI stays elevated for a prolonged period, I don’t just see strong price action—I see buyer initiative and sustained conviction. When RSI starts to fade while price hasn’t dropped much yet, that’s when I sense momentum slowing down, like a breath becoming heavier. And when RSI hesitates around the neutral zone, it often coincides with moments when the market needs time—to absorb order flow, rebalance emotions, and prepare before choosing its next direction.
Volume is the final piece—and an indispensable one. Price can break highs or lows, but without volume backing it, that move is still unconvincing to me. When price expands alongside steadily rising volume, I see real participation and genuine commitment from the market. Conversely, when price travels far but volume fails to follow, it usually signals hesitation—a level that hasn’t been fully accepted yet. Volume helps me distinguish between a move with solid backing and one that’s merely technical, driven more by inertia than by belief.
Three indicators, three different perspectives—but when placed together, they form a complete picture of the market.

BTC medium to long term doesn't look goodHello traders,
BTC is following the classic market maker's sell off pattern a classic distribution.
Each bounce is corrective, not impulsive. 2025 top will not be reached again for now. Not before 2027 imo. If you bought high, welp...sell at any price jump to mitigate as much damage. This is how sell-off models work:
➡️ breakdown
➡️ relief rally to rebalance inefficiency
➡️ continuation lower
As long as price fails to reclaim previous value areas, rallies remain sell opportunities, not trend reversals. The path forward favors range-to-range repricing, with volatility expanding during markdown before a new base is formed.
Bias: Bearish until proven otherwise.
Good Luck!
All our analysis is shared with honesty, care, and real effort. If you find value in it, a like or comment means a lot to show your support🙏📊

GBPJPY: Last 600+ Bullish Push Before Major Swing Sell! HAPPY NEW YEAR 2026🎇
GBPJPY Overview📊
🔺The most significant buying move we anticipate will shape the market. The current price is extremely bullish and is likely to continue building new highs; the buying zone we presented has substantial volume.
🔺The British Pound is likely to remain bullish as it has been since the last few months while the Japanese Yen is likely to continue to depreciate.
Entry, Stop Loss and Take Profit📈👨💻
🔺Enter around the blue-marked zone, set a stop-loss below the buying zone and take profit at 218.
🔺Please like, comment and share which will support us to post such more analysis!
Team SetupsFX_

BTCUSD – 15M Chart 📊 BTCUSD – 15M Chart
Bitcoin made a strong upward move, then entered a consolidation phase. This usually means the market is deciding between continuation or pullback.
Why price is slowing:
Price is facing a resistance zone near 93,000, where sellers previously stepped in.
Multiple candles show rejection from this area, indicating supply.
Role of EMAs:
EMA 9 & EMA 21 are acting as short-term dynamic support, showing buyers are still active.
EMA 50 (~92,400) is an important intraday support level. As long as price stays above it, the structure remains healthy.
Possible outcomes:
If price holds above EMA 50 and breaks resistance, continuation toward higher levels is possible.
If price fails to hold EMA support, a pullback toward S1 (~92,200) or S2 (~91,200) becomes more likely.
🧠 Key Idea
This is not a reversal yet—it’s a pause after a strong move. Direction will become clearer after price either accepts above resistance or breaks below support.

This Is a Range — Not a Breakout YetCOINBASE:ETHUSD remains in a range-bound structure, respecting a clear support–resistance box. Price continues to rotate between the 2,900 support zone and the 3,050–3,100 resistance area, with repeated swing highs failing to break higher. This behavior signals range trading and liquidity rotation, not a trending expansion yet.
Recent upside attempts into resistance have been rejected, while buyers remain active near support, keeping the structure balanced. Until a decisive breakout occurs, ETH is likely to continue oscillating inside this range.
Resistance: 3,050 – 3,100
Support: 2,900 – 2,880
Range focus: 2,900 – 3,100
➡️ Primary: hold above 2,900 → range continuation → rotation back toward 3,050–3,100.
⚠️ Risk: clean break below 2,900 → downside extension toward the lower demand zone.

Ethereum Is Compressing — A Volatility Expansion ETHEREUM (ETH/USD) – 4H MARKET ANALYSIS
Market Structure Overview
- Ethereum is currently trading inside a clear range-bound structure on the H4 timeframe.
- Price is being capped by a strong resistance zone around 3,030–3,080, where previous impulsive moves were aggressively sold.
- On the downside, buyers are consistently defending the support zone around 2,880–2,920, forming repeated higher reactions.
- This behavior confirms compression and volatility contraction, often preceding an expansion phase.
Key Observations
Multiple rejections at resistance show supply dominance above, but sellers are failing to push price below support → signs of absorption.
The repeated zig-zag price action inside the range indicates liquidity building, not trend continuation yet.
Volume has decreased compared to the impulsive legs → typical of pre-breakout accumulation.
Scenarios to Watch
Bullish Scenario (Preferred):
A clean break and acceptance above the resistance zone (~3,080) could trigger a strong upside expansion toward the 3,200+ area.
This would confirm that the range was accumulation.
Bearish Risk:
If price decisively loses the support zone (~2,880), ETH could enter a deeper corrective leg toward lower demand.
As long as support holds, this remains a lower-probability scenario.
Trading Bias
Neutral-to-bullish while price holds above support.
Best approach: wait for confirmation either a breakout with volume or a strong reaction from support.
Avoid chasing moves inside the middle of the range.
Conclusion
ETH is in a classic range compression phase. The market is preparing, not moving yet.
Patience is key the next clean breakout will likely define the next multi-session trend.

Bitcoin Isn’t Weak — It’s Building the Break That Traps BTC / USD – H4 ANALYSIS
Market Structure
BTC is still locked inside a broad high-liquidity range, not in a downtrend.
Multiple failed breakdowns from the support zone confirm buyers are defending aggressively.
Price is compressing back toward the range mid–upper area → classic re-accumulation behavior.
EMA Behavior
EMA 34 & EMA 89 are flattening, not sharply sloping down.
This indicates balance → absorption, not trend reversal.
Strong moves usually start after EMAs go flat, not when they’re trending.
Liquidity Context
Current price action is designed to shake both early longs and late shorts.
Liquidity is concentrated:
Above range highs (buy stops)
Below range lows (sell stops)
Market is preparing for expansion, not distribution.
Macro Alignment
No macro shock forcing risk-off right now.
BTC is behaving independently → capital rotation + positioning phase.
This favors range → expansion, not collapse.
Expectation
Short-term: continued choppy movement inside the box.
Medium-term: range high sweep → breakout attempt toward the upper resistance zone.
Only a clean, high-volume breakdown below support would invalidate this structure.

ETH Is Not Recovering — It’s ReloadingETHEREUM (ETH/USD) — 1H MARKET ANALYSIS
Trend Continuation Setup | Macro-Aligned
1. Market Structure Overview
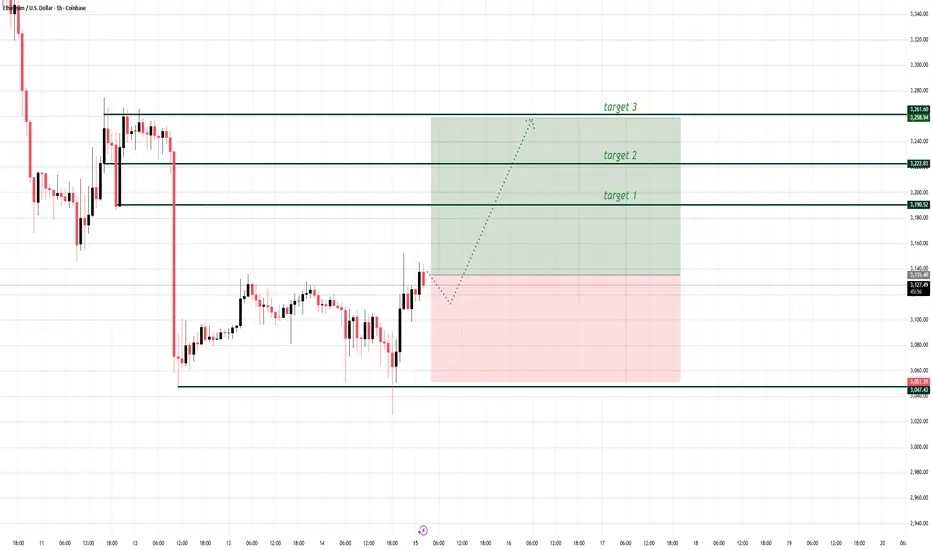
ETH has completed a sharp bearish impulse and is now stabilizing above the 3,050–3,070 demand base. The recent rebound shows acceptance back into value, forming a short-term higher low on the 1H. Structure is transitioning from sell-off to accumulation-within-range, not a full reversal yet, but conditions favor continuation.
2. Key Levels & Liquidity
Primary Demand: 3,050–3,070 (defended multiple times; liquidity already swept).
Mid-Range Acceptance: ~3,135 (current balance point).
Targets (Liquidity Above):
Target 1: 3,190
Target 2: 3,225
Target 3: 3,260
These targets align with prior intraday highs and resting buy-side liquidity.
3. Macro Context (1H Bias)
Macro conditions remain supportive but cautious. With rate-cut expectations still alive and no immediate risk-off catalyst in the session, ETH tends to outperform during stabilization phases after aggressive sell-offs. Short-term flows favor mean reversion higher as risk appetite returns incrementally.
4. Intraday Scenarios
Primary Scenario (Bullish Continuation):
Shallow pullback into 3,105–3,115, followed by bullish continuation.
Break and hold above 3,150 opens the path to 3,190 → 3,225 → 3,260.
Invalidation / Risk Scenario:
Acceptance below 3,050 on a 1H close invalidates the setup and reopens downside toward 3,000 psychological support.
5. Trading Guidance
Favor buy the dip setups near demand; avoid chasing mid-range.
Use confirmation on pullbacks (rejection wicks / bullish closes).
Manage risk tightly; volatility expansion is likely once liquidity above is targeted.
Discipline beats prediction — wait for structure, trade the confirmation, and let liquidity do the work.
BTCUSD – Updated 4H PerspectiveFirst of all, I would like to apologize for the previous outlook from two days ago that did not play out as expected.
Markets are inherently uncertain. As traders and analysts, we do not predict the future — we assess probabilities based on available data.
Price action can always invalidate a scenario, and this is part of trading reality.
This update is provided to reflect new information from the market, not to rewrite history.
Current Market Structure
BTC has failed to sustain its bullish continuation and is now showing structural weakness on the 4H timeframe.
Key observations:
- Price has broken below the short-term ascending trendline
- Momentum failed to follow through after the previous breakout attempt
- Market is transitioning from expansion into distribution / corrective phase
The structure now favors downside continuation or deeper consolidation rather than immediate bullish expansion.
Key Levels to Watch
Immediate Resistance
- 89,800 – 90,500
Former support, now acting as resistance
Price acceptance below this zone keeps bearish pressure active
Support Zones
- 86,500 – 87,000 → First demand reaction area
- 80,000 – 81,000 → Major higher-timeframe demand
- 76,500 – 77,000 → Extreme support / liquidity zone
A clean break and acceptance below 86.5K increases the probability of a move toward the 80K region.
Momentum & Volume Insight
- Stochastic RSI is deeply oversold, but without bullish divergence confirmation
- Oversold conditions alone do not guarantee reversal
- Net volume remains unstable, suggesting no strong accumulation yet
This supports a scenario of price searching for stronger demand lower.
Scenarios Going Forward
⚠️ Primary Scenario – Corrective Continuation
- Price rejects 89–90K
- Gradual move toward 86K → 80K
- Buyers likely reappear only at higher-timeframe demand zones
🔄 Alternative Scenario – Relief Bounce
- Short-term bounce from oversold conditions
- Likely capped below 90K
- Would be corrective, not trend reversal, unless structure is reclaimed
❌ Bullish Reclaim Condition
- Strong 4H close back above 92K
- Would invalidate the current bearish corrective bias
- Until then, bullish setups remain lower probability.
Conclusion
The market has provided new information, and the analysis adapts accordingly.
BTCUSD on the 4H timeframe is currently in a corrective / bearish phase, with downside risks outweighing upside continuation in the short term.
Flexibility and risk management remain more important than directional bias.
Disclaimer
This analysis is for educational and informational purposes only and does not constitute financial advice.
Trading involves risk, and past scenarios do not guarantee future results. Always do your own research and manage risk responsibly.

Today’s Market Rhythm Is All About Precision Entries1. Market Volatility
Gold continues to move in a clean “adjustment rhythm,” reflecting an intraday environment where price is fluctuating inside a bearish structure but still producing technical pullbacks.
Volatility isn’t explosive but it’s precisely enough to create high-accuracy entry zones for intraday traders.
2. Trader Psychology
This is the phase where traders often get trapped by small pullbacks or emotional entries.
But those who understand the money flow can clearly see that price is simply cycling liquidity and adjusting before the next move.
Discipline beats emotion especially in timing-based trading.
3. Key Drivers / Market Reasoning
Market structure maintains:
-A slightly bearish overall trend
-Pullbacks acting as liquidity grabs, not true reversals
-Strong liquidity concentration around 4150–4160
-A clear institutional reaction zone at 4237–4240
Based on current flow, both intraday setups perfectly align with the market’s liquidity map.
4. Trading Strategy
📌 SETUP 1: Timing SELL Zone
XAUUSD SELL ZONE: 4237 – 4240
TP: 4234 – 4229
SL: 4244
➡️ This is a trend-following setup.
4237–4240 acts as a liquidity pocket where price tends to sweep before continuing downward.
The previous A–B–C wave structure supports this downward continuation.
📌 SETUP 2: Timing BUY Zone
XAUUSD BUY ZONE: 4147 – 4150
TP: 4153 – 4158
SL: 4143
➡️ This is a counter-trend setup but perfectly aligned with liquidity behavior.
4147–4150 is a key reaction zone a short-term liquidity base where buyers actively step in.
⚠️ Capital management is essential for both setups to maximize efficiency and protect your account.
5. Trend & Price Outlook
Gold is moving within an intraday correction structure, but the broader bias still leans bearish.
Today’s two timing zones highlight the highest-probability opportunities:
SELL 4237–4240: the ideal rejection area
BUY 4147–4150: short-term corrective demand zone
The previous A–B–C model remains valid, showing that price is completing its adjustment phase before seeking liquidity.
If you follow the rhythm you’ll always be a step ahead of the market.
When timing aligns with structure, intraday trading becomes effortless

GBP/USD: Very Bullish PatternThe GBPUSD pair is currently trading in a long term bullish trend.
Earlier this month, the market established a new higher high, subsequently initiating a corrective movement.
A bullish flag pattern has formed, within which a minor bearish trend has been established.
Yesterday, the pair began to appreciate, with buyers successfully violating the resistance level of the flag.
This development may potentially instigate a trend-following movement.
The next objective is 1.3385.

GOLD SHOOK THE MARKET – STRUCTURE STILL UNBREAKABLE!📌 CURRENT MARKET UPDATE (GOLD – 4H)
The market continues to respect the wave structure exactly as projected:
- Wave (1) – (2) has already completed
- Wave (3) tapped into the Liquidity zone 4250–4260, creating a clean corrective reaction
- Price is currently in a technical retest phase, perfectly normal within a strong macro uptrend
🎯 Key Level to Watch
The Swing Zone 4147–4150 remains solid — this is the core foundation of the entire bullish structure.
- Only if this zone breaks will the trend lose strength
- EMA34 & EMA89 continue trending upward, acting as strong dynamic support
✅ Main Scenario (High Probability)
Price makes a mild correction before pushing up to complete Wave (5) of (3).
Expected pullback zones:
🔹 4210 – 4180
🔹 Reaction confirmation → bullish continuation toward:
- 4310 – 4325 (Resistance)
- 4365 – 4370 (Liquidity – Completion of Wave (C))
Current liquidity flow still favors buy setups at support retest.
⚠️ Sub-Scenario (Low Probability)
If a 4H candle closes below 4147 → deeper correction toward EMA200 (4060–4080).
↳ Currently, there is NO sign of this scenario.
✅ TODAY’S TREND SUMMARY
Trend: Corrective – Accumulation
Optimal Buy Zones: 4210 → 4180 → 4150
Targets:
- 4310 – 4325
- 4365 – 4370
Trend invalidation: Break 4147

Still Watching the Market Move Without You? Fix That Today.1. Current Market Structure
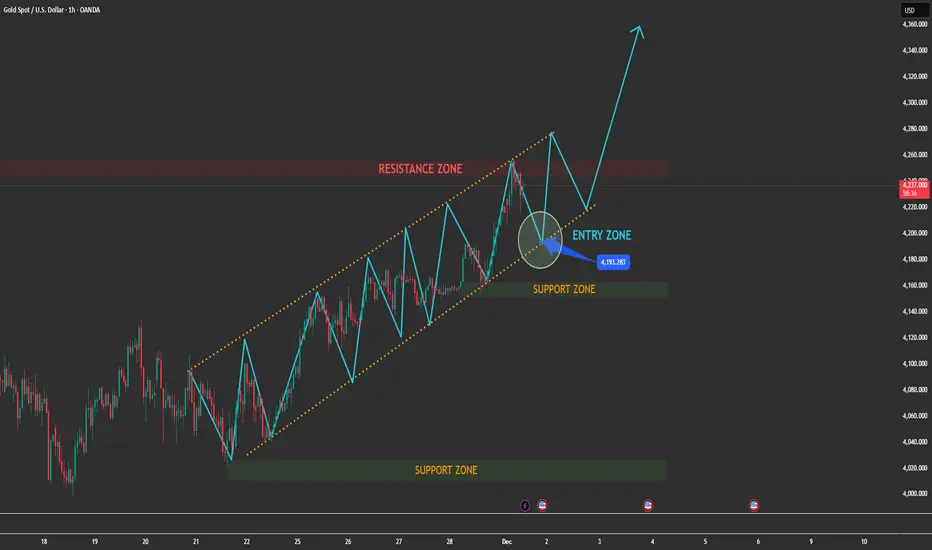
- Gold is moving inside a well-defined ascending channel, respecting each swing high and swing low with precision — a clear sign that the bullish structure is still intact.
- Key observations:
+ Price has just rejected from the resistance zone at the top of the channel.
+ The current correction is healthy and normal within an uptrend, not a reversal signal.
+ Buyers are still defending the structure as long as price stays above the mid-channel + support zone.
+ Momentum remains bullish — any pullback into the highlighted ENTRY ZONE becomes a high-probability continuation setup.
This is exactly how a strong trending market behaves before its next leg up.
2. MAIN TRADING SCENARIO (HIGH PROBABILITY) – LOOK FOR LONG
➤ Scenario: Price pulls back into the ENTRY ZONE (channel bottom + support zone)
Expectations:
Price retests the lower boundary of the ascending channel
Buyers step in at the confluence area (trendline + structure)
A bullish rejection pattern → strong confirmation for LONG entries
Reasons this setup is high probability:
✓ Confluence of trendline support + horizontal support zone
✓ Clear bullish market structure (higher highs – higher lows)
✓ Retracement after hitting channel resistance is expected
✓ No sign of bearish reversal structure at the moment
Upside Target:
Once price bounces from the entry zone:
TP1: Retest of the resistance zone
TP2: Breakout of the channel → continuation to higher highs (as marked on the chart)
3. Alternative Scenario (Low Probability)
If price breaks below the channel and closes under the support zone:
Market shifts into a corrective phase
Wait for structure to rebuild
No aggressive sells — only reassess when major levels break decisively
But at the moment, the bullish structure remains strong.
4. Conclusion
Gold is still respecting its bullish channel perfectly.
The upcoming pullback is NOT weakness — it is an opportunity.
→ Priority: LOOK FOR LONG in the ENTRY ZONE.
→ Target: A new bullish impulse wave forming toward higher highs.
Gold Is Loading Pressure — The Next Breakout Will Be Violent1. Market Structure Overview
Price is currently respecting a rising channel, showing a consistent sequence of higher highs – higher lows, but with gradually compressed momentum near the upper boundary and the resistance zone.
Key observations:
- Price is hovering near the upper trendline of the ascending channel.
- The resistance zone is directly above current price, causing hesitation and wicks.
- The chart shows a potential indecision → correction → continuation pattern forming.
This reflects a market preparing for a bullish continuation, but only after a controlled pullback.
2. Expected Scenarios for Today
✓ Primary Scenario – Bullish Retest Before Breakout (High Probability)
Price is likely to:
- Pull back toward the midline/lower edge of the ascending channel (yellow zone).
- Form a higher low within structure.
- Execute a clean retest of the ENTRY ZONE highlighted on your chart.
- Break above the Resistance Zone → Continue toward higher targets.
This matches your projected structure perfectly.
Entry Logic:
- Wait for price to retest the rising trendline and show bullish confirmation.
- The ENTRY ZONE is valid and aligns with trend continuation.
Upside Targets:
- TP1: 4,215–4,225
- TP2: 4,250+
- TP3 (extended): 4,280+ if the breakout is impulsive.
✓ Secondary Scenario – Compression Before Break
If price stays inside the channel and moves sideways:
- Market remains bullish but indecisive.
- This builds liquidity for a stronger breakout later.
- No selling is recommended unless structure breaks.
This scenario still favors bulls—just slower.
3. Trend Bias (Intraday)
The dominant trend is:
➡️ BULLISH – Buy the dip, do NOT chase breakouts
Signs confirming bullish bias:
- Higher lows remain intact.
- Structure respects the ascending channel perfectly.
- Resistance is tested multiple times → weakening.
- Volume spikes on bullish waves, fades on corrections.
4. Professional Conclusion
Gold remains in a strong bullish continuation structure inside the rising channel.
Your ENTRY ZONE is positioned perfectly for a high-quality retest trade.
Plan of Action:
- Wait for the pullback to the trendline.
- Confirm bullish rejection.
- Enter long within the zone.
- Target the liquidity sweep above resistance.
Smart, calculated, high-probability setup. 🔥

SPX WEEK 48 — Strong Bounce Into Year-End! 2026 BULL RUN COMING?Strong week for the SP:SPX index. After two weeks of hesitation candles, price finally shifted back into strength and pushed decisively higher. This week’s candle not only reclaimed momentum but fully erased last week’s cooling-off behavior.
Price also moved well above the key mid-range levels that traders usually watch to define trend health. It’s now sitting firmly above the major risk zone and continues building distance away from it — a clear sign of strength. From the moment this week’s upside break triggered, the index has gained roughly 1.9%, and that kind of move typically translates into solid returns for options traders playing directional setups.
Major support zones sit lower around 5900, 5100, and the deeper structural support near 4000. As long as price holds above the upper layers of support, momentum remains intact.
On the higher-timeframe monthly chart, the trend has been active for eight straight months with no signs of exhaustion. Price is still far above the level where the monthly trend began, and even further above the long-term midline — showing how dominant the larger trend still is.
The 2-day chart continues to support the overall bullish structure, breaking above short-term levels and maintaining strength after multiple confirmations earlier in the week.
This week was a clean continuation of the broader uptrend — strong candle, strong momentum, and strong positioning above every major structural region.
Elite clarity. Elite precision. More coming soon.

Week 48 Market Update — $SPXStrong week for the SP:SPX index. After two weeks of hesitation candles, price finally shifted back into strength and pushed decisively higher. This week’s candle not only reclaimed momentum but fully erased last week’s cooling-off behavior.
Price also moved well above the key mid-range levels that traders usually watch to define trend health. It’s now sitting firmly above the major risk zone and continues building distance away from it — a clear sign of strength. From the moment this week’s upside break triggered, the index has gained roughly 1.9%, and that kind of move typically translates into solid returns for options traders playing directional setups.
Major support zones sit lower around 5900, 5100, and the deeper structural support near 4000. As long as price holds above the upper layers of support, momentum remains intact.
On the higher-timeframe monthly chart, the trend has been active for eight straight months with no signs of exhaustion. Price is still far above the level where the monthly trend began, and even further above the long-term midline — showing how dominant the larger trend still is.
The 2-day chart continues to support the overall bullish structure, breaking above short-term levels and maintaining strength after multiple confirmations earlier in the week.
This week was a clean continuation of the broader uptrend — strong candle, strong momentum, and strong positioning above every major structural region.
Elite clarity. Elite precision. More coming soon.

Bitcoin Loading a Breakout Continuation 📌 TECHNICAL ANALYSIS — BTC/USD (1H)
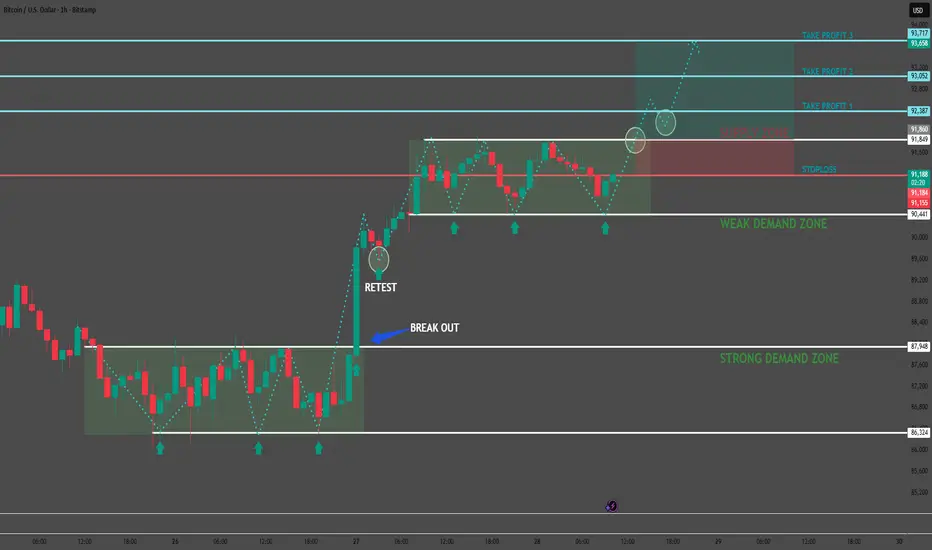
The market continues to maintain a clear bullish structure, with a consistent sequence of higher lows (HL) forming directly inside the Weak Demand Zone. After breaking out of the previous consolidation range, price delivered a clean retest, followed by a strong impulsive move upward confirming solid buy-side absorption.
🎯 PRIMARY SCENARIO — Continuation to the Upside
- As long as price holds above 90,850, the bullish structure remains intact.
- The Weak Demand Zone continues acting as a launchpad for bullish continuation.
- A decisive break above 92,387 will likely accelerate momentum and open the door for extended upside targets.
📈 TRADE SETUP (Precision Levels)
- Buy Entry: 91,250 – 91,350
(A pullback into equilibrium before continuation)
- Stop Loss: 90,850
(Protected below demand + previous swing low to avoid noise)
- Take Profit Levels:
TP1: 92,387
TP2: 93,052
TP3: 93,717
📌 TRADE RATIONALE
- The market is printing a textbook Higher High – Higher Low structure.
- Breakout followed by a clean retest confirms trend continuation.
- Demand zones show strong absorption — no lower lows created.
- Clear liquidity void above → high probability for price expansion into higher targets.
- The supply structure above is thin, increasing the likelihood of a breakout.
🔍 SUMMARY
BTC is currently behaving exactly as expected within a bullish continuation model.
As long as 90,850 holds, upside projection toward 92,387 → 93,717 remains the highest-probability scenario.
Stay disciplined — every candle tells a story, but only a patient trader profits from the ending.
Share your thoughts in the comments — what’s your bias on the next move?
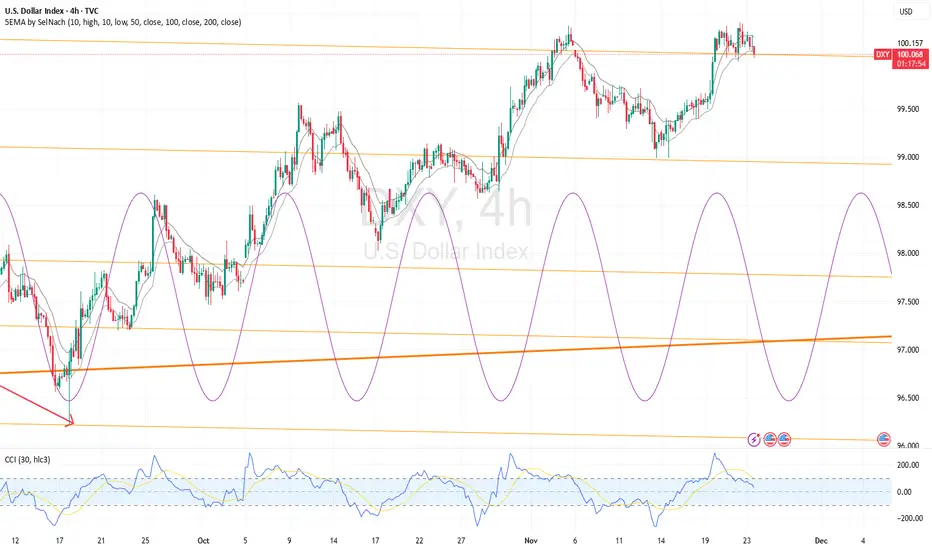
FractalCycles at Work: Analysis of the U.S. Dollar Index (DXY)This chart highlights the dominant 62-period cycle currently steering short-term swings in the U.S. Dollar Index. Price has been respecting the rhythm of this cycle, with recent highs and lows forming close to the projected turning points.
At the moment, DXY is trading near a potential cycle peak, and with the next downward phase approaching, the probability of a short-term pullback increases. Momentum indicators are also softening, offering further confirmation of cycle pressure beginning to turn.
Takeaway:
The 62-period cycle continues to provide reliable structure for timing DXY’s shorter-term movements. If the pattern persists, traders should be prepared for a potential downswing as the next cycle trough unfolds.
LUMN preparing the next step or just warming upLUMN returned to the key accumulation zone near 6.63 and held above this support. The retest created a potential reversal structure on the daily chart. Divergence and increasing volume confirm the presence of demand. A breakout above 7.65 will confirm the beginning of an impulse toward 11.95 and later toward the extension area near 17.27.
L umen Technologies is a major provider of telecommunications and cloud services with a wide data center network. The company serves corporate clients and government institutions with a focus on network infrastructure cyber security and data transmission.
Fundamental picture as of November 23
Lumen maintains stable cash flow and continues to reduce its debt burden. Management improved its profit outlook. Network modernization reduces operational expenses and gradually increases margins. Corporate demand remains stable which supports long term recovery. Revenue growth remains moderate and is still affected by competition and legacy contracts.
Technical view
As long as the price stays above the zone near 6.30 the accumulation structure remains valid. A confirmed breakout above 7.65 will open the path toward 11.95 while a move above that level will allow development toward 17.27. The bullish scenario remains valid while price stays above demand.
Market mood
LUMN looks like the speaker who stayed silent for a long time then suddenly raised a hand. Now the audience listens.

CADJPY – Update & ExecutionYesterday, our CADJPY position was stopped out at 111.65. The trend-changing pattern between Wave 3 and Wave 4 remains valid.
The wave that broke the Wave 3 structure extended beyond expectations, and price has now confirmed a breakdown with a second lower low on the M5 timeframe.
We have re-entered short at 111.94, with a stop loss at the high of the day (112.28).
Our target remains 110.92.

TSLA Losing Momentum – Uptrend Breakdown RiskLooking at the current picture, both news flow and technical signals show that Tesla is entering a challenging phase. A series of recent negative developments — from large funds selling off, to declining sales in China, and Elon Musk potentially taking a loss on his latest share purchases — have clearly shaken market confidence. As a result, TSLA has been under continuous selling pressure, and its price action has weakened significantly compared to the previous bullish period.
On the chart, the resistance area around $447 continues to act as a “steel ceiling”: every touch has been firmly rejected. The recent strong bearish candle pushed TSLA back into the Ichimoku cloud, breaking the short-term upward structure. More importantly, the price is now at risk of losing the uptrend line that has held since April, indicating that medium-term bullish momentum is fading.
If TSLA fails to reclaim the $430–$447 zone in the next recovery attempts, a drop toward $329 becomes a very realistic scenario — this level has been a major support in the past and aligns with the lower boundary of the primary trend channel.

IT SECTORNeed to keep a watch on IT sector next. Not sure when it will break the ongoing resistance zone. but looks like some good potential point are there on the upside.
