Gold’s Parabolic Move: The Deadly Mean ReversionYesterday and today we witnessed a mean reversion happening on Gold and silver where price dumped hundred of pips in minutes. There were massive red displacement candles where price begun snapping violently back down. It was not cause by unemployment news claims or FOMC news on Thursday, price managed to fill three gas in a matter of 30 minutes and it has continued today 30th Jan 2026. Before the mean reversion happened yesterday, there was a double bottom pattern where most people would be waiting for a breakout NYSE session to enter buys, but when I checked the lower TF, the 5 min to be specific, there were very many red candles that were clustered around one area which made me hesitant to enter buys. When price broke out of the 5 minute range, it started selling. I thought it would sell to the days Asian low, but when price got there it started melting.
So why has the mean reversion happened after Gold's parabolic moves? To be honest, I don’t think yesterday’s and today’s mean reversion was a technical one where price was simply overbought and was due for a pullback. It was a flow-based parabolic move, the one of the type where the system itself gets stretched too thin and needs to snap back.
I drew the chart after the meltdown best I could with my excellent drawing skills 😂 to show how Gold has been parabolic for the last few weeks, accelerating higher with increasingly steep candles and shallow pullbacks before the drop.
Some traders have been thinking that this big reversal is about the news on Democrats threatening a government shutdown over immigration enforcement funding in the U.S. over the protests and the killing of Alex Pretti by federal immigration agents in Minneapolis. That incident immediately has drawn political criticism across both parties and led to potential showdown threats over whether Senate Democrats would support funding for the Department of Homeland Security (DHS) unless major reforms to Immigration and Customs Enforcement (ICE) are included. Many Dems have publicly vowed not to approve the DHS portion of the budget until changes like body cameras for agents and new warrant requirements have been enacted, raising the odds of a partial government shutdown.
Days after the shooting and the protests, Democrats even blocked a key spending package in the Senate to force negotiations and bring pressure for those reforms, pushing the shutdown deadline closer. However, by the time the market started its violent downward move, much of this risk had already been reflected in asset prices, traders were forward-looking and positioning for potential political gridlock well before the headlines hit. Expectations for a shutdown were already elevated by midweek based on previous reporting and the markets had priced in uncertainty around ICE funding and DHS negotiations long before the weekend claims data. The question would be, are government shutdowns usually priced in???
So when the price started ripping lower, it wasn’t reacting to the wording of a press release or the latest TV headline, it was reacting to flow dynamics, liquidity demands, and positioning adjustments across multiple markets. In other words, today's “mean reversion” that has happened was driven by how money managers and leveraged players were forced to adjust exposure and lock in profits after an extended parabolic run, not by a classic technical overbought signal.
This helps explain why gold sold off even though a shutdown threat is typically considered a risk-off. If uncertainty and volatility spike while leverage is high, the mechanics of market participants needing cash and risk reduction can outweigh simple narrative expectations about safe havens. In that sense, the reversal is less about political causality and more about market structure and flow reaction in a high-leverage, low-liquidity environment.
The biggest lesson from yesterday and today is that mean reversion does not always look technical, and it definitely does not respect indicators when markets are unwinding leverage. Gold and silver did not dump because they were overbought on RSI, they dumped because the parabolic structure broke, flows flipped, and price was forced to snap back toward equilibrium.
Meanreversion

Mean Reversion in Action | Intraday Structure & Market MechanicsShort-term market moves often appear chaotic, but beneath the surface, price frequently follows statistical and structural tendencies — one of the most important being mean reversion.
This chart provides a clean real-time example of how price behavior stabilizes following volatility expansion.
What Is Mean Reversion?
Mean reversion describes the tendency for price to return toward its short- and medium-term averages after extended deviation.
Rather than forecasting direction, this framework focuses on understanding market mechanics — specifically:
• Volatility expansion
• Distance from trend EMAs
• Momentum exhaustion
• Structural re-balancing
What We Observe Here
Following aggressive downside momentum:
• Price extended significantly below key short-term EMAs
• Volatility expanded rapidly
• Momentum reached short-term exhaustion levels
• Mean distance became statistically stretched
As a result, price began reverting back toward its structural equilibrium zone.
This process reflects mechanical market behavior, not predictive bias.
Why This Matters
Mean reversion is one of the most important principles for understanding:
• Intraday stabilization
• Volatility compression
• Structural resets
• Trend sustainability
Rather than attempting to predict bottoms or tops, observing how price behaves around its structural means offers clearer insight into market condition and participation.
Final Structural Note
When markets experience rapid deviation, reversion toward trend averages is a natural response — especially when volatility becomes extended.
This does not imply directional certainty.
It simply demonstrates how markets normalize after imbalance.

BB + RSI: Ultimate Mean Reversion
BB + RSI: Ultimate Mean Reversion 🍊
🍊 Summary
Most traders use Bollinger Bands or RSI in isolation, but they often lead to "false breakouts" or "riding the bands." This idea breaks down the power of **Confluence**—where mathematical extremes meet market exhaustion—using the **OrangePulse LITE** framework.
---
📊 Visual Breakdown (Analyzing the Screenshot)
1. The Entry: Pure Confluence
Look at the most recent trade on the right side of the chart:
* **Bollinger Bands:** Price pierces the lower band, indicating a statistical deviation from the mean.
* **RSI:** Simultaneously, the RSI drops below 30, confirming that the asset is mathematically oversold.
* **The Result:** This "Sweet Spot" is where the probability of a relief bounce is highest.
2. The "Step-down" Effect (DCA in Action)
Notice the **Yellow line (Average Price)** and **Green line (Take Profit)**:
* Every time a **Safety Order (SO)** is filled (indicated by the small blue arrows), these lines instantly drop.
* **Why this matters:** You don't need the price to return to your original entry to profit. The bot automatically "brings the target to the price."
* In this 1h BTC chart, you can see how the target was brought down significantly, allowing for a much faster exit on the first sign of recovery.
3. Precision & Discipline
Automated trading isn't about "winning every trade" instantly. It's about having a plan for when the market moves against you.
* **Patience:** The bot waits for the exact moment both conditions align.
* **Execution:** No emotions, no hesitation. Just math.
---
⚙️ How to Use This
This exact logic—the confluence triggers, the automated DCA lines, and the real-time status table—is the core engine of the **OrangePulse v3.0 LITE** script.
It's designed to be a reliable "Mean Reversion" tool for traders who want to automate their discipline without complex setups.

The Math of Mean Reversion: How DCA Lowers Your Break-Even Durin
Trading against the trend or catching a "falling knife" is often considered risky. However, when combined with mechanical Mean Reversion logic and Dollar Cost Averaging (DCA), it becomes a powerful statistical approach.
In this educational study, we are looking at how a structured DCA ladder helps a trader survive volatility by dynamically lowering the average entry price.
1. The Concept of Mean Reversion Prices don't move in a straight line. After an overextended move (to the upside or downside), the price tends to return to its "mean" or average. The goal of this strategy is to accumulate a position during the extension and exit as soon as the price starts its trek back to the average.
2. The Logic of Safety Orders (SO) Using the OrangePulse Lite opens-source framework, we can visualize how a position is built:
Base Order (BO): The initial entry based on a signal (e.g., oversold conditions).
Safety Orders (SO): Pre-placed limit orders at specific percentage deviations below the entry.
3. Why the "Break-Even" Moves The most important lesson in DCA trading is the Average Price. Look at the attached chart:
When the first SO is hit, the average price of the entire position drops significantly.
As a result, the Take Profit (TP) line moves closer to the current price.
This means you don't need the price to return to your original entry to exit in profit; you only need a small "relief bounce" to close the entire position.
4. Risk Management (The "DCA Trap") Education wouldn't be complete without mentioning the risks. The danger of DCA is a "black swan" event where the price never bounces.
Max Safety Orders: Always have a limit.
Volume Scale: If you double your size on every step (Martingale style), you run out of capital very quickly. A conservative multiplier (e.g., 1.4x - 1.6x) is often more sustainable.
Conclusion: DCA is not about "hoping" the price goes back up. It is a mathematical way to improve your probability of exit by adjusting your entry price during volatility.
Study this on your charts using the OrangePulse Lite script to see how the ladder handles historical dips.

Recent Movers – Pullback ExamplesRecent session showed several short-term momentum opportunities. The watchlist was created based on a normalized condition: stocks that made a 52-week high within the last three months. From this scan multiple names were selected with focus on viable pullback trades.
A pullback is a short-term counter-move in response to an impulse move. It represents a controlled reversion toward the mean and provides a structured way to participate if momentum resumes.
There is a pullback indicator is shown on the charts as a visual reference. It shows when price moves outside recent behavior and marks the subsequent reversion. The indicator was not made for entries, but for standardization and consistent evaluation.
Example Charts:
ADI
CPRI
CTRI
SOLV
RF
PFG
NTRS
More than 35 percent of the current watchlist is concentrated in the financial sector. This was also visible through sector relative strength over the past month, led by XLB (Materials) and XLF (Financials). This view can support a top-down perspective but is not required.

BG Trade ReviewRecent sessions produced several short-term momentum opportunities. The watchlist was created from a scan for stocks making new 52-week highs within the last three months. From this scan, about 20 names were selected.
There were multiple continuation setups, for example BG, BTU, ADI, M, SOLV, PFG, NTRS, RF, and others. Some names remain indecisive so far, such as CPRI and CSIQ.
The approach is to enter within the pullback rather than on late breakout entries, with the purpose of selling into momentum. This means entries should not be chased and stops are placed at a reasonable distance, since the time of expansion is not predictive.
In this post, I review one of several trades. This is not a best-case setup, but simply the most recently closed trade. In BG, there was a prior momentum move followed by a controlled, somewhat complex pullback, which I most of the time tend to avoid. In this case, however, entry was taken on expansion from a lower reference point. Entry was at 90.70, and the position was sold into third-day highs near 95, resulting in a 1R outcome.
Risk is standardized. Position size is fractal 2% of account, stop is placed at 2-3 ATR with a fixed 1R target. These values and brackets are automated via the risk module . Hopefully, I can review more clear setups in the near future.

Challenges of Fading and OverextensionIntroduction
Fading is a strategy where a position is taken against the prevailing move, based on the expectation that it is overextended and likely to reverse. While mean reversion is a valid market phenomenon, some methods are built on incomplete beliefs about how markets operate.
From Normal to Deviation
Markets can be evaluated relative to their recent or average behavior. Price movement within these bounds is considered normal, while a notable move beyond them is referred to as a deviation. This is interpreted as an overextension, where indicators tend to show overbought or oversold values.
However, overextension does not necessarily imply that exhaustion is present. It simply marks a departure from normal behavior. Whether this leads to reversal or continued movement depends on broader market context.
Markets also tend to exhibit volatility clustering; periods of high volatility are followed by further volatility, and calm periods tend to persist. In other words, a strong move often leads to another. This challenges a common bias that an extended move must suspend or reverse.
The Limitations of Indicators
Indicators can show when price has moved outside a reference point. For example, oscillators, boundaries, or momentum values may signal overbought or oversold conditions. However, these readings are not signals on their own. The broader context matters more and determines whether the move is likely to reverse or continue.
In this chart, price moves outside the upper envelope on two separate occasions, each showing a deviation from recent average behavior. In the first case, the move results in a successful reversion. In the second, price remains extended above the band for several weeks, maintaining persistent momentum. Both instances show similar values, but the outcomes were different. This illustrates that tools should not be interpreted in isolation.
In this chart, RSI reaches overbought levels on two separate occasions. In the first case, the overextension is followed with a mean reversion. In the second, the same condition marks the beginning of a strong upward momentum move. Both events show similar indicator values, but the results were different. This reinforces that identical values can lead to different outcomes depending on the context and underlying structure.
Low Volatile Trends
Low volatility trends present recurring challenges and are worth consideration. These environments are characterized by price moving along structural boundaries with minimal retracement or mean reversion. The absence of counter-movement makes them difficult to fade, as directional drift may persist longer than expected. Attempts to fade these trends or build positions over time can introduce notable risk and limited potential, as reversion remains uncertain. A better approach is to wait for a sharp reversal or the formation of a new structure before considering any setup.
The Risk in Fading Systems
Fading can produce high win rates in range-bound or indecisive markets. Positions tend to be averaged down as price extends further, based on the expectation of a return to the mean. This approach can be effective over a series of trades, but its success depends on eventual reversion.
The risk emerges in less frequent but severe scenarios where momentum persists and price continues to expand beyond expectations. These low-probability but high-impact outcomes tend to be overlooked, but when they occur the consequences can be severe without proper risk control.
This simulation models a high win-rate fading strategy using an initial account size of $100,000. Each trade targets a gain of 0.5% of the account, or $500 based on the starting balance, and the win rate is set at 91.20%. These values are intended to simulate frequent small wins with the assumption that losses will be infrequent.
Losses in this case are set to 5% of the account size, or $5,000, to represent situations where a trader continues to average into a losing position until a maximum loss threshold is reached. In real conditions, some traders may exceed this amount, either deliberately through increased exposure or due to loss of control.
Across 50 simulation runs of 1,000 trades each, the average final balance was $118,109. The best case ended at $240,858, while the worst case dropped to $47,090. The average maximum drawdown was over 43%, and the worst drawdown reached nearly 70%. Half of all simulations finished below the starting balance. These results illustrate that while most trades may perform as expected, rare but oversized losses can and do occur. Despite a strong win rate, the long-term outcome becomes increasingly dependent on avoiding a handful of catastrophic trades.
Strategies like this often appear stable because of their high success rate, which can create a false sense of security. This perceived consistency can lead to increased confidence, relaxed risk limits, or more aggressive sizing. However, the simulation makes clear that even a few failed trades are enough to reverse months of profits or endanger the entire account. Without strict risk control and structural awareness, the strategy becomes vulnerable to failure with little warning and limited opportunity to recover.
Fading as a Valid Approach
Fading strategies are not inherently wrong. In fact, a lot of profitable and well-developed systems are built on the concept of fading strength or weakness. The concepts explored, such as excursion from the mean, structural failure, or climactic behavior, can all serve as valid references.
The problem arises when a move is assumed to have extended too far and must reverse, without clear reference and in opposition to strong momentum. This, combined with poor risk management, can have notable consequences. Therefore, it is essential to have a proper understanding of market structure and disciplined risk control.
Trend Context and Deviation
For traders who prefer to align with the prevailing trend, an overextension can be evaluated as a potential momentum move. In such cases, one approach is to wait for price to pause or pullback, then enter on continuation. This process can be repeated as long as the trend remains intact. A full reversal should not be considered until there is evidence of structural failure, such as a trend break followed by momentum developing in the opposite direction.
Indicators that show overbought or oversold can be helpful in these events. Their purpose would not be to predict reversion, but to serve as a filter that helps avoid continuation entries when price is extended. This can reduce the risk of entries near potential exhaustion, which is a reasonable practice.
This example shows a case where entries are withheld while price is above the upper envelope, which helps to not chase the move. This illustrates how overbought conditions can serve as a simple filter. Note, towards the end price continued even further, which is to be expected at times. Therefore the purpose is not to predict the reversion but to avoid entries at overextended levels without a pause or pullback.

BTC Outlook: Local Bottom → Lower High → Deeper Lows (Q1 2026)📉 BTC Outlook: Local Bottom → Lower High → Deeper Lows (Q1 2026)
After reviewing structure, momentum, stablecoin dominance, and cross-market context, my base case is not a straight-line continuation down, but a two-step process that often traps both sides.
🧩 Current Read
BTC appears to be forming a decent local bottom following a sharp markdown. Momentum has stabilized, short-term divergences are present, and downside velocity has cooled. This favors a relief rally, not a macro reversal.
🔼 Phase 1: Relief Rally into a Lower High
Target zone: 102K – 112K
This area aligns with:
Prior breakdown / supply
Bearish order blocks
Bull Market Support Band + key moving averages
Logical zone for funding reset and long re-engagement
Importantly, this move would not fix higher-timeframe structure. It would more likely act as a Lower High (LH) — a classic distribution rally designed to relieve pressure and trap late longs.
🔻 Phase 2: Rollover & New Lower Lows (Post-New Year)
Target zone: 55K – 69K (Q1 2026)
After a LH is set, I expect renewed downside pressure driven by:
Rising (not yet peaked) stablecoin dominance
Weak broader crypto market structure
Lack of confirmation from traditional risk assets
Typical post-holiday liquidity + macro repricing
This range contains major confluence:
Prior ATH region (~69K)
Macro demand / volume nodes
Historical drawdown symmetry
Mining stress thresholds
⏱️ Why Timing Matters
Holiday liquidity often supports squeezes. January–February historically brings trend resolution, not continuation of holiday moves. A LH into early January followed by downside expansion fits both market structure and seasonality.
❌ Invalidation
This view would be invalidated by:
Loss of 80k from here.
A clean reclaim and acceptance above ~112K
Clear HTF accumulation signals
Stablecoin dominance rolling over decisively
Broad market risk-on confirmation
Absent those, rallies are suspect, not bullish.
🧭 Summary
Local bottom likely in
Relief rally expected
Lower High into 102K–112K
New lows favored in Q1 2026 (55K–69K)
Macro bottom likely comes later, not here
Trade the levels, not the narrative.

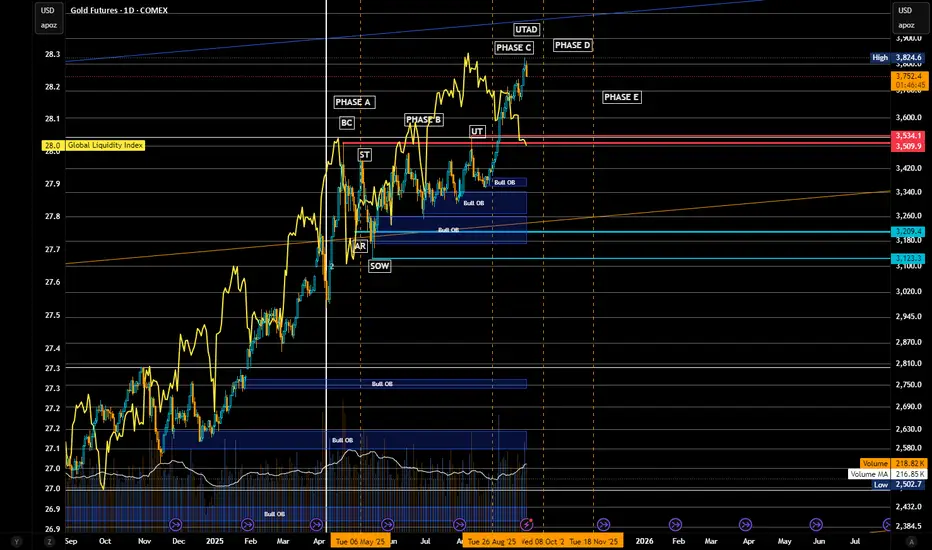
Gold Futures (GC) – “Top Is In” Schematic ReviewExecutive Snapshot 🧭
Primary stance: Bearish swing/top-in thesis (Wyckoff Distribution complete via UTAD).
Bias strength: High, while price remains below 3,825–3,860 and fails to accept above.
Game plan: Fade strength into supply; look for Phase D → E breakdown confirmation → target 3,534/3,509 → 3,209 → 3,123 then extended 2,970–2,795 if momentum accelerates.
Multi-Framework Confluence:
A) Wyckoff (your schematic) ♟️
Phases:
A/B: BC/ST established range highs; AR/SOW tagged mid/low of range.
C: UT → UTAD (new high on diminishing relative spread & mixed volume).
D (now): Throwback rallies holding beneath UTAD; look for LPSY near 3,760–3,825; failure → Phase E markdown.
Validation: Lower highs after the UTAD and repeated rejections of the supply shelf 3,760–3,825.
Confirmation trigger: Break and accept below ICE/Creek = 3,534–3,509 (your pink band) → distribution confirmed.
Macro Frame 🌐
Gold’s cyclical up-leg is extended; near-term macro supports a pause/reversion:
Real yields/beta & USD shocks can catalyze a value-seeking dip.
COMEX time-and-price run suggests heat above without equivalent build in value → mean-revert first, trend later.
Invalidation & Risk:
Hard invalidation (swing): Weekly close > 3,860 and acceptance above for 2–3 sessions (no swift rejection).
Soft invalidation (tactical): Daily close back inside 3,760–3,825 after a breakdown → step aside, wait for next LPSY.
Position/Risk Template:
Initial risk: above 3,825 (or 3,860 for wider swing).
Size: start ½–⅔ unit at first tag/reject; complete size on breakdown retest of 3,534–3,509.
Trailing: swing stop > last LPSY high once 3,534 is lost.
Momentum & Internals (Quick Read) ⚙️
RSI/ultimate RSI (your panels): persistent bearish divergence into UTAD zone.
MACD: high, curling; ripe for signal cross on daily if price slips under 3,600s → 3,534.
Squeeze/Momentum: elevated; release down would align with the distribution thesis.
Execution Checklist ✅
Pre-break:
Fade 3,760–3,825 on rejection candles/footprint absorption.
Track delta & volume—no expansion = stronger distribution read.
Break event:
Daily close < 3,534 → reduce discretion, execute plan; seek retest → LPSY to add.
Manage:
Cover +30–50 handles into 3,209–3,180; roll runner.
Data to watch: USD DXY spikes, GLD OI/put skew, dealer GEX flips around GLD 300.
One-Page Risk Map 🗺️
Bearish while: < 3,825–3,860.
Confirmation: < 3,534–3,509 (close/accept).
Targets: 3,209 → 3,123 → 2,970 → 2,795 → 2,541.
Stop/Invalid: > 3,860 w/ acceptance.
Marked UTAD and supply stack 3,760–3,825 present a clean risk-defined top. Until the market accepts above 3,860, the probabilistic path favors Phase E markdown back toward 3,2xx value and possibly the 2,9xx–2,795 extension if momentum breaks loose.
When Price Gets Ahead of ItselfMarkets love drama.
Price breaks out, momentum accelerates, and suddenly everything feels obvious. Charts look clean, conviction is high, and everyone agrees — this thing is strong.
But here’s the catch: strong doesn’t always mean sustainable.
When price moves too far too fast, it stretches liquidity, pulls in late participants, and often leaves structure behind. That’s when volatility expands, Bollinger Bands® get left in the dust, and the market quietly becomes fragile.
This is where mean reversion sneaks into the conversation — not as a call for collapse, but as a reminder that markets like balance. Extremes attract attention, and attention attracts counter-flow.
Add in order-flow context — like UnFilled Orders (UFOs) lining up near pattern objectives — and suddenly those “obvious” moves don’t look quite as comfortable anymore.
Mean reversion trades aren’t about being right.
They’re about managing risk when price runs ahead of itself.
Because in trading, the real edge isn’t momentum.
It’s knowing when momentum starts to wobble.
Know your specs…
Standard Futures Contract (6E)
Minimum price fluctuation (tick): 0.000050 per Euro increment = $6.25
Typical margin characteristics: ~$2,700 per contract
Micro Futures Contract (M6E)
Minimum price fluctuation (tick): 0.0001 per euro = $1.25
Typical margin characteristics: ~$270 per contract
Want More Depth?
If you’d like to go deeper into the building blocks of trading, check out our From Mystery to Mastery trilogy, three cornerstone articles that complement this one:
🔗 From Mystery to Mastery: Trading Essentials
🔗 From Mystery to Mastery: Futures Explained
🔗 From Mystery to Mastery: Options Explained
When charting futures, the data provided could be delayed. Traders working with the ticker symbols discussed in this idea may prefer to use CME Group real-time data plan on TradingView: www.tradingview.com - This consideration is particularly important for shorter-term traders, whereas it may be less critical for those focused on longer-term trading strategies.
General Disclaimer:
The trade ideas presented herein are solely for illustrative purposes forming a part of a case study intended to demonstrate key principles in risk management within the context of the specific market scenarios discussed. These ideas are not to be interpreted as investment recommendations or financial advice. They do not endorse or promote any specific trading strategies, financial products, or services. The information provided is based on data believed to be reliable; however, its accuracy or completeness cannot be guaranteed. Trading in financial markets involves risks, including the potential loss of principal. Each individual should conduct their own research and consult with professional financial advisors before making any investment decisions. The author or publisher of this content bears no responsibility for any actions taken based on the information provided or for any resultant financial or other losses.

The Anatomy of an Overextended Market MoveMarket Context: When Momentum Accelerates
Markets periodically enter phases where price accelerates rapidly, often driven by a combination of macro catalysts, positioning imbalances, and behavioral feedback loops. In such environments, momentum can appear self-reinforcing: higher prices attract more participation, which in turn pushes prices even higher. While these phases can feel decisive and convincing, they also introduce an important analytical question — is the move being accepted by the market, or is it simply expanding faster than structure can support?
This distinction matters because strong momentum does not automatically imply durability. In fact, the most aggressive moves often carry the seeds of their own instability, particularly when price begins to disconnect from commonly observed reference points such as volatility envelopes, prior value zones, and resting order clusters.
The recent advance examined in this case study provides a clear example of this dynamic: a structurally bullish resolution followed by a sharp acceleration that raises legitimate questions about sustainability.
Pattern Resolution Versus Move Sustainability
Classical chart patterns are useful because they describe how markets transition from balance to imbalance. A double bottom, for example, reflects a failed attempt by sellers to extend lower prices, followed by renewed demand. Once the neckline is cleared, the pattern is considered resolved.
However, pattern resolution only explains directional bias — it does not guarantee how price will behave after the breakout.
In practice, many pattern completions coincide with:
Early participants reducing exposure
Profit-taking activity near projected objectives
New positioning that is more sensitive to short-term adverse movement
As a result, the completion of a pattern can sometimes mark the end of a clean directional phase rather than the beginning of an extended one. This is especially relevant when the breakout is followed by aggressive price expansion rather than gradual acceptance.
Volatility Expansion and the Bollinger Band Framework
Bollinger Bands® are commonly misunderstood as directional indicators. In reality, they function as volatility envelopes, providing context for how far price has deviated from its recent mean.
When price trades:
Outside the upper band
After a gap higher
And remains extended for multiple sessions
it signals volatility expansion, not necessarily trend continuation.
From a statistical perspective, such conditions indicate that price has moved beyond its recent distribution range. From a behavioral perspective, they often reflect:
Late participation
Emotional decision-making
Reduced liquidity on one side of the market
None of these imply that price must reverse immediately. What they do imply is that the informational risk of continuation increases, while the probability of mean reversion back toward equilibrium also rises.
Mean Reversion as a Structural Tendency
Mean reversion is not a prediction tool. It is a structural tendency observed across liquid markets, driven by the constant interaction between:
Value discovery
Liquidity provision
Inventory management by participants
When price moves “too far, too fast,” it stretches these mechanisms. Liquidity providers become more selective, directional participants begin to manage exposure, and resting orders closer to the mean regain relevance.
Importantly, mean reversion does not require a bearish narrative. It simply reflects the market’s natural inclination to revisit areas where participation was previously deeper and more balanced.
In this context, mean reversion should be viewed as a risk consideration, not a directional conviction.
Order-Flow Structure
A key element of this case study is the alignment between classical technical projections and observable order-flow structure, described here through the lens of UnFilled Orders (UFOs).
UFOs represent areas where prior activity suggests the presence of resting interest that has not yet been fully executed. These zones often coincide with:
Prior consolidations
Structural inflection points
Pattern-derived objectives
In the current structure:
o An upper zone near 1.18350 aligns with:
The projected objective of the resolved pattern
UFO resistance
Likely areas of trade closure and sell on-field activity
o A lower zone near 1.16875 aligns with:
UFO support
Areas where price previously attracted participation
A logical mean reversion destination
The importance of these zones lies not in their precision, but in their confluence. When multiple frameworks point to the same areas, they tend to attract attention from a broader range of participants.
Why Overextended Moves Become Fragile
Overextended markets often appear strongest right before they become most sensitive. This is because:
Positioning becomes one-sided
Liquidity thins as fewer participants are willing to transact at extremes
Small shifts in order flow can have outsized impact
In such conditions, price does not need a major catalyst to retrace. It often only needs:
A pause in aggressive buying
Routine profit-taking
A minor shift in expectations
This fragility is what makes mean reversion a relevant consideration after sharp extensions, even within broader bullish structures.
Illustrative Trade Framework (Case Study Only)
To translate these concepts into a practical framework, consider the following illustrative structure, presented strictly as a case study.
o Context
Price has resolved a bullish pattern
Volatility has expanded sharply
Price is trading outside the upper Bollinger Band
o Area of Interest - Upper reference zone near 1.18350, where:
Pattern objectives converge
UFO resistance is present
Trade closure activity is likely
o Mean Reversion Reference - Lower zone near 1.16875, aligned with:
Buy UFO support
Prior participation
The statistical mean
o Risk Definition
Invalidation occurs if price demonstrates acceptance above the resistance zone rather than rejection
This framework highlights an important principle: mean reversion trades are defined by risk first, not by direction. They require patience, flexibility, and a clear understanding of when the underlying premise no longer applies.
Standard and Micro Contracts
This case study can be examined using both standard and micro futures contracts, which offer different exposure profiles while referencing the same underlying market. Understanding their basic specifications is essential, particularly when volatility expands and mean reversion risk increases.
o Standard Futures Contract (6E)
Minimum price fluctuation (tick): 0.000050 per Euro increment = $6.25
Typical margin characteristics: ~$2,700 per contract
o Micro Futures Contract (M6E)
Minimum price fluctuation (tick): 0.0001 per euro = $1.25
Typical margin characteristics: ~$270 per contract
Margin requirements are dynamic, not fixed. They are influenced by market volatility, exchange risk controls, and clearing firm policies.
From a risk-management perspective, the availability of both standard and micro contracts enables traders to align position size with conviction and uncertainty, rather than forcing binary exposure decisions.
Risk Management Considerations
Mean reversion setups carry unique risks. Unlike momentum trades, they often involve entering against recent price direction, which requires:
Smaller position sizing
Wider tolerance for initial adverse movement
Strict invalidation criteria
It is also important to distinguish between being early and being wrong. Overextended markets can remain extended longer than expected. Risk management exists to ensure that such scenarios do not result in disproportionate losses.
Ultimately, the objective is not to capture every retracement, but to participate selectively when structure, volatility, and order-flow context align.
Data Consideration
When charting futures, the data provided could be delayed. Traders working with the ticker symbols discussed in this idea may prefer to use CME Group real-time data plan on TradingView: www.tradingview.com - This consideration is particularly important for shorter-term traders, whereas it may be less critical for those focused on longer-term trading strategies.
General Disclaimer
The trade ideas presented herein are solely for illustrative purposes forming a part of a case study intended to demonstrate key principles in risk management within the context of the specific market scenarios discussed. These ideas are not to be interpreted as investment recommendations or financial advice. They do not endorse or promote any specific trading strategies, financial products, or services. The information provided is based on data believed to be reliable; however, its accuracy or completeness cannot be guaranteed. Trading in financial markets involves risks, including the potential loss of principal. Each individual should conduct their own research and consult with professional financial advisors before making any investment decisions. The author or publisher of this content bears no responsibility for any actions taken based on the information provided or for any resultant financial or other losses.

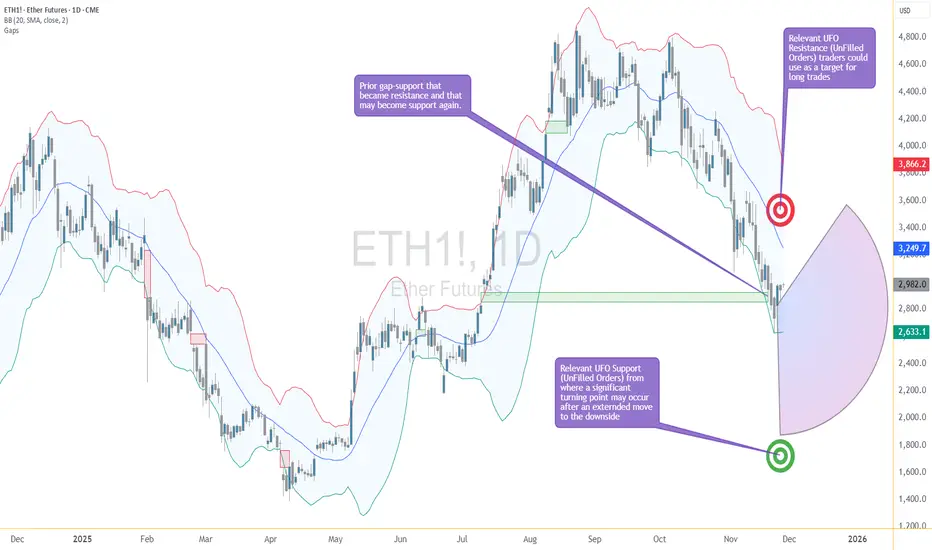
Ether Breaks the Ceiling: Is This the First Real Clue of a Turn?Ether Futures just pulled an interesting move — it finally pushed above the upper edge of the stubborn gap that has been capping price below 2853.5.
For a while, ETH was sliding down the lower Bollinger Band like a chilled skier who forgot how to turn. Now? It just jumped over the fence.
This changes things. A gap break doesn’t guarantee a trend reversal, but it’s the market’s way of saying:
“Hey, sellers… your seat might not be reserved anymore.”
The Old Barrier Is Now the New Test
That closed gap was acting like a reinforced ceiling. Buyers hitting their heads on it didn’t get far — until now. Trading above 2853.5 means the market is testing whether:
Sellers still have ammunition
Buyers can hold the reclaimed turf
Momentum is finally shifting gears
A close and hold above this zone is usually where early reversal logic starts to form.
Next Target: UFO Resistance at 3376.5
If buyers keep control, the next structural “magnet” is near 3376.5, where a cluster of unfilled sell orders waits. Markets love revisiting old unfinished business, and this is the next shelf of potential friction.
It’s not a prediction — it’s just where the roadmap naturally leads once the gap breaks.
Support Below: The New Battleground
What used to be resistance is now a potential support zone. If price pulls back toward the gap’s top edge and stabilizes, it would confirm that buyers have actually taken the wheel.
If price slips back into the gap, then this “break” was just a false alarm — the chart equivalent of stepping on a stair that wasn’t actually there.
Two Quick Read-Through Scenarios
Scenario 1 — Reversal Gains Traction
ETH stays above 2853.5
Buyers defend the reclaimed gap
Market may gravitate toward 3376.5
This would suggest the downtrend is losing its grip.
Scenario 2 — Rejection Back Into the Gap
ETH falls back below the gap ceiling
Sellers reclaim control
Market may return to prior support zones
This would keep Ether in a broader corrective environment.
The key here is not guessing — it’s waiting to see whether the breakout holds.
Futures Traders Have Two Contract Sizes to Play With
Ether Futures (ETH) are the big, fast movers.
Micro Ether Futures (MET) offer the same chart logic, but at 1/500th the size, which makes scaling more controlled.
Whether large or micro, the structure is the same — only the sizing changes.
Quick Specs (Fast & Simple)
ETH contract: 50 Ether
Tick: 0.25 per Ether = $12.50 per contract
Margin: ≈ $44,000 (varies)
MET contract: 1/500th of ETH (good for precision adjustments)
Bottom Line — The Story Just Got Interesting
For the first time in a while, Ether has stopped drifting and started acting. Breaking above the upper gap is the market’s first real sign of a potential power shift.
Now the question becomes simple:
Can buyers hold the line they just captured?
If yes → the path toward 3376.5 opens.
If no → the market falls back into its old bearish rhythm.
Either way, the quiet slide is over — this is where things get lively.
Want More Depth?
If you’d like to go deeper into the building blocks of trading, check out our From Mystery to Mastery trilogy, three cornerstone articles that complement this one:
🔗 From Mystery to Mastery: Trading Essentials
🔗 From Mystery to Mastery: Futures Explained
🔗 From Mystery to Mastery: Options Explained
When charting futures, the data provided could be delayed. Traders working with the ticker symbols discussed in this idea may prefer to use CME Group real-time data plan on TradingView: www.tradingview.com - This consideration is particularly important for shorter-term traders, whereas it may be less critical for those focused on longer-term trading strategies.
General Disclaimer:
The trade ideas presented herein are solely for illustrative purposes forming a part of a case study intended to demonstrate key principles in risk management within the context of the specific market scenarios discussed. These ideas are not to be interpreted as investment recommendations or financial advice. They do not endorse or promote any specific trading strategies, financial products, or services. The information provided is based on data believed to be reliable; however, its accuracy or completeness cannot be guaranteed. Trading in financial markets involves risks, including the potential loss of principal. Each individual should conduct their own research and consult with professional financial advisors before making any investment decisions. The author or publisher of this content bears no responsibility for any actions taken based on the information provided or for any resultant financial or other losses.
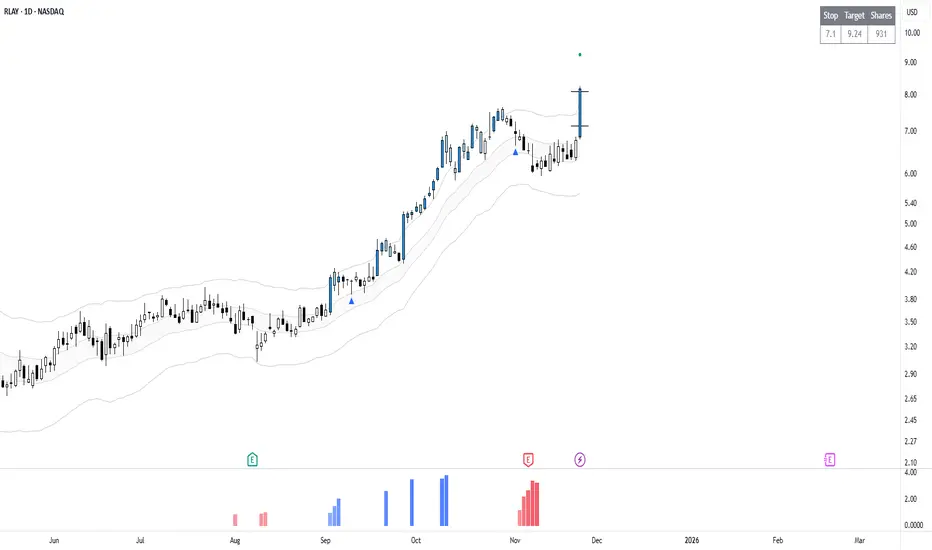
RLAY Trade ReviewThis approach is based on pullbacks. A pullback is a short-term counter-move in response to a strong impulse move. It is a controlled reversion towards the mean, which offers a structured approach to enter in case of momentum resumption. There is no precise execution point, rather approximation and patience.
A weekend watchlist is created using objective criteria and discretion. Alerts are placed and monitored during the week, with entries taken either on a valid pullback condition or in response to indication of continuation.
Watchlist: IMTX, NEE, FDMT, FE, EVRG, RLAY.
FE has been active since November 17 and has bracket orders. No interference.
RLAY Trade
Entry: 7.14
Stop: 2.25 ATR
Target: 1R
Risk: 1% of Account
The target was reached within the same session. Closed at 8.09 for a full 1R result.
If you want more trade reviews, weekend watchlists, or how to build a simple process, comment and let me know.
MVL getting ready to rocketHeavily oversold and a train waiting for its passengers. Signal has triggered, will it zoom again?

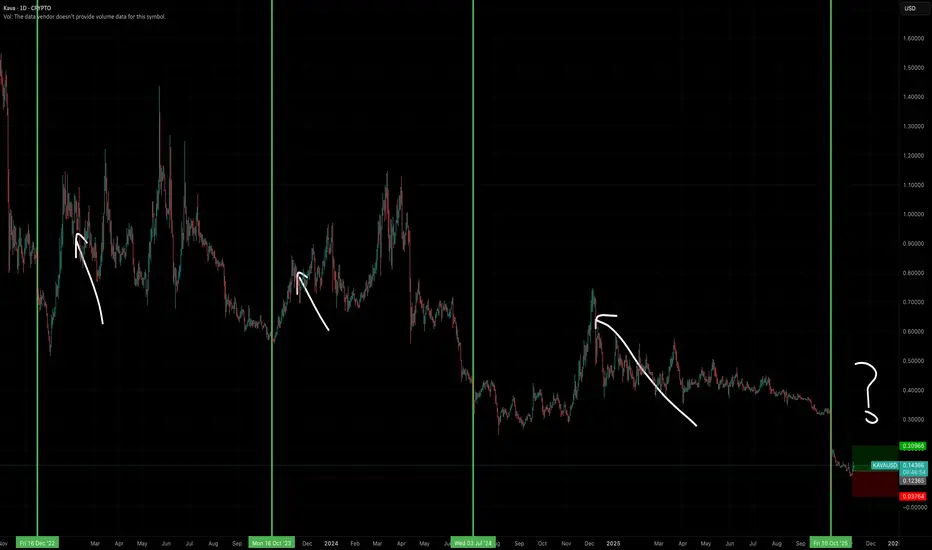
KAVA ready to shootBINANCE:KAVAUSDT is heavily oversold and will likely rebound quickly to complete its mean reversion.
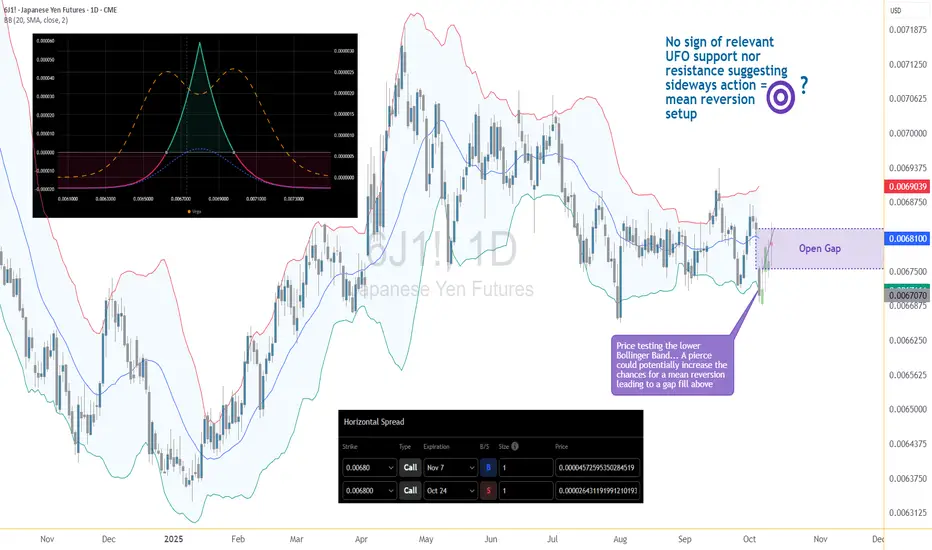
When the Yen Fell Out of Bed — And Time Picked It Up1. Yen Drama at the Open 🎭
The Japanese Yen Futures (6J) woke up after the weekend and immediately faceplanted into the lower Bollinger Band®. Big gap, lots of noise — the classic “what just happened?” moment.
Now, that gap around 0.0068 might just invite a mean reversion, because markets love to clean up after their weekend messes. Instead of chasing direction, we’ll let time do the heavy lifting.
2. The Strategy — A Time-Based Power Nap 😴
We’re running a Horizontal Call Spread (Calendar Spread) — same strike, different expiration dates:
Buy Nov 7 Call @ 0.00680
Sell Oct 24 Call @ 0.00680
You’re basically saying: “Hey, Yen, take your time — but drift a little upward, okay?”
If price chills near 0.0068, theta decay works for us. If it crashes again, we lose just our debit. Simple, elegant, zen.
3. Quick Specs (Because You’re Smart) 💡
Contract size: 12,500,000 Yen
Tick value: $6.25 (0.0000005)
Margin: ≈ $2,800 (outright futures)
Calendar Spread Risk = $237.50 debit
Setup target: gap-fill near 0.0068+
Risk is capped, reward potential roughly 3:1, and all you need is a calm market — not a hero move.
4. The Trader’s Zen Moment 🧘
This setup wins if price stabilizes and time passes — that’s it.
You’re not fighting the market; you’re getting paid for waiting.
While others panic, you’re sipping tea, letting theta do the work.
5. Takeaway 🍵
Gaps often fill.
Time spreads love calm markets.
Less stress, more logic.
Sometimes, the best move in trading is to stop anticipating — and start aging gracefully with your positions.
Want More Depth?
If you’d like to go deeper into the building blocks of trading, check out our From Mystery to Mastery trilogy, three cornerstone articles that complement this one:
🔗 From Mystery to Mastery: Trading Essentials
🔗 From Mystery to Mastery: Futures Explained
🔗 From Mystery to Mastery: Options Explained
When charting futures, the data provided could be delayed. Traders working with the ticker symbols discussed in this idea may prefer to use CME Group real-time data plan on TradingView: www.tradingview.com - This consideration is particularly important for shorter-term traders, whereas it may be less critical for those focused on longer-term trading strategies.
General Disclaimer:
The trade ideas presented herein are solely for illustrative purposes forming a part of a case study intended to demonstrate key principles in risk management within the context of the specific market scenarios discussed. These ideas are not to be interpreted as investment recommendations or financial advice. They do not endorse or promote any specific trading strategies, financial products, or services. The information provided is based on data believed to be reliable; however, its accuracy or completeness cannot be guaranteed. Trading in financial markets involves risks, including the potential loss of principal. Each individual should conduct their own research and consult with professional financial advisors before making any investment decisions. The author or publisher of this content bears no responsibility for any actions taken based on the information provided or for any resultant financial or other losses.

BTC “Blow-off” confirmed, what’s next?Newest chart (H&S with RS near 118.7k, high 124.5k, supports 110.9k / 108.7k / 95.1k / 96.5k / 77.3–74.5k) shows we did get the blow-off extension I had at 13%. We now re-weight the next path conditional on a completed blow-off.
🎯 Short to $73K — plan, gates, and guardrails
It’s feasible only after losing: $110.9K → $108.7K → $103–101K → $96–95K
Risk guardrails (objective invalidations) 🚧
Primary invalidation: Daily close > 118.7K (your RS/supply).
Hard invalidation: Momentum HH > 120.5K and sustained bid above; expect squeeze back to 123–125K.
Trailing logic:
After 110.9K breaks → trail to entry.
After 108.7K breaks → trail to 111.0–111.5K.
After 101K breaks → trail to 105–106K.
After 95K breaks → trail to 99–100K.
Position management 🔧
Scale targets: 108.7K, 103–101K, 96–95K, 90–88K, 83–78K, 75–73K.
What would help the $73K path 📉
Clean acceptance below 95K (no immediate reclaim).
ETF flow cool-off (you’ve been tracking this) + weak spot bid during futures-led dumps.
CME term structure flattening/inversion into breakdowns.
OBV / CVD making lower lows as price ranges (distribution tells).
What would hurt it 📈
Swift 118.7K reclaim on strong spot-led buying.
Persistent positive ETF net inflows on down days.
Perp funding resetting positive while price refuses to break 108.7K.
Aligned with the post–blow-off distribution thesis. Hold the short only as long as 118.7K isn’t reclaimed and the market accepts below 110.9K → 108.7K. The hinge zone is 96–95K; lose it cleanly and $83–78K → $75–73K opens up. Manage via staged profits and a rising trailing stop so the trade can breathe on the way to $73K objective.

Options Blueprint Series [Advanced]: Gap Fill Time Spread Play1. The Market Context — Yen’s Weekend Gap and Mean Reversion Setup
The Japanese Yen futures (6J) reopened after the weekend with an aggressive downside gap, immediately catching the eye of volatility traders. Gaps of this nature are often emotional reactions to global macro news or overnight FX shifts — yet, when structural levels like the Bollinger Band lower boundary are involved, traders begin to anticipate a mean reversion rather than continued momentum.
This is exactly what we see on 6J:
Price plunged into the lower Bollinger Band, finding temporary balance near 0.0067+, while the middle band — representing the 20-period mean — sits around 0.0068+. The gap above remains open, and that area coincides with the Bollinger mean, creating a convergence between technical equilibrium and market memory.
Historically, the Yen tends to exhibit mean reversion behavior after outsized weekend gaps, as liquidity normalizes. That statistical tendency does not guarantee results, but it provides the foundation for a non-directional strategy applied with a slight directional bias — exactly where options on futures can shine.
2. Strategy Rationale — A Non-Directional Tool Used Directionally
Instead of a pure directional play (like buying calls), we opt for a Horizontal Call Spread — also known as a Calendar Spread or Time Spread — positioned around the 0.00680 strike. This structure allows us to express a view on time and volatility, rather than raw price movement.
Objective: capture a modest recovery or stabilization near 0.0068
Approach: profit from time decay and implied volatility behavior as the front option (short leg) loses value faster than the back month (long leg)
Outcome: defined risk, limited exposure to violent swings, and a smoother equity curve
In essence, we’re using a non-directional strategy (time-based) in a slightly directional context (mean reversion target) — a powerful way to let the clock, not the market, do most of the work.
3. Constructing the 6J Horizontal Call Spread
Let’s break it down with specific contracts:
Buy Nov 7 Call (0.00680 strike)
Sell Oct 24 Call (0.00680 strike)
This combination forms a calendar spread, where both options share the same strike but different expirations. The trade is initiated for a net debit, meaning we pay a small premium upfront for the position.
Mechanics
As time passes, the shorter-dated Oct 24 call decays faster.
If price drifts toward the 0.0068 area by the front expiry, the short leg expires near-the-money (or worthless), while the back-month call retains time value.
The spread expands — producing the ideal outcome.
The position benefits from stabilization, controlled volatility, and time decay alignment — instead of needing a directional surge.
Greeks behave in a nuanced way:
Theta: positive near the target zone
Vega: long volatility — the position gains if implied volatility rises in the back month
Delta: small positive exposure (mild bullish tilt)
That’s the “slightly directional” essence of this setup — time-sensitive, but gently leaning toward a gap-fill move.
4. Chart Perspective — The Technical Catalyst
The Bollinger Bands® tell the story clearly.
Lower band: 0.00672 → recent test zone
Mean (20-period average): 0.00681 → target
Upper band: 0.00690 → secondary resistance
The weekend gap remains unfilled, overlapping perfectly with the Bollinger mean.
Should price gravitate back toward equilibrium, the spread reaches its best reward zone as Oct 24 time decay accelerates.
5. Risk Management — Structuring Control, Not Hope
Every options trade begins with a cost — the net debit — which defines maximum risk. This makes the horizontal spread particularly appealing in uncertain environments.
Here’s the structured approach:
Entry zone: 0.0067+ area or below the lower Bollinger Band
Target zone: 0.0068+ (Bollinger mean & partial gap fill)
Stop: below 0.0066575 (recent intraday swing), or no stop at all since the options strategy provides a limited risk natively.
That defines a maximum reward-to-risk ratio of roughly 3:1 when measured against time decay and expected mean reversion distance.
It’s also crucial to track macro catalysts. The Yen can react sharply to U.S. yields or Bank of Japan policy headlines. Avoid holding this position through major FX events if volatility spikes uncontrollably — horizontal spreads work best in stable-to-moderate volatility environments.
Lastly, avoid scaling without liquidity awareness. 6J options are institutionally liquid, but ensure bid–ask stability during execution.
6. CME Context — Contract Specs
Understanding contract size and margin requirements is essential before structuring any options-on-futures strategy.
Contract size: 12,500,000 Japanese Yen
Minimum tick: 0.0000005 USD per JPY
Tick value: $6.25 per contract
Trading hours: Nearly 24-hour access Sunday–Friday
As of recent CME data, the initial margin for the standard 6J futures contract is around $2,800, though this varies with volatility. Traders using options on futures generally post the premium paid as margin (for debit spreads), which in this case is $237.5 (0.000019/0.0000005 x $6.25).
7. Risk, Reward & Realistic Expectations
The goal here is not to “predict” a direction — it’s to position intelligently around time.
A well-constructed calendar spread lets traders participate in short-term stabilization moves with predefined exposure.
If 6J consolidates and slowly lifts toward 0.0068:
The short Oct call decays,
The long Nov retains premium,
The spread widens — success.
If the Yen collapses further or volatility implodes across the curve, losses remain contained to the initial debit — no margin calls, no open-ended risk.
For advanced traders, layering such spreads across correlated expirations can create calendar ladders, offering continuous time exposure while recycling theta — but that’s a topic for another Blueprint.
8. Key Takeaways
Directional calendar spreads can be powerful after emotional gaps.
6J’s gap down plus Bollinger reversion potential creates an interesting time-based setup.
Using non-directional tools directionally provides precision control over risk and exposure.
Proper risk management defines the edge — not prediction accuracy.
This approach emphasizes professional-grade thinking: controlling variables (time, volatility, strike) rather than chasing price movement.
When charting futures, the data provided could be delayed. Traders working with the ticker symbols discussed in this idea may prefer to use CME Group real-time data plan on TradingView: www.tradingview.com - This consideration is particularly important for shorter-term traders, whereas it may be less critical for those focused on longer-term trading strategies.
General Disclaimer:
The trade ideas presented herein are solely for illustrative purposes forming a part of a case study intended to demonstrate key principles in risk management within the context of the specific market scenarios discussed. These ideas are not to be interpreted as investment recommendations or financial advice. They do not endorse or promote any specific trading strategies, financial products, or services. The information provided is based on data believed to be reliable; however, its accuracy or completeness cannot be guaranteed. Trading in financial markets involves risks, including the potential loss of principal. Each individual should conduct their own research and consult with professional financial advisors before making any investment decisions. The author or publisher of this content bears no responsibility for any actions taken based on the information provided or for any resultant financial or other losses.
AUDNZD at Historical Levels - Layer ShortsAUDNZD at Historical Levels - Layer Shorts
Every once in a while, markets reach extreme levels that can be taken advantage of. This is one of those times.
📊 Technical Analysis:
AUD/NZD D1 RSI is currently trading at its highest daily levels ever. We have only seen this once before, in August 2020. What followed then was a 630-pip downside move over the next 4 months.
Could this happen again, and should you short it? Let’s discuss:
🌍 Fundamental Perspective:
The move higher in AUD/NZD has been largely driven by NZD weakness. This stems from deteriorating economic data for the New Zealand economy. Currently, forward markets are pricing in a 0.5% rate cut at the October 8, 2025 RBNZ meeting. This is VERY dovish, and naturally, banks have been selling NZD heavily (as also reflected in EUR/NZD and NZD/CHF).
However, pricing in a double rate cut at the upcoming RBNZ meeting may already be as dovish as it gets. Yes, another cut later this year is possible, but often currencies show their largest moves around key events like rate decisions. The RBA (Australia’s central bank) is also due to announce policy this coming week. So we have two fundamental catalysts in play.
💡 Potential Trade
How can you take advantage of this setup? I would not short it outright. Instead, I would begin layering in small short positions (maximum of 0.2% per 1 ADR). If the market moves 1 ADR against you, you can add another very small position. This way, your average short entry remains close to current levels. Eventually, we are likely to see a mean-reversion move. This may take time, but history shows that at these RSI levels (and even lower), we have often seen significant pullbacks to the downside.
Keep this pair on your radar—it may pay off nicely with patience.
Best,
Meikel

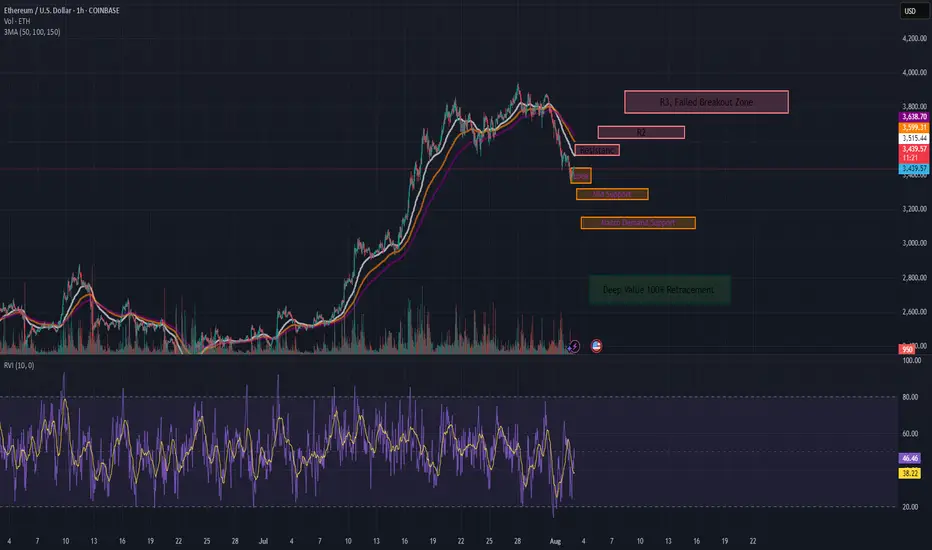
ETH Tactical Long: Laddered Bounce from Absorption ZoneCOINBASE:ETHUSD has been in a steady 1H downtrend, but key support at $3,440 is showing signs of absorption. Volume is thinning on sell-offs, and we're seeing early reversion signals.
This is my over the weekend analysis, not a final recommendation.
Setup Type: Mean Reversion / Absorption Bounce
- Trend: Still bearish on 1H (below 50/100/150 MAs), but slope compression hints at weakening
momentum
- RVI: Below 50, but curling up → early bounce bias
- Volume: Sellers fading into $3,440 = buyer absorption zone
📊 1hr Quant Entry Levels & Laddered Plan
Zone Type Action
$3,440–3,435 Primary Entry Base long entry zone 🔄
$3,420–3,410 Add-on Entry Optional bid stack 🧱
$3,320 Soft Invalidation Trend continuation if lost 🚫
$3,150 Deep Value Wick Low-prob, high-juice trap 💎
🎯 Targets:
T1: $3,515 → EMA cluster rejection zone
T2: $3,600–3,638 → Range midpoint
T3: $3,800 → Trend reversal if reclaimed
⚖️ Risk/Reward: 1:2.5+ (depends on fill ladder)
We are starting entries here, but be cautious if we break through our support levels and you don't have the appetite for the deep value range it may be wiser to wait for a confirming trend or post.
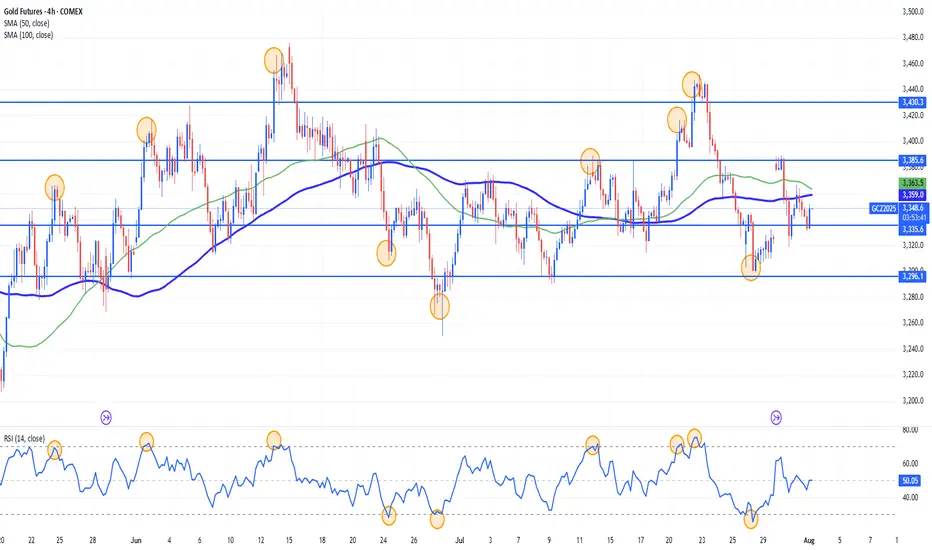
Gold Range-Bound and Ripe for Mean Reversion Plays?Gold has been locked in a sideways, range-bound regime for months, largely oscillating between the 3400 and 3160 levels. This lack of clear directional trend stems from conflicting fundamental forces: on one hand, sticky inflation and resilient U.S. data have bolstered the U.S. dollar and yields, weighing on gold. On the other, global growth concerns and geopolitical tensions continue to underpin demand for the metal as a safe haven. The push and pull of these opposing themes has created an environment of indecision and choppy price action.
While long-term investors may find this frustrating, range traders and mean reversion strategies are thriving. With technical boundaries so well-defined, short-term oscillations within the range are offering repeated opportunities for disciplined entry and exit.
Currently, XAUUSD is trading just under the 3296 level after a recent rejection from the 3350s. The bearish structure suggests a potential leg down toward the 3160–3180 support zone. However, absent any major economic surprises or geopolitical shocks, this could merely be another deviation from the mean rather than a true breakdown. Indicators like RSI and Stochastic Oscillator are already hinting at early signs of bullish divergence.
If price holds above or near 3160, the setup for another mean-reversion trade back toward the mid-range (around 3296 or higher) could unfold. In the current environment, fading extremes rather than chasing trends remains a strategy of edge, as depicted by the 14 period RSI.
UCAD Bulls Look for 3rd Test After Sept. '24 Highs TouchOANDA:USDCAD Bulls were able to find support at the Sept. 2024 Highs after having traveled down a Falling Support for the past 2 months!
Now we see Bulls pushing price higher creating a Rising Support with 2 tests having been successful and currently coming down for a 3rd test!
Now Price has already broken a Previous Level of Structure which was a Past Resistance on June 4th. This level also lands right at the 34 EMA and based on the Bollinger Bands, this test will also be a Mean Reversion where Price after having traveled in one direction will revert back to the mean of the Bollinger Bands for Continuation, which in this case will be Bullish!
After the 2nd Test of the Rising Support, we can see a Massive amount of Volume enters.
Price also is trading Above the 50 on the RSI and is currently coming down to test that level.
I am looking for Price to test the 1.3683 area and if Price shows support for a 3rd Test, this will be a great opportunity for Long Positions!
Fundamentally, USD will be bombarded heavy news being CPI numbers with analysts forecasting a .2% Increase in Inflation! Also PPI, Unemployment Claims and Prelim UoM Consumer Sentiment & Inflation Expectations.

EURGBP Analysis: Two Daily POIsHello traders!
EURGBP is offering two trading scenarios on the daily timeframe.
The first scenario suggests the pair may react bullishly from the next zone, setting up a bounce opportunity that could drive price higher toward the 0.84400 area.
The second scenario anticipates a bounce toward the 0.83800 area, where a mean reversion setup may come into play (if buyers step in and price action confirms bullish intent near that support).
Discretionary Trading: Where Experience Becomes the Edge
Discretionary trading is all about making decisions based on what you see, what you feel, and what you've learned through experience. Unlike systematic strategies that rely on fixed rules or algorithms, discretionary traders use their judgment to read the market in real time. It's a skill that can't be rushed, because it's built on screen time, pattern recognition, and the ability to stay calm under pressure.
There's no shortcut here. You need to see enough market conditions, wins, and losses to build that intuition—the kind that tells you when to pull the trigger or sit on your hands. Charts might look the same, but context changes everything, and that's something only experience can teach you.
At the end of the day, discretionary trading is an art, refined over time, sharpened through mistakes, and driven by instinct. It's not for everyone, but for those who've put in the work, it can be a powerful way to trade.
