Nasdaq Centerline Target at 24'220NQ has host everything what is called support.
My target is the 24120 at the Cetnerline.
On a complete flush, further lower targets would be the white Centerline around 23'500.
Time until it hit's the 24220?
I have no cristal bowl. But for each day it takes, I'll move the target even lower, attached to the Centerline.
Since I play this with Options, I don't have a hard Stop/Loss, just risking what my risk-management allowes me in my account.
!! Trade small - It could snap back anytime !!
Stay save
Emilio
Medianline

Microsoft - Struggling with a decision?OK, let me give you my 5 cents.
In this weekly chart analysis, the white up-sloping Pitchfork initially projected a sustained bullish journey for Microsoft. Early price action saw the stock blow through the Center Line (CL) before finding temporary resistance and turning at the upper 1/4 Line.
From that peak, the Centerline of the white fork became the primary downside target. Upon closer inspection, price action stalled briefly at this level before decisively breaking through to the downside. While bulls attempted to reclaim the CL, the sheer market pressure proved too great, there simply wasn't enough "Gas In The Goose" to maintain the upward trajectory.
Once price slipped below the white Centerline, it signaled the necessity of drawing a red Pullback Pitchfork to project targets for a potential short trade. Technical probability suggests an 80% chance of price reaching the Centerline of a new fork, a target we have now successfully hit.
The intensity of the sell-off was notable; the "bear crowd" took total control, driving MSFT lower than the Lower Median Line Parallel (L-MLH). This decline was exacerbated by the broader market immediate sell-off in the S&P 500 and Nasdaq, leaving Microsoft vulnerable to systemic macro pressure.
Current Outlook & Price Targets
Immediate Resistance: If we close the week below the lower white MLH, I expect a short-term relief rally or "pull-back" to retest that line from below.
Downside Support: A failure to reclaim that level points toward the second white-dashed Warning Line of the original Pitchfork.
The "Dip-Buy" Caution: Traders should note that the Warning Line is not a guaranteed floor. There is a secondary, lower target at the red Lower Median Line Parallel (L-MLH).
Currently, the technical structure suggests significant downside potential remains. I will continue to monitor these levels closely. Members will receive updates as soon as a high-probability trade opportunity emerges.
If you like this post, then follow and boost my analysis - thanks very much.
Wishing you a happy day
Emilio
- Control risk with proper position sizing, not hope or guesswork.
- If you want the fundamentals too, just check out my links

A Nasdaq Scalp With 2 Opposing ForcesWhat I'm looking for is a simple daily Bread & Butter Trade.
My RealSwings show me the Trend. The Orange Fork is projecting it to the downside too.
Notice the touches at the orange Center-Line.
Price respects the Pitchfork.
I'm stalking a long Trend.
It's a counter Trend trade and I know that probabilities are somewhat lower than I could trade with the direction of the Trend.
Here's the 5min. where I enter the trade:
My target is the Pullback of the white Centerline, which gives me a good Risk/Reward Ratio.
Let's see if we get stopped-in to the Trade.

Gold Short Trade - IntradayThis intraday trade should be quick and short, as soon as Bulls starts to give up.
1. Price reached the orange CL
2. Price left the L-MLH
3. Pullback to L-MLH expected and fullfilled.
4. Price weakens after Test/Retest of L-MLH
Short with no doubt, just following the rules.
Subscribe for my Newsletter §8-)

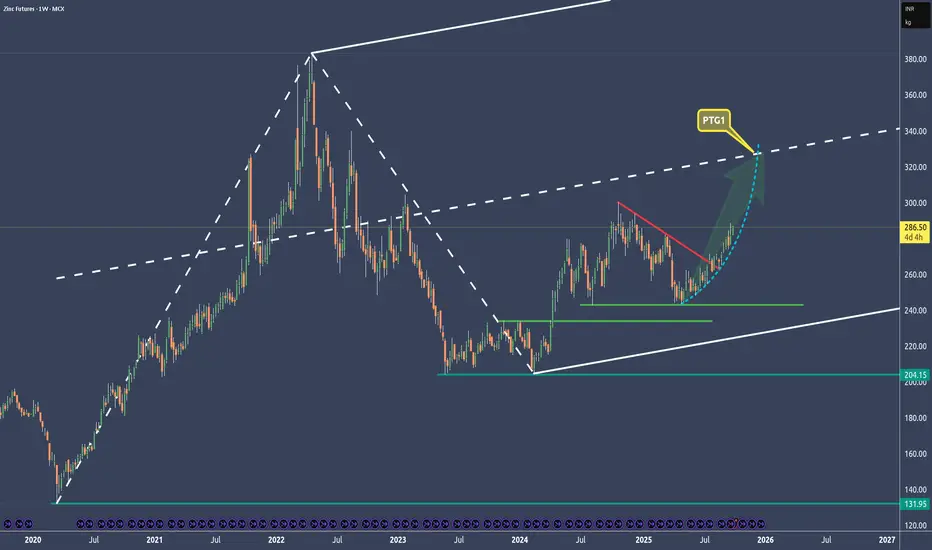
Zinc - Exponential Move To Profit Along With Copper🔱 I posted about copper and zinc on Sep 17. 🔱
Both are closely correlated, and now zinc is moving exponentially.
The target is at the centerline of course with around an 80% probability.
👉 If you think that these forks are doing a good job, then throw me booster please and check out my links. §8-)
Si1! - A "Short" Silver Heads-UpWhat we see on these two charts are two different Andrews Pitchforks.
- same time window
- different time period
- different pitchfork placement
The left chart maps the pendulum swings.
The right chart maps the real swings.
LEFT CHART
The market has almost reached the maximum stretch point, arriving at the U-MLH. A reversal toward the centerline is very likely, as the market tends to seek balance after such an extreme stretch. Classic mean reversion.
RIGHT CHART
Here we see that silver has reached the centerline - the classic 80% target for a pitchfork trader. From here, the market can break/zoom through the centerline, retest it, and continue upward. In the LEFT chart, this would correspond to a larger stretch toward Warning Line 1. Or the market may turn at the centerline because it has found its balance, which in the LEFT chart would confirm the stretch-and-turn scenario.
Either way, caution is warranted. I would at least take partial profits (50% is always good) and treat myself to an enjoyable Christmas party!
Anyone who would like to learn more about pitchforks, please read my bio here on TradingView.
Happy profits to you Silver Arrows §8-)

XHB – A continuing long-term short with further downside potentiIn my analysis it is unquestionable that the housing market is weakening further, and a significant mid-term decline is inevitable.
My godchild is currently spending a few months in the United States, preparing for an English degree. What she tells me about the housing situation and grocery prices is even more alarming than I expected.
I have already taken some short positions during the decline since September and closed part of them. Now I see further downside potential, so I have added long-dated put options, some in-the-money for longer setups and some out-of-the-money for shorter-term moves.
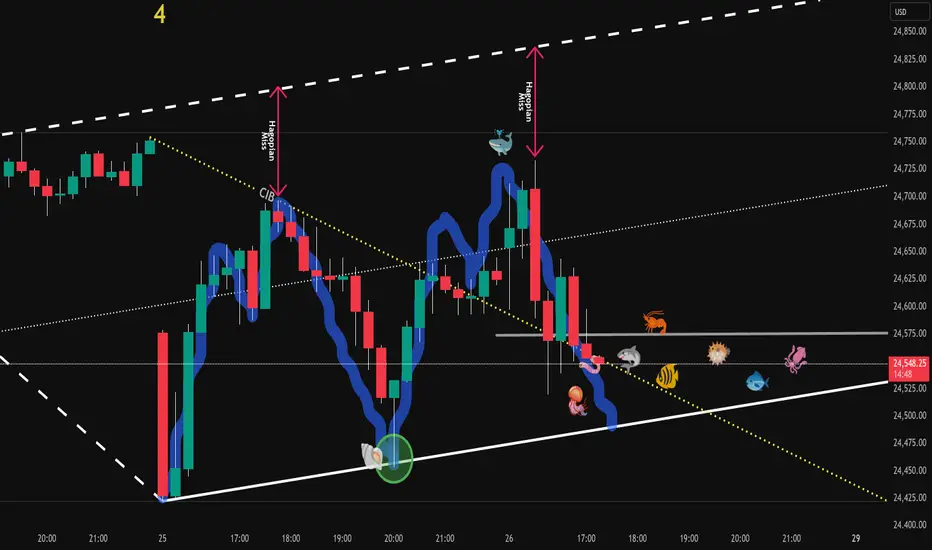
On the chart, we can see that price has breached the CIB line (yellow) and continued downward. At the U-MLH, we are again seeing signs of weakness - a favorable setup for action.
By the time my godchild returns from the U.S. in May 2026, I’m confident I will be able to treat her to steak and lobster, courtesy of this trade.
If not, well - my Carbonara Speciale is also a fine way to soothe the sting of a stop-loss.
Take care out there.

Nasdaq nearing critical balanceIn November, we observed a Hagopian pattern - the market failed to reach the centerline despite the high probability of doing so (see weekly chart left). MACD-V is in divergence since then. A sign to be especially cautious.
This led to the current rally lasting more than ten days without a single close below a prior low. It seems the Plunge Protection Team may be at work.
In any case, we are now approaching the yellow centerline, the market’s point of balance. From there, the market will determine whether we push once more above the yellow centerline toward the white U-MLH, or turn downward, producing a second Hagopian and falling back toward the white centerline.
If the second scenario unfolds, the path toward significantly lower prices would be wide open.
Let’s see what we get for Christmas…

CVNA - Let's do it againA short squeeze to the upside, right up to the center line. This is exactly where I like price to be.
For one, it’s the 80% target; and secondly, price has to make a decision at this equilibrium level.
If I see any weakness below the center line, I’ll hit it on the head again. §8-)
🔱 Happy trading, folks. 🔱

If Nasdaq can crack the pressure line then...🔱 We have a Hagopian on the down-move. 🔱
Price was (so far) not able to reach the L-MLH of the red fork.
If buyers can eat through the pressure cheese, then the Long-Play is on.
Most often we see price breaking the pressure line and then coming back to it, scaring out the early longs, just to rush upwards again. So don’t panic if this happens. Place a proper stop and you're good.
As for targets, there is the red Centerline and the white Centerline.
On a break of the red CL, we have a high chance to see the same scenario as with the pressure line: UP-Down-MoreUp.
First snow in Switzerland arrived and Santa is preparing the reindeer to bring us some dough ;-)
Wish you all a profitable Friday.

S&P500/ES Intraday Trade Idea VideoThoday I see a potential trade setting up in the S&P500 Futures.
My overall thesis is to the upside, so no Shorts today. Unless we come up to the first resistance level, or even beter, the 1/4 line. From there I'll be willing to risk some of my money.
Long option 2:
From the CIB or Centerline, after a pullback to these lower levels.
Happy Monday all §8-)

KRBN - Clear resistance for a potential short🔱 The multiple struggle at the Centerline gives us a hint for a potential short. 🔱
The thin slanted support needs to be broken and only then can we consider a move to the downside.
The L-MLH is my first PTG and the red Centerline my second.
Wish you all a happy new week and don't forget to watch my 👉 Weekly Trading Watchlist.

Bitcoin Hodlers are happy campers - BUT🕷️ 🌕 🦇 In Switzerland it’s now 11:50 PM 🕷️ 🌕 🦇
I’m tired from a long day in the markets, but I feel I have to get this one out because it’s important for many of you holding Bitcoin.
In my last post, I said we’d run upward to reach the Hagopian Line, and here we are, even higher.
We’ve just tagged the U-MLH for the third time.
There’s an old pattern from the futures markets that farmers once noticed. It’s called the “Three Drives” pattern.
The old farmers knew that when this pattern appeared, it was time to hedge their crops, or add to their hedge.
When I was a student at MarketGeometry, Tim Morge explained this pattern, and ever since it’s served me well as a signal for a trend reversal.
I don’t know exactly how this will help each of you, but I’m sure it’s worth a heads-up. Whether you decide to hedge, close your positions, or just HODL until the sun burns out, it’s something to keep in mind.
Meanwhile, the Harvest Moon is shining into my office tonight, twinkling with a strange grin... 🌕
Time for me to rest.
Good night, everyone.
🌾 🌾 🌾 🌾 🌾 🌾 🌾

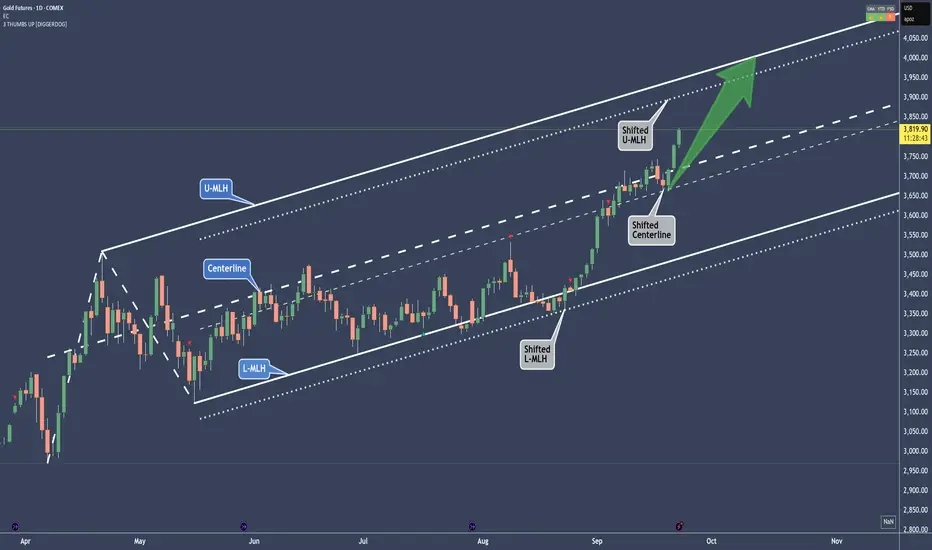
Gold - A shifted move in play and up to 4K🔱 Here’s a shifted move in play 🔱
What exactly is a shifted move?
You see the parallel lines next to the white fork?
Those are the shifted lines.
Now, if you observe how price behaved at the white fork, you’ll notice it was a bit sloppy at the L-MLH, and again at the Centerline after reaching it.
But when we add the dotted parallel lines to the chart and measure the distance from the overshoot at the L-MLH, we find a beautiful support at the Shifted Centerline.
The usual target would be the U-MLH.
So, could the target also be shifted?
And what does that tell us?
Well, if you’re long on Gold, you might want to take some profit at the Shifted U-MLH and let the rest ride up toward 4K—if there’s enough gas in the goose.
For me, a re-entry long would be a pullback to the Centerline—either the original or the shifted one—with a small stop just below some structure.
Let me know what you think ho far Gold will go in the comments.
😊 Thanks for boosting, thanks for following 🙏
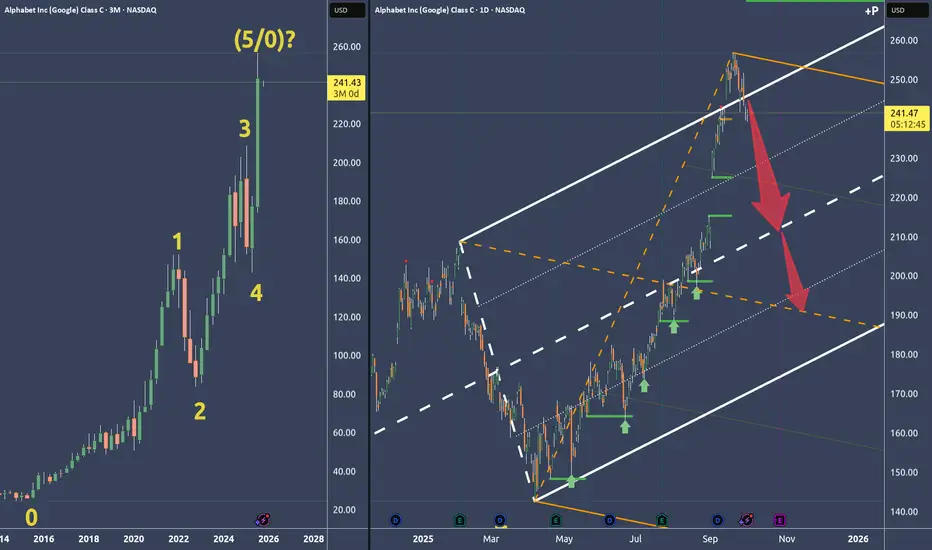
Google Alphabet: Why I think it's time to short🔱 Simple decision because of the Fork framework 🔱
Left Chart:
Zero-to-five count with a potential P5 and a turn.
Why P5?...
Right Chart:
...because price broke out of the U-MLH, then fell back into the fork. As a filter I like it when price is opening and closing inside the fork again. All in all it's a new and weak behaviour.
Or in short: That’s a pretty darn strong short signal to me.
Following the rules, taking acceptable risks, and hunting a fat profit.
👉 PTG1: The white centerline
👉 PTG2: The orange centerline
🛷 Happy Sleigh Ride 🎄
NQ is twitching the worm - Don't take the bait🎣 Don’t take the bait! 🎣
Just sitting here, watching my pre-market setup.
Now I can see them twitching the worm, trying to lure me in.
NOPE!
This price action’s way too twitchy for me. §8-)
This Chart is a RTH with "Gap-Attached" and gives a perfect catch of the first drop.
So, just casually watching...maybe I can learn even more...
🐟🐠🐡🐟🐠🐡🐟🐠🐡🐟🐠🐡🐟🐠🐡🐟🐠🐡🐟🐠🐡
MSTR - Here comes #5 at the CenterlineRemember when I said, I do it again Sam?
Nothing changed. Only the price in the consolidation at P4.
This will temporarily end at P5 (Yellow Count), where I'll take my profit. With a little pressure, price will even make it to the L-MLH.
Then I'll relax and watch, how the Chickens run around and create new opportunity. 🐔🐓
Don't be a Chicken, be the 🦊 Fox 🦊, be clever and have patience.
Happy new week all §8-)

BTCUSD - Nothing broken - so farUp where the 0 (zero) is, at the white Centerline, BTC was trying to re-test it, when it came from the white 1/4 line. So a larger Hagopian kicked in, projecting price to go further down than from where it originally came.
Price did what was projected by the Hagopian and cracked the low of 111'920.
Then from Point 1, Bitcoin made it up to the red U-MLH.
It was just natural resistance up there.
Now we see a pullback to the south, which I had not expected last week.
Even if we stop in the buyers zone, chances that BTC is trading down to the Centerline are around 80%.
And down there we will find out if the white L-MLH will hold or not.
If not, then we are in a 0 to 5 count to the south and we will see much lower prices.
But as long as price can stay within the white Fork, we are still projecting it's most probable path to the upside in the long term timeframe.
Happy new week and stay tuned for the news §8-)

XHB - Housing Is In Real Trouble - My Short explained🏠 Some Facts & Fundamentals first 🏠
The Fed has made its first rate cut in 2025, and more are expected if inflation remains under control. That could put downward pressure on long-term mortgage rates, which may give the market a little boost.
Builders (like Lennar) are 🏚️ facing profit pressure 🏚️ due to affordability and are offering incentives (rate buydowns, other discounts) to spur demand.
📈 Now to the technicals 📉
Price went up to the Centerline. The 80% rule played out like textbook.
Then it closed above the Centerline, and failed to move further up to the U-MLH, which is a loud 🚨 warning sign 🚨.
And finally, we have a confirmed "Hagopian", when we close below the Centerline this Week.
To me it's all perfect in line - I mean, the TA & Fundamentals.
My plan is, to play XHB short with LEAP Options (182 Days) and take profit on the way down, which is at the Centerline, 1/4 Line and the L-MLH.
Of cours I would bail out or hedge, if price open & close again above the Centerline on the weekly time frame Chart.
⚠️ Stay updated ⚠️
I will start something new in one or two weeks, so you better don't miss it and follow! §8-)
❤️ THANK YOU ALL ❤️
...for the Boosts and Follow from this week. Your feedback is what makes it worth to post!
I wish you all a relaxing and happy weekend §8-)

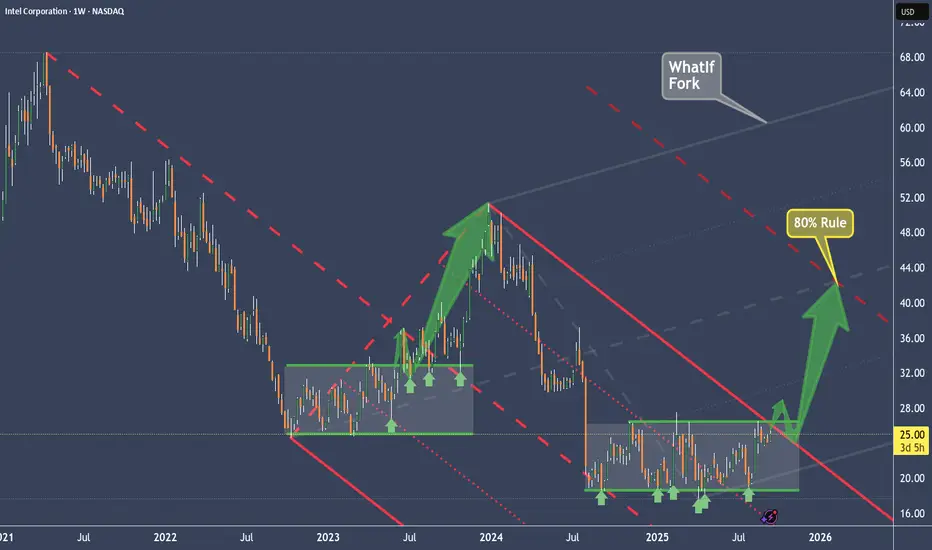
Intel (INTC) silent accumulation pattern and projection of priceThe last time INTC broke out of its sideways range, it re-tested support three times.
After that, price surged upward, pulled back to the Centerline (an 80% probability move), and then began accumulating again within a sideways coil — or “Battery,” as I like to call it (see the TSLA example).
This setup looks similar now.
In fact, we even have a stronger filter: Price must first break out of the downsloping red Fork. Once that happens, we can expect a re-test of the upper median line (U-MLH). That’s the point where I decide whether or not to take a position.
My target is the Centerline of the grey “What If Fork.”
I want to emphasize that the inventor of the Forks highlighted this idea in his original course: always project and think, “What if…?” That’s exactly what I do — and maybe it will help you as well.
Let’s see if Intel’s “Battery” gives us a solid trade. §8-)
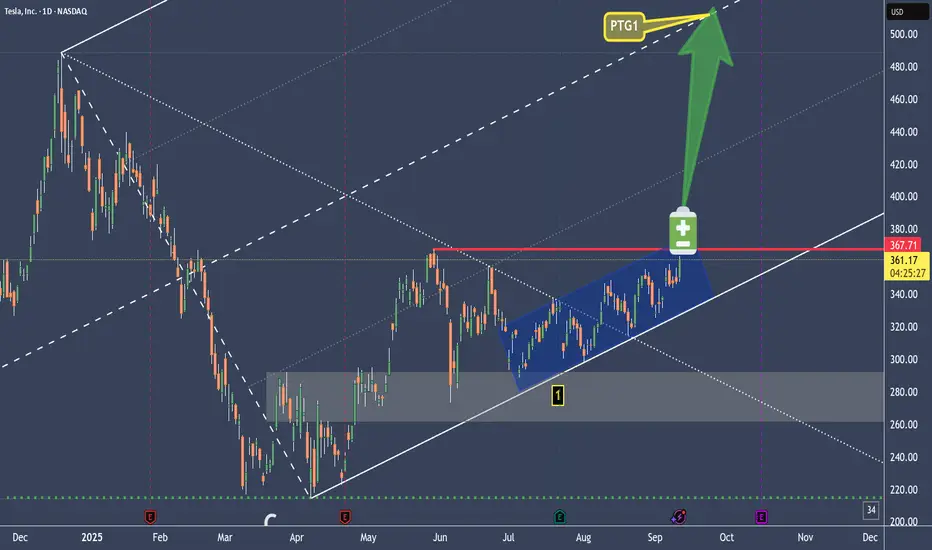
TSLA Battery Is still loading - May the Energy be with you.We see the slanted coil.
It act's like a Battery loading energy.
At one time it will expend it's energy, either up, or down.
Forks show the most probable path of price.
Forks provide a framework, where a Trader doesn't have to guess. Just trade the rule-book and follow your one plan.
Either we get stopped or we are happy Teslonians.
May the Energy be with you §8-)
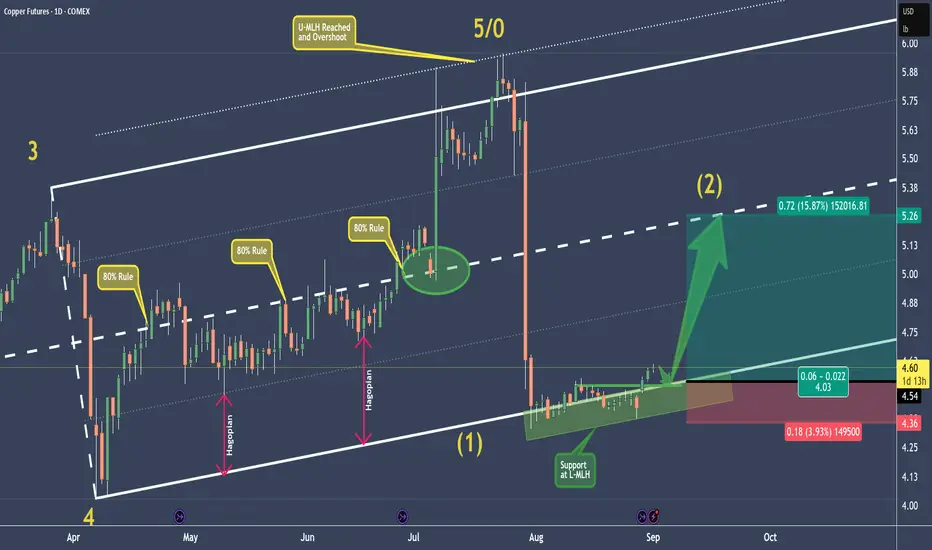
HG - Copper Setting Up For A Long Opprtunity At Extreme📊 Fundamentals first:
- Short-term: The copper market is turbulent—marked by sharp price spikes, crashes, and global shifts in stock levels.
- Medium-term: Despite forecasted surpluses from ICSG, technology innovations and steady demand (especially from China and green sectors) may underpin prices.
- U.S. risk factor: The tariffs remain a major wildcard, likely restructuring trade flows, increasing domestic input costs, and distorting global price differentials.
📈 Now the Chart:
P5/0 at the U-MLH marked the end, and price dropped into the void.
Now, at the L-MLH we see support has built up.
The momentum we see now will probably lead in a pullback before the potential massive run-up to the Centerline.
💡 If the trading God gives me a pullback, I am willingly risk my 0.5% in this trade to make at least 4x more. 🦊
Happy new week to all §8-)
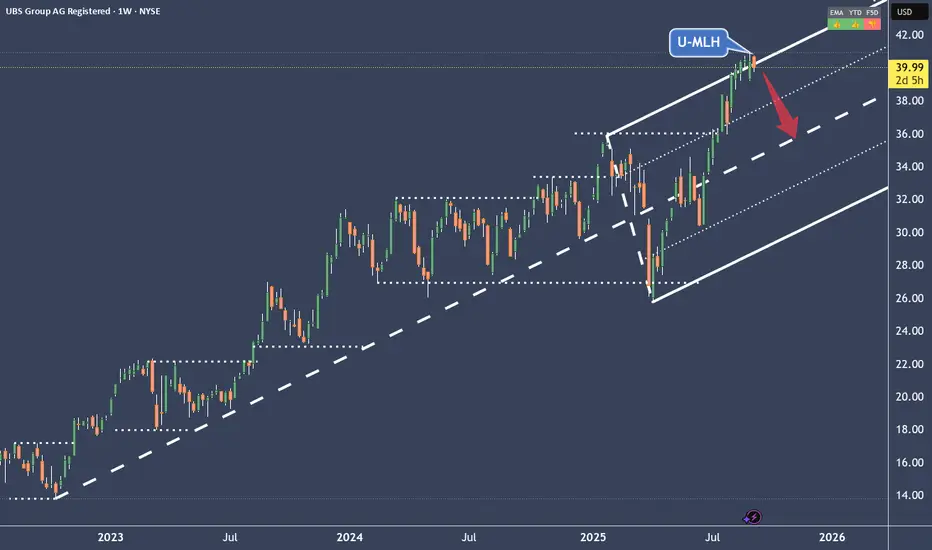
UBS Swiss Bank ran too hot for my likingBut I like it!
It's a fair short opportunity IMO.
Also, the setup is playing out very nice.
It opened & closed back into the Fork on the daily.
I approach it the same way like the Google short, with ITM Options (see link).
Target is the Centerline with an 80% chance of success.