Medium

GBPCAD - potential long in the making to collect +/-150 pips The fundamentals on the GBP provides a lot of potential upside momentum for the GBPCAD today.
1st there is the GBP manufacturing PMI, then the official bank rate votes and lastly BOE Governer Carney will be speaking.
The technical's indicate that price on the 4hr chart made a lower low and bounced of a support area formed a few weeks ago.
The latest political scene (Brexit) developments also provide good reason for the GBP to further strengthen.
Long Position
Entry levels indicated on the chart should be considered
Take profit levels should be build on a potential +/- 150 pip move
Remember anything can happen

BTC Medium-term: Sunny, but you never know, so bring a coat.In my first published idea here (mid-September), I suggested that BTC seemed poised to fall and re-test the bottom of a long-forming descending wedge.
Well, it did fall, but not quite to the bottom of the wedge. For the first time in a long while, we started forming higher lows. This trend has continued, and we now find ourselves in a very nice looking ascending wedge (drawn here in light green) -- still *within* a descending wedge (drawn in purple), but with solid support at around $6200 USD, and nicely shaping up to look a lot like a possible breakout/trend reversal.
For the first time within this downtrend, the 200 MA -- which has acted as a solid resistance over the past few months, rejecting several rallies at or near its mark -- is *above* this descending wedge (as I've drawn it, here), instead of right on top of it, or cutting thru it.
On the RSI side, we have a nice, long-forming ascending wedge (blue lines on RSI chart) -- a strengthening market.
But, on the shorter term, we have a *possible* RSI downtrend forming (red line on RSI chart). We'll soon see how that shakes out.
If we break up out of this wedge -- which seems likely in a few days, that's hugely positive. I'd imagine we'll test that 200 MA again, but this time, it's sitting higher, so if we break up, the next target is around $7250. We might see a small rejection at that point, but if this bullish momentum sustains, I think we have a good chance of bouncing right back to test -- and break -- it for good.
Bearish scenario, we fall to the bottom of this ascending wedge, test it, fail, and fall down to our next support at around $5880 USD.
Feeling pretty bullish right now, though.

GBPCAD longterm shortthe daily sellers have taken over, the 4H on the other hand had to retrace, however I expect it to exhaust some of its energy before I enter. This is a long term trend.

The price go into descending channel. Wait for Shot!The price go into descending channel.
Wait for Shot!
Remember:
+Always use stoploss
+Next 2 hours, USD have strong news.

S&P 500 bearish for a few days?This is a great opportunity with 1:4 risk to reward ratio to short this market with a fair amount of reasons (indicated on the chart). A classic mistake is trading countertrend hence this could follow the parabola and shoot to new highs fairly easily.
This is just an idea, not advice! Good luck in trading the tough markets everyone!!

EURGBP h4 SHORTEG head and shoulder H4, this is a really choppy pair in its nature, hardly any definitive directional trend.
Price met resistance at what may be the formation of the 2nd shoulder at the same height as that of the first.
It is not a high probability setup, but may prove to be meaningful, as price moving to the upside after having broken the descending weekly channel. So a move to the downside to retest previous significant supports may be in play.
I will go light on it.

BRENT C. OIL SHORT H4/DAILYBrent crude oil
Double top resistance setup on daily followed by medium to long term uptrend break and currently retesting.
Sell towards retest of the support level below at TP1, chances of it reaching below $60 per barrel is unlikely but possible.

GU SHORT H4/DAILYGU expected to maintain bearish bias on medium to long term, price has been respecting the inflow of supply near minor resistance levels channeling price to major weekly support level below the 1.30000 level.
If bulls take charge which is unlikely with current strength of the US economy and woos of trade wars with China, if price finds ground above the previous h4 fake out downtrend break - the minor highlighted zone, we could see price surge back to 1.36000 to retest the level of the start of accelerated descend.
Interesting observation : On daily price seems to be retesting an inner major downtrend break, price has swiftly been moving along on the out side of the broken downtrend , a break of the daily downtrend along with strong economic drivers against the US, GU may regain bulls in the months to come.


Market Heating Up? 28,64% Profit #BTC Could hit final target? Is market heating up?
A while ago I posted a chart:
Because, the Moving Water Technical Analysis was showing that BTC was about to take off, and a big wave was forming.
I advised all my followers and haters that pro surfers can see the big waves way before it happens, and that is one of their main advantages.
Here is the same thing, because when you see the wave it is already too late.
Who bought BTC at $ 5,800, and I did post 2 times for this opportunity. Above is the chart with the second opportunity. Below is the chart with the first opportunity:
So, now some followers are already with 28,64% profit on BTC, riding what we call on surfing: "The Tube", or the best part of the wave.
But to get here, you had to believe in the wave, because before that it was not possible to see it.
Many followers are now thanking me. I am really happy to help.
Our Final target is $ 8,500 and is not very far now. Moving Water prediction, did spot a time frame, and that would be medium term from the chart that spots it. So, probably from July 30 to August 2nd, we should see our target.
What do you believe. Is it possible?
I hope the best to all.
Good Luck and Good Profit.


USDCAD Short Trade SetupHello traders.
USDCAD went up and broke the previous top. Now, it looks like we have a completed 3 wave structure. I have placed an entry order to the confluence level of 0.886 retracement and 1.118 extension and the trendline. As you can see it's still in the downtrend and my forecast will remain down as long as it doesn't break the trendline. My minimum target for any short trade is the breaking the previous bottom.

Can we hit 1.21? EUR/USD longThis is a good 1 to 2 risk/reward ratio trade that could work if the current strong bearish momentum starts dying off.
This is just an idea everyone! Good luck!!

DXY Dollar Index Medium Term Target 92.40 now ReachededDXY Dollar Index Done for Now
The dollar has finally reached the exact medium term target
at the 94.20 level and has since started to retreat. As so often
repeated here, DXY is still the best confirming signal we have
across most dollar pairs. At this point all dollar pair longs
should have been closed out.
DXY should now enter a period of consolidation which should
take it back to the 93.36-93.12 range.
It must then hold at 93.12 to avoid further weakness back to
the 92.55-92.25 range.
Returning to the upside, DXY has to break above 94.20 to
trigger any further near term dollar strength up to 95.15.

XPTUSD Long Trade SetupHello traders
Platinum has a great potential for upside but in the meantime, there is still chance for more down move. If the structure between the yellow lines is a contracting flat the structure between green lines should be the correction after reversal impulse and it should go up. If the structure between orange lines is a running flat, it will keep going down. But even in this scenario, I'm expecting some correction. That's why I have placed an entry order. My plan is to take the trade move stop-loss to break even and see the potential. If it breaks the previous bottom, I will move the entry price and stop-loss accordingly.
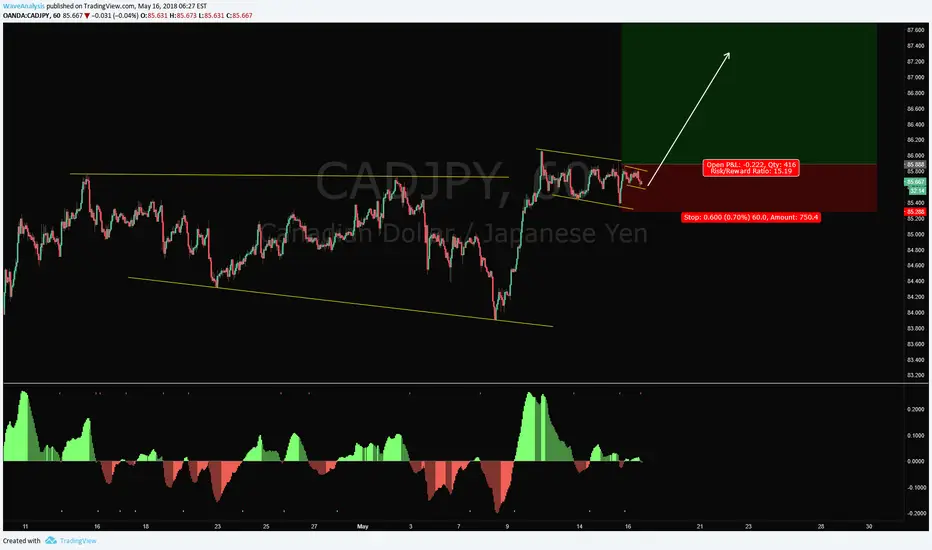
CADJPY Long Trade SetupHello traders.
This is very clear long trade setup. It made a 4H corrective structure. Then 1H correction after the breakout, and now 15m correction is in the making. That's why I placed an entry order. But there is a problem here. Our entry is far away from the bottom. If it goes up fast like the previous up impulse, perfect I will be in the trade. Otherwise, it will probably make a deeper correction after some up moves. Because of this possibility, the stop-loss should be moved to breakeven as quickly as possible.
AUDJPY Long TradeHello traders.
It is not so clear in higher timeframes but the structure in 1H looks like very bullish. I hope it will come down one more time. It will give us a better correction. But now I'm waiting for a small flag in 15m to take a long trade. The target is not clear. It can be huge, we will see.

XPDUSD Short Trade SetupHello traders.
I think down move is either a weekly correction or daily correction or impulse. In any case, there is a big potential for more downside. That's why I'm looking for short trade setups. I have an entry order because the structure looks like a correction so far. In the meantime, I'm waiting for the breakout and a correction to take a short trade. If I can take any, I will remove the entry order. Target is not clear, leave it empty.

GER30 Short Trade SetupHello traders.
DAX has some big potential for downside. As I can see the correction is an expanding flat in 1D timeframe. It can still keep going up because we don't have any divergence in 1H in up impulse. But, when it completes the C wave, it will go down. Of course, there are some other options, so down move can be a correction instead of an impulse. The idea here is to take the trade, move the stop-loss, and let it show its potential.

EURGBP Long Trade SetupHello traders.
First of all, sorry for late publishing this idea. But, it went up while I was working on today's analysis video. Please wait for a correction to take any long trade. I took it because the structure between blue lines can be a running flat and if the previous bottom is the and of daily corrective structure, the target of up move will be breaking the blue line. It can still keep going down to the yellow line.

ETHUSD Short and Medium Term Outlook ETHUSD
As ETH continues to consolidate it's started to form a new pair
of parallels at a less acute angle but it's holding up and
making higher intermediate highs as it does so.
The medium term trend remains positive whilst it continues to
hold up off the lower parallel on all retests (the recent low
was off the previous rally high)
But in the near term it's struggling under the 765 line after a
high at 768.
Without Bitcoin to give it a boost it can move sideways to
down for awhile inside the two blue lines on the chart and
towards the lower parallel given enough time.
But so long as it continues to hold the medium term trend
remains positive.
ETH nevertheless remains tied to Bitcoin's boot-straps.
In the nearer term Bitcoin needs to break above 9400
to help ETH power higher through 768.
And on downside Bitcoin has to break below 9300 to send
ETHlower towards the 741 line and another meeting with
the parallel.

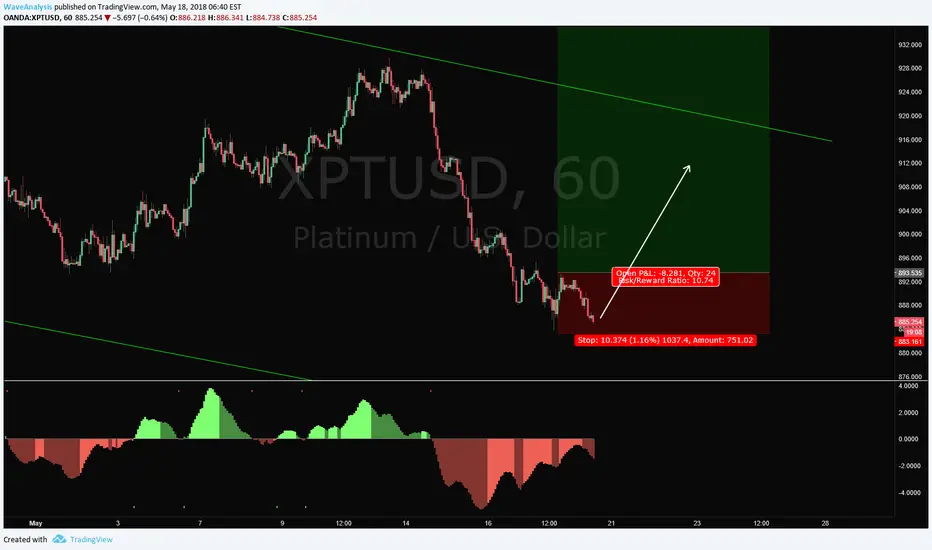
XPTUSD Long Trade SetupHello, traders.
I'm expecting very nice up move in platinum. You can see my higher degree expectation in the followed chart, but it is almost impossible to explain by drawing because there are a lot of options. So, if you want to see detailed analysis, please watch today's analysis video on Youtube.
The last down move has 5 waves already and the 5th wave looks like a reversal pattern. That's why I have put an entry order as you can see. The stop-loss is not certain. If the price goes deeper levels I will rearrange the entry price, stop-loss and lot size according to new bottoms.
