$SAP #SAP ... all hands on deck! Support area is 89 -79 USDHi and welcome to my analysis on SAP (NYSE, USD).
Yes, we had some news from the software provider that attracted sellers. Trading in Germany on XETRA is closed and no prisoners were taken...
In my first chart you can see a broadening top in the stock. SAP was not able to activate this formation to the upside in September...the upper trendline produced heavy resistance and forced a minor reversal...
In combination with a bearish engulfing pattern as per end of September...
...and last week's break below the KAMA21 the stage was set for a downturn...
The lower megaphone supportline is at 89 USD...this is a target if the bears remain in control.
POC (2016 to date) is showing the point of control around 79 USD.
Would be nice if you support me with a thumbs up and follow me...
Best,
Tom Jansen
Chief Investor-Guard
© Copyright TA Investor-Guard 2020. Charts powered by TradingView. All rights reserved.
The information provided here is of a general nature and not legal, tax or investment advice.
Megaphone

WKHS- The Strat- MegaphoneLooks like a 2-2 reversal on the daily. Looking for the move up to the top of the megaphone next week


AMD- The Strat- MegaPhone ideaLove how you can go back in Tradingview and review your ideas to see how they worked out.
Lets see how this one goes. Inside week for AMD. I'm thinking NEXT week we may break THIS week's high and continue up to the top of the "megaphone."

LendingTree: Bullish Technicals and Fundamentals ExplainedIn this analysis, I'll be providing an in-depth analysis on LendingTree, as well as an explanation on megaphone patterns and its bullish upside.
What is LendingTree Inc.?
Lendingtree (TREE) is a company that offers a platform for borrowers and multiple lenders, offering the opportunity for its users to find the best possible deal on their loans.
Business Model
- Users of TREE gain access to multiple loan offers, and TREE’s clients gain the benefit of a cost-efficient customer acquisition.
- Essentially, LendingTree is a platform where people shop for money.
- Lendingtree works with major banks such as Citibank, Wells Fargo, as well as mortgage brokers, p2p specialty finance institutions, and small businesses.
- Their clients’ pain point is that borrower acquisition is a key constraint to growth.
- They offer a personalized platform called My LendingTree in which users can track their financial credit and performance
- Their cumulative user growth has been increasing at an exponential rate
- One fact many people misunderstand is that LendingTree does not take a markup fee.
- Their revenue comes from the payments made by lenders (their institutional clients), who pay to join the LendingTree marketplace.
- TREE also gets paid by their clients when its users sign up for their loans or services.
- While mortgage loans are their main focus, they are expanding into areas of: personal loans, auto loans, business loans, student loans, credit cards, saving accounts, and home equity loans.
Financials
- LendingTree’s revenue has tripled to $1.1 Billion by the end of 2019, almost triple the revenue of 2016.
- They continue to demonstrate tremendous growth as consumers shop for mortgages over time
- While their revenue was dominantly mortgage based, they have managed to diversify into generating revenue from non-mortgage related loans and services.
- However, their operating expenses have also significantly increased due to huge marketing budgets, and their operating income is not as exponential as their revenue growth
- Their quarterly revenue changes have been showing inconsistencies, and reported negative earnings for 2020 Q2.
- However, the company demonstrates steady and strong free cash flow
Technical Analysis
- We can take a look at TREE’s weekly chart for long term insight
- To begin with, the chart is currently trading within a textbook megaphone pattern
- A megaphone pattern can be a continuation or reversal pattern depending on how prices react near the resistance
- This pattern demonstrates 5 distinct swings, each getting larger than the previous one,
- As demonstrated above, we are currently in the middle of the fifth swing
- We can see that a reverse head and shoulders pattern has been forming since the third swing.
- We have temporarily broken out of the descending trend line resistance (marked by the dotted blue line), and forming what seems to be the right shoulder
- The formation of the right shoulder can also be seen as a bullish flag pattern, where prices are consolidating before a breakout
- On the short term, we are consolidating below the 0.618 Fibonacci retracement resistance.
- We have tested the pivot line support, as prices look to break out
- Even if we see a rejection at the trend line resistance on the fifth swing, there is a 60% upside potential based on the megaphone pattern structure
Conclusion
With the Fed having said that interest rates will remain at near zero, and considering the fact that the US housing market is still in an uptrend, given that we see more recovery in the economy, we could anticipate huge growth for LendingTree as more users seek to get loans. The technicals demonstrated on LendingTree’s chart are also extremely bullish, making this stock a solid mid-term investment.
If you like this analysis, please make sure to like the post, and follow for more quality content!
I would also appreciate it if you could leave a comment below with some original insight.

ZM hits roofIn this chart we see a short term, broadening pattern called the megaphone. I have found that this pattern is usually accurate in predicting breakouts/ price movements. As shown in this hourly chart, ZM has been run along the top trend line , briefly crossed above, and is now headed back to support.
If I were looking for a short term trade I would wait to see if the price is going to break the black line (today’s low and also a price level that saw some price support recently), at the 457 area. If it breaks below, I would take out a short term call with my first target being the second-from-the-bottom black line, the 449 area, and the next is in the 442 area. If i believed I had a high tolerance for unrealized losses, I would set a stop loss far below my buying price (up to 40 percent of buying price for options.) on the other hand, if I had a very small tolerance or unrealized losses, I would set my stop loss at about 5 percent below my buying price, enough to maybe see a profit but not enough to where a short term sell off would force me to sell prematurely.
Feel free to leave comments and questions.

Sand Pop: Don't get Excited Yet!Megaphone in Bearish pattern; likely retest bottom TL in the expanding wedge; need consolidation before real breakout IMO
Not investing advice; trade at your own risk!

S&P-500 - is megaphone indeed playing out? TVC:SPX went below February highs and broke down key support levels.
If megaphone is indeed playing out, we are just at the very beginning of the move down.
"Buying the dip" might lead to some very negative surprises at the moment, so extra caution is required.

PINS- Megaphone pattern ideaAn idea for next week.
Although time continuity to the up side the general market is iffy right now.

Bulls have control (AAPL)If I have a choice between giving good and ehh news first, I always pick the good news: the good news is that the stock just broke two long term resistance lines(RLs). The ehh news is that up ahead, AAPL could see increased volatility as it is now trading in a megaphone pattern. The RSI indicates much of the same; a breakout leading to a broadening megaphone pattern. However, I remain firmly bullish, but because if AAPL broke past the third RL it would have been too good to be true. Look for AAPL to bounce off last week’s support line, and it should retest the third long term RL. To accurately predict when another breakout will happen, look for contracted volume/ volume cluster (which I have circled for Last week’s breakout), and watch the RSI as well. However, in the case we see another steep drop off in price and RSI, I would keep a neutral outlook. Feel free to comment with stocks for me to do chart analysis on!

S&P is at the top of the megaphonethere is three possible scenarios :
-first one it fall until it reach the major first support and rebound on it to retest the high of the megaphone (70% probability)
-second one it fall and break the major support (last ATH)and keep falling until reaching the down trendline of the megaphone (20% probability)
-third one it breaks up the megaphone and keep rising until reaching an undetermined level (10% probability)
make your bet. personally ill wait until it reach the major support and see the price reaction before taking the decision to short or to buy

AUDCHF wait for the break of range (Weekly/Daily) 🦐On the weekly chart AUDCHF has been inside a megaphone pattern which normally is a continuation pattern.
Market hit the lower trendline before starting to rise up.
We can clearly see that the market is moving inside a range between the 2 weekly structures.
If the market will break below the structure, as we expect, we can look for a short position according with our strategy.
IF the market will break above the upper structure, we can foreseen a test of the upper megaphone trendline, so we will be ready for a long position.
–––––
Follow the Shrimp 🦐
Here is the Plancton0618 technical analysis, please comment below if you have any question.
The ENTRY in the market will be taken only if the condition of Plancton0618 strategy will trigger.

Megaphone inside a MegaphoneTF: 15 min
double trouble megaphone on the 15 min. Looking for a bit more upside.

$HD megaphone top with RSI divergence$SPY $AAPL $SPX $QQQ $HD Picked up some September EXP puts on $HD because of this Megaphone top + RSI divergence.

ETH fractaling inside huge MEGAPHONE. Indicators signaling DOWN.1. bearish RSI div
2. bearish MACD div
3. longer trendline resistance (broken with possible fake out. other trendline is not yet broken, and is forming a megaphone pattern)
4. megaphone pattern (usually a bearish pattern but could brake out either way. Expect very volatile price action very soon)
5. megaphone fractal within a huge megaphone (it should be interesting to follow the price. If smaller one resolve bearish, it could drag a bigger one very fast very low, and vice versa)
6. fib retracement of .618 & .786 which is usually a location for a trend continuation
7. long term downtrend - series of lower highs and lower lows. (even if ETH broke out of the trendline and created a small w pattern, which is known as a double bottom, on a bigger scale, it hasn't formed yet on a higher time frames)
So if I have to bet, I would bet down, as long as the long term bear trend resolve itself, but for now, location is very good for bears. I expect them to show up very soon, but if they don't show up, bulls won't hesitate a second to take over.

UPDATE!! SHORT NZDJPY inside a megaphone range 🦐After our last call on this pair the market hit exactly where we expected and went back down.
Now the market could give us another opportunity to enter.
IF the market will manage to break the structure in blue and close the 4h candle below it we can look for a nice short order according to our strategy.
For the one that already are in since our last call you go risk free on the trade.
–––––
Here is the Plancton0618 technical analysis , please comment below if you have any question.
The ENTRY in the market will be taken only if the condition of Plancton0618 strategy will trigger.

NZDJPY inside a megaphone range 🦐 On the daily chart the market is inside a megaphone since 2018 and recently just hit the upper trendline where it started the downtrend.
The price is now currently retracing and will probably hit the 0.382 at the resistance structure.
If the market will give us bear signal at the resistance we can look for a possible short according to our rules.
–––––
Here is the Plancton0618 technical analysis , please comment below if you have any question.
The ENTRY in the market will be taken only if the condition of Plancton0618 strategy will trigger.


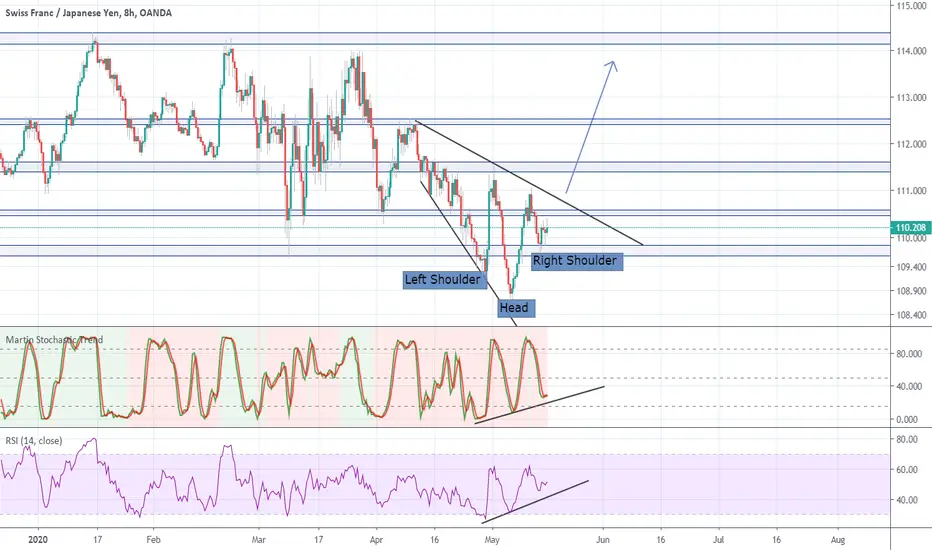
CHFJPY Mid-Term Bullish ViewTF: 8 HR
CHFJPY looks like it may have a nice up trend in the coming weeks. Some reasoning behind my view:
1. Price is currently forming and trading within a in a bullish descending wedge/megaphone pattern on the 8 HR time frame.
2. Along with this descending pattern, a inverted H and S pattern seems to be forming with it currently forming the right shoulder to potentially complete the pattern.
3. Bullish divergence can be seen on both the stochastic and RSI
I am planning to start opening small positions and build into a larger one once the price breaks the descending pattern and confirms. I am looking to build into this over the next few weeks.

Bitcoin Megaphone Bottom IdeaA potential roadmap to keep an eye on, especially if S&P 500 starts breaking down

SPX might top 1 month prior to US elections?hello traders,...
to the point: FA and TA so far confirms it, it looks like it is in megaphone Top pattern, but that doesnt mean it cant be bulish till 1 month prior to elections and print a new high ....
no entry, but i had to do this analise bcs it reflects the crypto (or did), so why not make it public,
hope u find it usefuel

GBPCHF is forming an expanded triangle 🦐GBPCHF is forming an expanded triangle (also called megaphone).
the price is close to a nice sell zone, we are waiting our signals to place an order.
