Memestocks

correction from $24 to $10 was the 4th wave?recently I was extremely bearish on MVIS but I changed my mind.
XABC shark harmonic pattern:
AB=0.38 XA
BC=2.24 AB *invalid*
tp1=0.78 XA=$20 *reached*
tp2=0.88 XA=$29
tp3=1.6 BC=1.42 3-4=$34 *cypher reversal possibility*
tp4=1.13 XA=$76
tp5=2.24 BC=$248

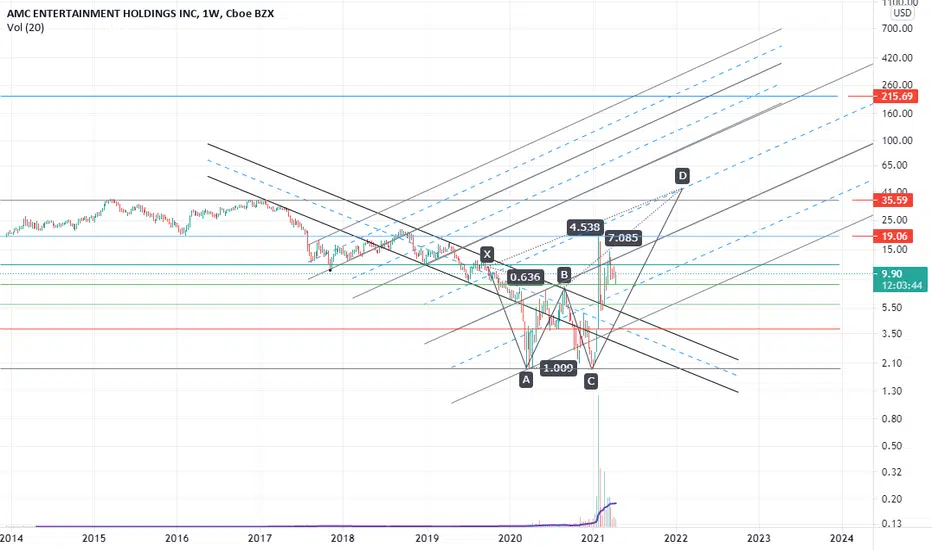
AMC is bullish on the 3rd wave of Elliottlet's talk about what we have now not what we will have. the 1st wave of Elliott broke down descending channel and 2nd wave pullback to it so we are on the 3rd wave of Elliott but what is the target. we have a butterfly that gives $43:
AB=0.78 XA
BC=0.88 AB
CD=1.6 BC= 1.27 XA=$18 *reached*
or
CD=2.24 BC=$43
since we had a strong wave on the 1st wave I believe the target must be higher. the target of Fib channel of the whole chart is $215
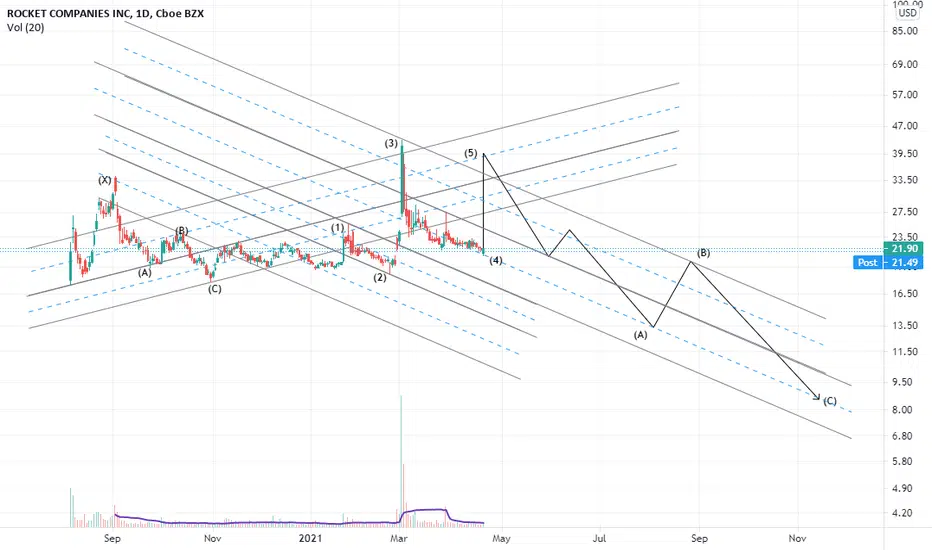
a pop to $40 and then sinking!butterfly harmonic pattern:
(4)=0.78 (3)
(5)=0.88 (4)=$39
(A)=1.6 (5)=1.27 (3)=$14
(B)=0.38 (A)=$20
(C)=2.24 (5)=$8.5
calculation of targets of the unpredictable stock!crab harmonic targets:
AB=0.38 XA
BC=0.88 AB
tp1=2.6 BC=$32
tp2=3.6 BC=$160
tp3=1.6 XA=$750
other possible targets:
tp4=0.88 AB=$2 *reached*
tp5=1.6 BC=$6.7
tp6=0.88 XA=$24
tp7=1.13 XA=$76
tp8=1.41 XA=$280

I'm not sure the 5th wave is starting or the 3rd wave!cypher targets:
AB=0.38 XA
BC=1.42 AB
tp1=1.27 BC=$2.3 *reached
tp2=0.78 XA=$4 *reached*
tp3=2 BC=$11
other possible targets:
tp4=0.88 XA=1.6 BC=$5.5
tp5=2.24 BC=$20
tp6=1.6 XA=2.6 BC=$47
I wouldn't sell till see a reversal harmonic pattern.

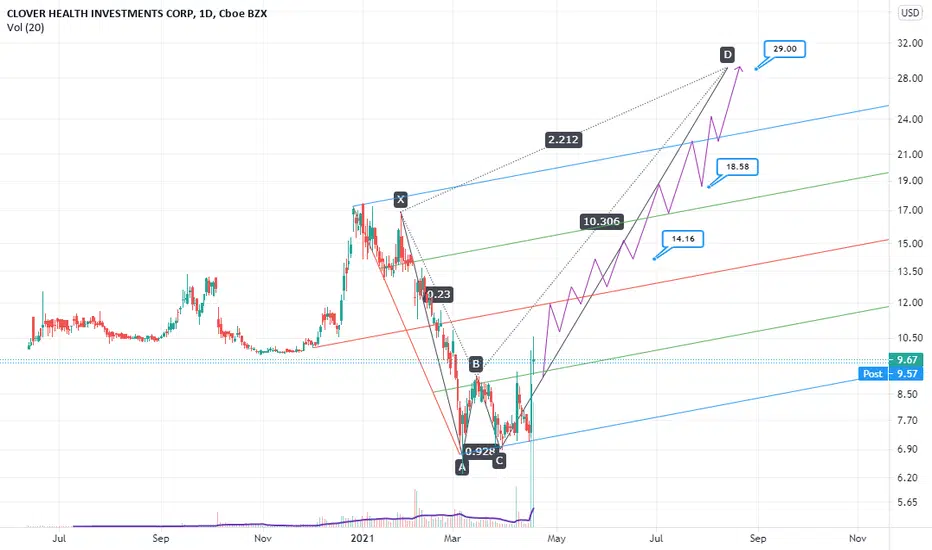
Clov is a crab!crab harmonic pattern:
AB=0.38 XA
BC=0.88 AB
CD=2.6 BC=$14
or
CD=3.6 BC=$18.5
or
CD=1.6 XA=$29
from $2.8 to $250we have a Gartley harmonic pattern of the 2nd wave of Elliott with three targets:
tp1=$4.6
tp2=$3.6
tp3=$2.8 *more likely because the 2nd wave could form butterfly pattern with ABC and the 1st wave with $250 target*

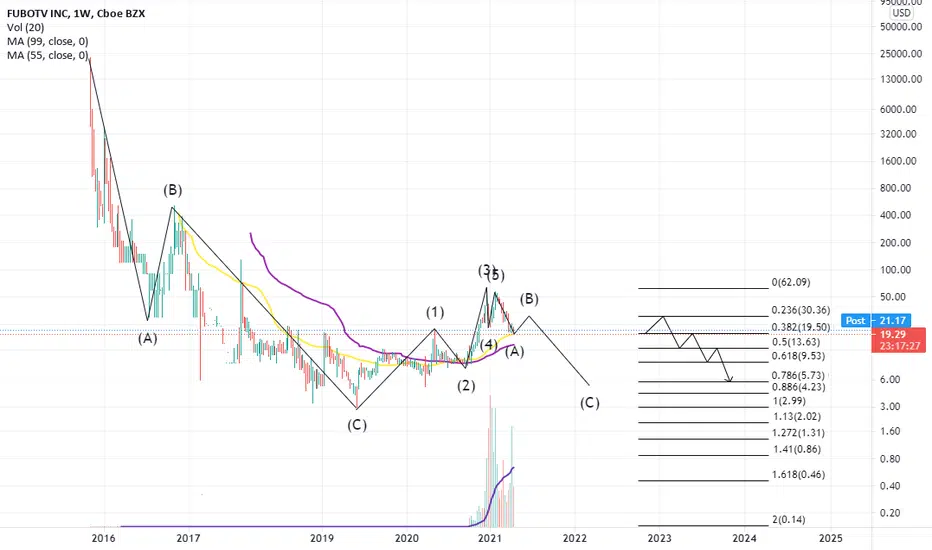
Fubo could have a positive reaction to 55 day moving averageI've been hoping that Fubo remains above the 99 days moving average and doesn't get bearish cause I saw Fubo for the first look a bat but today I see a crab!
crab harmonic pattern:
CD=1.6 XA=$6.7
or
CD=2.6 BC=$5
or
CD=3.6 BC=$2
I see the left-wing of the butterfly!37$ could be the end of the 4th wave of Elliott.
butterfly harmonic pattern:
AB=0.78 XA=$37
BC=0.88 XA=$90
CD=1.6 BC=$20

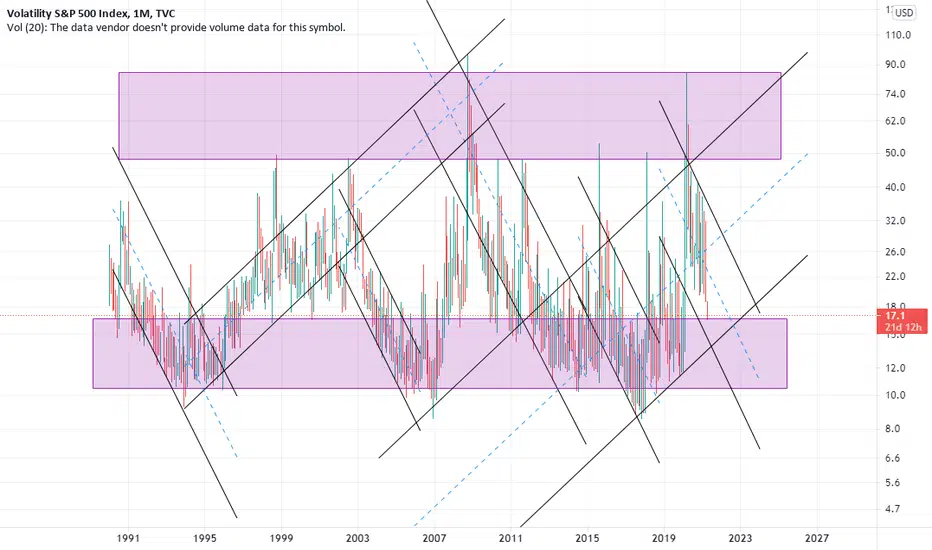
option season is coming with the volatility!VIX maybe have a positive reaction to the static support or floor of descending channel.
The second wave is over, the third wave is startingABC shark pattern
AB=0.38 5-A
BC=1.6 AB
C-3=1.6 BC

Blackberry is a shark!four targets possibility with shark harmonic pattern:
AB=0.38 XA
BC=1.6 AB
CD=0.88 XA=$52
or
CD=1.6 BC=$59
or
CD=1.13 XA=$96
or
CD=2.24 BC=$193

another validation of butterfly pattern with shark patternthe target of shark pattern is %78 of XA on butterfly pattern.
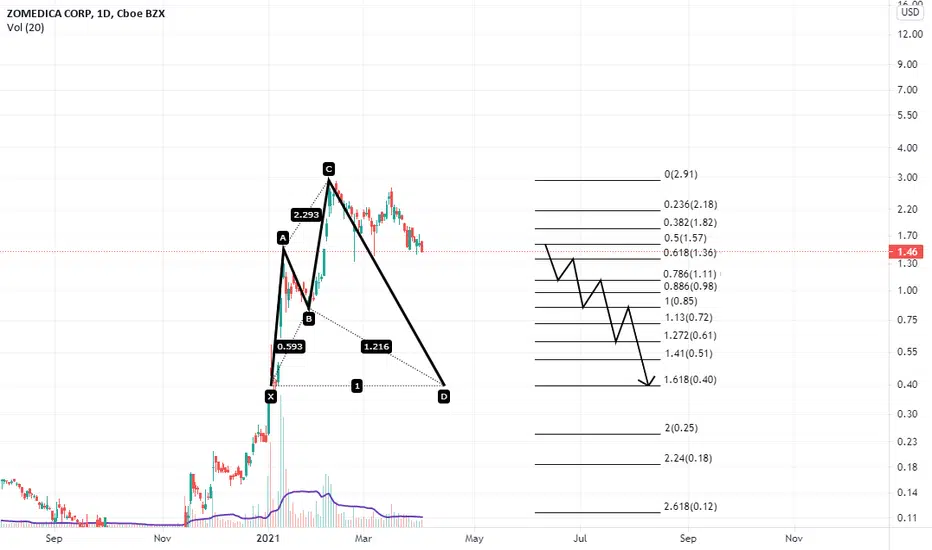
Potential of butterfly harmonic patternAB=0.78 XA=$0.41
BC=0.38 AB=$0.87
CD=1.27 XA=$0.12
DE=0.61 CD=$0.41

butterfly targets in Elliott insightthe targets of ABC correction have been calculated base on the butterfly harmonic pattern.
A=$0.41
B=$0.87
C=$0.12

The end of Wave 1 is near. Do not fall into the trap of Wave 2The microwave 5 is starting on wave 1 with the target of 17.5.
Catch right price and time of wave 3.

$GME - Poised For Another Squeeze Towards $324Looking at the 30 minute chart, we can see that $GME is forming an inverse head and shoulders pattern. However please note that prices are yet to break above the confirmation line which is right around the 220.00 area.
An important factor to note here is that the right shoulder is forming above the 5DMA and the slope of the MA is positive. I therefore expect prices to find support at the 5DMA and continue higher and retest the confirmation line and complete the right shoulder.
Thereafter is about breaking above it and I expect a strong burst in volume if prices do so. A good way to confirm a valid break is to wait for prices to close above the confirmation line before getting in.
A pattern failure will happen if prices close below the low of the right shoulder which is around the 160.00 area and thus becomes a good level to place a mental stop loss at. Provided prices confirm the pattern, I expect prices to retest the highs of 324.00

Nokia loves 2.24 level of FIBONokia does not have other ratios of the butterfly pattern but 2.24 is for this pattern only.
5-A=2.24 4-5
so target of the 5th wave could be:
C-5=2.24 B-C=$50 *shark reversal scenario*

Wave 3 starts in July and will last up to 4 yearsNokia's fair value is 4.6$ and a positive divergence is created as wave C falls below previous wave 1. The microwave 5 is starting on new wave 1.

butterfly could shift to cypher patternAs long as it is not more than 200, it is suspicious of the head and shoulder pattern with a short-term target of 34$, and if it goes above 250, the butterfly pattern could shift to the Cypher pattern with a target between 560 to 700 and then falls to 5$.


Ok. Fresh eyes on this...The previous trends, both the upward and downward trendlines, have failed to predict the price action. I took away everything except my Gann Fan and one reliable trendline.
At this moment I believe we'll see a bounce on the 24th. It could be somewhat jarring.
