MES - Descending Channel + Liquidity Sweep at 6,940 | Reversal?
What's up traders! 👋
Interesting setup developing on MES1! right now. We've got a descending channel in play, but something caught my eye - a liquidity sweep just happened around 6,940. Let's break it down.
What I'm Seeing
MES1! is trading at 6,966 inside a descending channel on the 45-minute timeframe. Price has been making lower highs and lower lows - textbook bearish structure. BUT we just saw a liquidity sweep around 6,940 where sellers couldn't close their positions.
This is where it gets interesting. When liquidity gets swept and price bounces, it often signals smart money stepping in. The question is: reversal into the FVG zone, or continuation down to the lows?
The Liquidity Sweep Setup
Price swept below 6,940 - grabbed liquidity from weak longs
Sellers couldn't close at those prices - trapped shorts
Bounce happening now - buyers potentially stepping in
FVG zone at 6,965-6,985 is the first target if reversal confirms
If FVG fails to hold, continuation to 6,925 and 6,912.25 lows
Market Context
The broader picture:
S&P 500 fell 0.53% to 6,926.60 today - risk-off sentiment
JPMorgan dropped 4% despite beating earnings (credit card cap fears)
Financials dragging the market lower
Core CPI came in cooler (0.2% vs 0.3%) - but market still selling
Trump vs Powell drama continues - uncertainty elevated
Forward curve still pricing 7,100+ by end of 2026 - long-term bullish
Key Levels to Watch
Resistance:
6,965-6,985 - FVG zone (first target if reversal)
7,002 - Day's high
7,036 - 52-WEEK HIGH / Major resistance
Support:
6,940 - Liquidity sweep zone
6,925 - Horizontal support
6,912.25 - LOWEST LOW (channel bottom)
Two Scenarios
Bullish reversal: The liquidity sweep at 6,940 trapped shorts and smart money is stepping in. Price bounces into the FVG zone (6,965-6,985), reclaims it, and pushes toward 7,000+. This would be a classic sweep → reversal pattern.
Bearish continuation: The descending channel continues to dominate. Price retests the FVG zone but gets rejected, then breaks below 6,940 and targets 6,925, eventually hitting 6,912.25 (the lowest low). High impact news or Fed drama could accelerate this.
My Take
I'm NEUTRAL here but watching closely for the reversal. The liquidity sweep at 6,940 is significant - that's where trapped sellers create buying pressure. If we can reclaim the FVG zone and hold above 6,965, the reversal thesis gains strength.
However, the descending channel is still intact. Until we break above the upper trendline, the trend is technically bearish. Don't fight the trend unless you see clear reversal confirmation.
Watch the FVG zone reaction. That's your tell.
Drop your thoughts below - reversal or continuation? 👇
MES

$SPX 7777 Next!SP:SPX sell down in April last year brought it to the 50 Fib and bounced perfectly. As shared earlier in my group and shared here now, SPX 7777 is next price target.

MES – NY Open BreakdownBias remains bullish, but MES moves with a lot more intention.
Double top formed, neckline broke, and now I’m looking for a measured pullback into value.
I’ve mapped out two buy zones and I’m letting price do the work:
🟩 Buy Zone 1
First area of interest. I’ll look for structure, acceptance, and continuation before getting involved.
🟩 Buy Zone 2
Lower zone. If we pull back deeper, I’m happy to wait for a cleaner, higher-quality setup there.
MES doesn’t usually sprint, it walks you into the trade if you’re patient enough 🧘♂️
NY open will tell me whether there’s opportunity or just noise.
Either way, no forcing trades.
Process first. Execution second.

S&P 500 Futures ES $1000 risk per contract/ES in a $1000 risk to $1000 reward position. Bias is bullish but watch out for news. Trailing stops can be used to scalp the market. /MES is only $100 risk per contract for 1:1 ratio. Let watch and see what happens?

Market on Fire: S&P 500 & Nasdaq Rally Towards New HighsWe have a beautiful P-Shape volume profile formed at the top and we broke and closed above it.
The P-shape volume profile is bullish profile that is formed when large volumes are transacted at the highs meaning participants a willing to pay premium price . You can see the POC so close to the top of the VAH
I checked the CVD of the volume on a footprint chart and i see the volume has -ve Delta , which means alot of aggressive sellers transacted there trying to push the price down. Now that they are being squeezed slowly and start closing out their positions, it should fuel the uptrend. i entered the trade soon as we broke and closed above the value area.
Food for thought.. Who was willing to pay the high price to buy from the aggressive sellers?
DEFINITIONS
POC- point of control
VAH- Value area high
CVD- Cumulative Volume Delta
Target is the ExoFade area..Lets see how this trade goes

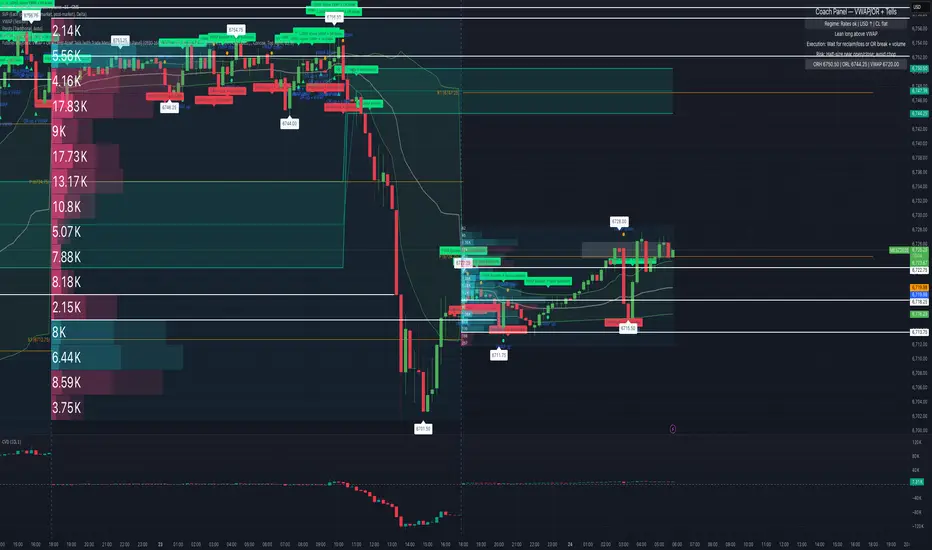
VWAP/OR Setups & Macro Crosscurrents (Sept 24, 2025)The S&P 500 (MES1!) is currently in a volatile state as Wednesday’s trading session commences.
Macro headwinds have dampened expectations for further rate cuts, leading to weakness in Big Tech yesterday. On the other hand, sector tailwinds have emerged, with Micron reporting strong Q4 earnings and Boeing and Palantir forming an AI partnership. These developments have generated after-hours optimism, supporting the performance of semiconductors and AI-related stocks.
This volatile environment presents opportunities for scalpers. The volatility around VWAP/OR levels, coupled with liquidity-driven inflections, creates fertile ground for scalping.
Chart Context (MES1! – 15m & 5m overlays):
VWAP serves as a key pivot point, with multiple reclaims and rejections occurring overnight. The ORH stands at 6720.50, while the ORL is at 6719.75. As of pre-market, the VWAP is also at 6719.75. High-volume nodes at 6710–6722 act as scalp magnet zones. The overnight low at 6701.50 remains the downside inflection point.
Scalping Plan:
- Long bias above VWAP/OR breaks with volume. Target 6728 to 6735+.
- Fade VWAP rejections back to OR. Quick 1–2pt rotations.
- Avoid chop inside VWAP compression.
Risk Management:
- Use half-size into the open; scale only on confirmed breakout.
- Hard stop: sustained trade below 6701.50.
- Event risk: 10:00 AM New Home Sales, 4:10 PM Mary Daly speech.
Takeaway:
Scalpers should focus on reacting to market movements rather than predicting future trends. The ongoing debate between Powell and Micron is likely to lead to whipsaws in the market. Therefore, it’s crucial to adhere to VWAP/OR discipline, respect liquidity pockets, and let the market tape confirm the direction of the trade.
Sep 10 MES Recap: Watching MAG7, Session Highs/Lows, and Higher MES Journal – September 10, 2025
Today I traded MES using supply and demand levels, while also tracking leadership from the MAG7 (with QQQ as my main proxy).
Track the MAG7 with me on TradingView using the MAG7
List .
I didn’t trade with this strategy until a few guys in my Discord recommended it. I had a bit of a learning curve, but I finished green on most accounts for the first time in a while.
Context I Tracked
Asian session high/low: 6,514 / 6,492
London session high/low: 6,528 / 6,506
Previous day high/low: 6,536.25 / 6,489.25
PPI report (Aug 2025): -0.1% vs forecast, shifted bias from bullish to bearish intraday
VWAP levels on both ES and QQQ
Wins
Stayed green overall on funded accounts with payout potential.
Saw the end-of-day pump confirmed by MAG7, even after an initial retrace.
Reinforced my supply/demand and VWAP process.
Losses and Lessons Learned
Entered one trade without higher timeframe confirmation, which cost me a FundingTicks eval account (treating this loss as tuition).
Learned that higher timeframes (1H/4H/Daily) must confirm intraday levels before entering.
Looking Forward
I’ll combine:
Supply/Demand + Session Highs/Lows
Leader ETF (QQQ/MGK/MAG7)
Higher Timeframes (1H/4H/Daily)
This approach gives me more conviction and fewer blind trades.
Indicators
Since I’m still learning how to mark levels properly, I’m starting out with indicators to help reinforce that I’m using potentially correct levels. I primarily used:
Asian
& London Sessions High/Lows
Previous
Highs & Lows
Supply
and Demand Visible Range
TradingView default VWAP indicator

CME Gap Aligns with 4h 200 EMAThe CME Gap around 5710-5730 is beginning to align with the 4h 200 EMA.
4h RSI has been diverging bearish 3 times with each leg up within the channel above.
Also, a breakdown of that channel has measured moves down that align with both the 4h 50 and 200 EMA:
- 50 EMA an 0.5x measured move down
- 200 EMA a 2.5x measured move down
Pre-req on targeting the gap is a breakdown of the parallel channel shown above, and then loss of the 4h 50 EMA.
Good luck!

A look at the ES1!What's up traders,
Havent posted in a while.
Heres my take and outlook for next week, using the MES1! (SP500)
Current Outlook
Technical Look:
Momentum Bearish -323.25 (looks weak)
MACD Bearish, possibly inflecting
RSI 36.72, off lows and crossing MA (oversold)
200D SMA at 5775.75 (Below the 50 Day)
50D SMA at 5967.43 (Above the 200 Day) Trending towards a Death Cross
Price Action
Bullish Engulfing Candle on the March 14 bounce.
Price successfully crossed the 5600 Psychological Level
We bounced at ~5500
Experiencing resistance in the 5640-5620 Range (expected)
Sentiment
Canada showed promise as heading towards a (take your best guess at the details) resolution to the tariff fight with the united states.
Tariffs remain a major drag on the stock market pricing.
Government shut down at time of this post, is apparently narrowly avoided.
Gold Set a new high.
Outlook for Next Week
Economic Reports
Monday - Retail Sales 830AM
Tuesday - Building Permits, Housing Starts 830AM
Wednesday - Fed Int Rate Decision 2PM, JPOW Speech 230PM
Thursday - Existing home sales 10AM
Notable Earnings Reports
Micron
Nike
Fed Ex
General Mills
Carinval Cruise
NIO
Tencent
I viewed the Firday bounce as a sort of 'relief rally'. My belief is that we could go higher on the back of it. The market has majorly 'oversold' by the numbers - and the probability of a bounce became increasingly likely. Upside resistance to remain mercurial on the rapidly changing sentiment narrative.
A possible outcome: retest the underside of the 200DMA.
I do not expect a notable price recovery towards ATH's until the tariff effects are known, which means: I expect higher than normal volatility for several months
Earnings projections (in the coming earnings season) will shed the required light on reality.
I have been adding long term holds - such as:
GDX
DAX
META
GOOG
AMZN
BABA
UNH
C
CRWD
IBIT
NVO
CMG
INDA
AVGO
I remain ~90% cash at ~3.7% yield.
Resistance possibly at:
5672 August 2024 Resistance, September 2024 Support
5724 July 2024 Resistance and later Support
5775 (200 Day SMA)

Inflation Fears Weigh More than China Tech GainsDeepSeek Is Not the Market’s Biggest Concern
Over the past few days following the emergence of DeepSeek, Nasdaq or technology stocks have experienced a notable 6% decline across all major U.S. indices. However, this recent pullback pales in comparison to the more substantial drop seen in December.
Small-Cap Stocks Take a Bigger Hit
The Russell 2000, which tracks small and medium-sized enterprises in the U.S., suffered an even sharper decline, falling by 12%. This suggests that broader economic concerns, beyond just the tech sector, are weighing on investor sentiment.
Then, What Is It?
On December 18, during the highly anticipated Federal Open Market Committee (FOMC) meeting, the Federal Reserve announced a widely expected 0.25% rate cut, bringing the Fed Funds Rate down to 4.5%. However, it wasn’t the rate cut that rattled the market—it was Fed Chair Jerome Powell’s comments that followed.
“… the median participant projected that the appropriate level of the federal funds rate would be 3.9% at the end of 2025, indicating expectations of two additional rate cuts in 2025, down from the four projected in the previous summary.”
This statement signaled that the Fed remains hawkish on inflation, with expectations of only two rate cuts in 2025 instead of the previously projected four. As a result, borrowing costs are likely to remain elevated at around 3.9%, a scenario that investors had not fully priced in. The market reacted negatively, with indices falling sharply over the subsequent weeks.
Market Stabilization Amid China Tech Competition
Despite the recent downturn, there are signs of stabilization, with major indices still maintaining their position along an established uptrend line. As long as inflation continues to ease—hovering around 3% or, ideally, heading toward the Fed’s 2% target—the broader market outlook remains positive.
From a strategic standpoint, I will continue to focus on buying dips if the market respects the uptrend line. However, if hopes for rate cuts in 2025 fade and the trend begins to break below key support levels, my strategy will shift toward selling into strength when opportunities arise.
Short-Term Trading Outlook
To refine my trading decisions, I have also drawn trendlines on an hourly chart. Applying the same uptrend principles, these lines serve as a guideline for short-term trading in the Micro S&P 500 futures.
With the latest January Consumer Price Index (CPI) reading at 3%—higher than expected—I will be closely monitoring my daily chart's uptrend line.
While external economic conditions remain unpredictable, adapting trading strategies in response to market trends is key to staying ahead.
Please see the following disclaimer and information that you may find useful:
E-mini S&P 500 Futures & Options
Ticker: ES
Minimum fluctuation:
0.25 index points = $12.50
Micro E-mini S&P 500 Futures & Options
Ticker: MES
Minimum fluctuation:
0.25 index points = $1.25
Disclaimer:
• What presented here is not a recommendation, please consult your licensed broker.
• My mission is to create lateral thinking skills for every investor and trader, knowing when to take a calculated risk with market uncertainty and a bolder risk when opportunity arises.
Trading competition: www.tradingview.com
Trading the Micro: www.cmegroup.com
CME Real-time Market Data help identify trading set-ups in real-time and express my market views. If you have futures in your trading portfolio, you can check out on CME Group data plans available that suit your trading needs www.tradingview.com

DeepSeek Is Not What the Market FearsWith the emergence of DeepSeek, tech stocks have generally dropped by 6% over these few short days across all US indices, but from the peak in late November to December, we saw a much more massive drop among all of them.
The Russell 2000, representing small and medium-sized enterprises in the U.S., declined by 12%,
What triggered this sell-off in the tech giants (Nasdaq), the old guards (Dow Jones), the suite of blue-chip stocks (S&P 500), and the medium-sized firms (Russell 2000)?
Markets are inter-connected. What should we be looking out for, and how should we navigate if the market break below this recent all-time low?
E-mini S&P 500 Futures & Options
Ticker: ES
Minimum fluctuation:
0.25 index points = $12.50
Micro E-mini S&P 500 Futures & Options
Ticker: MES
Minimum fluctuation:
0.25 index points = $1.25
Disclaimer:
• What presented here is not a recommendation, please consult your licensed broker.
• Our mission is to create lateral thinking skills for every investor and trader, knowing when to take a calculated risk with market uncertainty and a bolder risk when opportunity arises.
Trading competition: www.tradingview.com
Trading the Micro: www.cmegroup.com
CME Real-time Market Data help identify trading set-ups in real-time and express my market views. If you have futures in your trading portfolio, you can check out on CME Group data plans available that suit your trading needs www.tradingview.com

Trading Plan ES TODAYCurrent Position: Average entry price stands at 5741, ATM.
Trading Plan:
Targeting a push toward 5800, with plans to exit prior to the U.S. market open.
Although seller momentum appears depleted, I remain cautious about the likelihood of a sustained rally.
Intraday Strategy:
Hold a bullish outlook until the market open.
Anticipate a retracement toward yesterday’s close, at which point I intend to re-enter long positions.
Monitoring Approach: I will closely supervise the U.S. market open trades with heightened scrutiny compared to pre-market positioning.

Anticipating a Retracement Before Shorting. wait for news/openThe tech sector has experienced a decline following the Q3 earnings reports. I am looking for a balanced retracement to yesterday's closing value. From that area, I plan to initiate a continued short position.

S&P500 reaches Sell ZoneThis area offers the best Risk to Reward ratio for Opening Fresh Short positions Top of the TrapZone, Once RED UMVD starts and we start seeing RED Bars again
If VIX stays high we can get another leg down!

Why Large Firms with Huge Cash? Small Firm Are Leading...Berkshire Hathaway, an investment company is not investing. What is the signal?
Why are they hoarding cash?
• Not much good investment opportunity ahead
• Preparing for tougher time
E-mini S&P 500 Futures & Options
Ticker: ES
Minimum fluctuation:
0.25 index points = $12.50
Micro E-mini S&P 500 Futures & Options
Ticker: MES
Minimum fluctuation:
0.25 index points = $1.25
Disclaimer:
• What presented here is not a recommendation, please consult your licensed broker.
• Our mission is to create lateral thinking skills for every investor and trader, knowing when to take a calculated risk with market uncertainty and a bolder risk when opportunity arises.
CME Real-time Market Data help identify trading set-ups in real-time and express my market views. If you have futures in your trading portfolio, you can check out on CME Group data plans available that suit your trading needs www.tradingview.com

Bear Market or Short-term Sell-Off?The March CPI was reported at 3.5%, higher than expected on April 10. This development triggered a sharp decline in the stock market, with a total drop of 8.5% from the recent high.
Could this downward movement signal the onset of a major bear market, or is this sell-off simply a retracement, setting the stage for the bull market to resume?
We will explore this question by studying the following hypothesis:
• A rising CPI is a leading indicator of a bear market.
• A declining CPI is a leading indicator of a bull market.
Micro E-mini Nasdaq Futures & Options
Ticker: MNQ
Minimum fluctuation:
0.25 index points = $0.50
Disclaimer:
• What presented here is not a recommendation, please consult your licensed broker.
• Our mission is to create lateral thinking skills for every investor and trader, knowing when to take a calculated risk with market uncertainty and a bolder risk when opportunity arises.
CME Real-time Market Data help identify trading set-ups in real-time and express my market views. If you have futures in your trading portfolio, you can check out on CME Group data plans available that suit your trading needs www.tradingview.com

S&P500 Futures Analysis - Continuous, Just as the Markets !This is a Thread, so Follow for Technical Analysis performed with TrapZOne Pro & UMVD Indicators.
* Trend is Based on TrapZone Color
* Bar Colors give us Momentum Green from strong Up Moves. Red Bars point to strong Down Moves.
* Red UMVD = Selling Pressure & Green UMVD = Buying Pressure. Purple is for Divergence = Battle of Supply & Demand
--------------------
1-15-2024
Downtrend with UMVD showing Divergence. Price sliding as US MSI also points to weakening in the market. Hold On to You Hats I Say :)

SPY- Open Put Options to Hedge Long Stocks SHORTSPY on the 15-minute chart seems to have hit a pivot high. With a variety of long positions,
I need some insurance against a bull trap or even a black swan event in geopolitics. It seems
SPY puts would fulfill the purpose. Out of the money below the current price seems
opportunistic. Accordingly, I will take a handful of put options that expire at the mid- March
monthly 1% below current price. If the market is healthy these will drop in value especially
with time decay. They will serve as insurance. On the other hand if the market gets a cold
or worse a bad case of COVID, these will partially offset any losses while managing positions.

Levels for MES this weekAfter last weeks incredible failed breakdown we blasted back to the upside in which case
I am sure took a lot of traders off guards. This week i will be looking for areas of supply
on pullbacks and continue to buy this trend to the upside. With most data being out of the way
lets look forward to the new year!!!!

I have drawn up some levels for the week, please take a look. Here we are looking at the MES , I will be looking for long set ups and possibly
scalping shorts if the opportunity presents itself. We do have more incoming data
so expect year end volatility.

ES range for 14-Nov [ETH Update]Capitalize on the around-the-clock liquidity of E-mini S&P 500 futures (ES), and take advantage of one of the most efficient and cost-effective ways to gain market exposure to the S&P 500 Index, a broad-based, capitalization-weighted index that tracks 500 of the largest companies of the US economy and a key indicator of the stock market’s health. With ES futures, you can take positions on S&P 500 performance electronically.

SPY Short/PutStill in a downward trend and entered in that bearish weekly FVG. Looking to possibly add to position. Target is the previous lows or bullish Weekly FVG. Looking for this trade to play out by the end of 2023.

ES range for 06-Nov [RTH Update]Capitalize on the around-the-clock liquidity of E-mini S&P 500 futures (ES), and take advantage of one of the most efficient and cost-effective ways to gain market exposure to the S&P 500 Index, a broad-based, capitalization-weighted index that tracks 500 of the largest companies of the US economy and a key indicator of the stock market’s health. With ES futures, you can take positions on S&P 500 performance electronically.
