XAUUSD 3-Month to 1-Year PredictionThe XAU to USD exchange rate is forecasted to increase by 58.20% in the next three years, rising from the current rate of $ 4,208.48 to $ 6,657.85.
Metals

Gold Price Outlook – Trade Setup (XAU/USD)📊 Technical Structure
TVC:GOLD Gold continues to trade steadily above the $4,163–$4,147 support zone, holding within a broader consolidation while respecting the mid-term bullish structure. Price has repeatedly rejected the support band, showing that buyers are still defending the lower boundary. On the topside, the $4,251–$4,268 resistance zone remains the key ceiling—this is where sellers have consistently stepped in.
The current 4H structure shows a potential pullback into support before buyers attempt another run toward the resistance zone. As long as gold holds above $4,163, the bullish bias remains intact. A clean break below this level would flip the structure bearish and expose
deeper downside.
🎯 Trade Setup
Idea: Buy from support, targeting a retest of the resistance zone.
Entry: $4,163 – $4,147
Stop Loss: $4,138
Take Profit 1: $4,251
Take Profit 2: $4,268
Risk–Reward Ratio: ≈ 1 : 3.45
Bias stays bullish as long as price holds above the support zone. A 4H close below $4,138 invalidates this upside scenario.
🌐 Macro Background (Simple Version)
Markets broadly expect the Federal Reserve to cut interest rates this Wednesday, with traders pricing in almost a 90% probability of a 25 bps cut. Lower interest rates reduce the opportunity cost of holding gold, so rate-cut expectations naturally support the metal.
At the same time, China continues increasing its gold reserves, marking a 13-month buying streak. This steady central-bank demand adds an extra layer of support beneath gold prices.
U.S. data, such as the stronger-than-expected University of Michigan Consumer Sentiment Index (53.3), briefly lifted the USD, but not enough to offset the broader rate-cut narrative. Overall, the macro tone remains mildly supportive for gold as long as markets believe the Fed will ease policy this week.
🔑 Key Technical Levels
Resistance Zone: $4,251 – $4,268
Support Zone: $4,163 – $4,147
📌 Trade Summary
Gold holds steady above key support as markets wait for the Fed’s decision. With rate-cut expectations high and China continuing to buy gold, dips into support remain attractive for buyers targeting the $4,250–$4,270 zone. The setup stays constructive unless price closes below $4,138.
⚠️ Disclaimer
This analysis is for reference only and does not constitute trading advice. Trading involves significant

Part 2 - Analysis on Silver and trade setupThis is the second party of a previous video I did on XAGUSD (although accidentally called it UJ in the title of the last video).
I hope you find it insightful. All the analysis is included in the video. Also some teaching.
- R2F Trading

CADJPY – Final Diagonal Before the Drop!We’ve been tracking CADJPY for years, and price continues to follow Elliott Wave structure with precision.
The major decline in 2024 completed wave (1) and triggered a higher-timeframe correction. Since then, price has developed a clear W–X–Y structure.
- W topped in late 2024
- X completed after a clean ABC decline
- Price is now in wave Y, unfolding as a zigzag (5-3-5)
Within Y, waves (A) and (B) have completed, and price is now pushing through the final 5-wave structure of wave (C). This final diagonal is what will complete the entire W–X–Y correction before the next major bearish leg begins.
Our focus is now on the ending diagonal forming in wave (C). Once this diagonal structure breaks, it will confirm that wave Y has completed and that the higher-timeframe downtrend is ready to resume.
Trade Idea:
Entry: Break of the diagonal
Stops: Above the break candle / above the final high of the diagonal
Targets:
TP1: 101.50 (1200 pips)
TP2: 95.00 (1850 pips)
Optional runner: Keep a portion open for long-term continuation
Goodluck and as always, trade safe!
See below for our previous CADJPY analysis:
Swing 1:
Swing 2:
Swing 3:
Swing 4:

BRIEFING Week #49 : Watch Oil & USDJPYHere's your weekly update ! Brought to you each weekend with years of track-record history..
Don't forget to hit the like/follow button if you feel like this post deserves it ;)
That's the best way to support me and help pushing this content to other users.
Kindly,
Phil

07.12.25 Market AnalysisSorry for microphone, but i think i give you important levels of nasdaq, bitcoin, gold, usdjpy, wti and more.. Next week BOJ and FED will come with spicy news :) so be carefula about positions. Better smaller lots..
Thanks for now. Videos will come..
DYOR.
MEC

XUA/USD) Bearish trend analysis Read The captionSMC Trading point update
Technical analysis of GOLD (XAUUSD) – 1H SMC Analysis
1. Key Observations
Double Liquidity Grab at Equal Highs
Price swept the same major high twice (red arrows).
This indicates liquidity engineered to fuel a move lower.
Classic SMC POI: strong reversal probability after 2nd sweep.
Distribution Phase Between Sweeps
Blue highlighted zones show consolidation after each run.
Market is using this zone to accumulate sell orders.
Implies price imbalance exists underneath.
---
2. Current Market Structure
Shift from Bullish → Bearish
Break below recent demand suggests market structure shift.
Short-term trend now bearish until proven otherwise.
Price at 200 EMA Support
Price hit the 200 EMA and bounced slightly.
Temporary reaction + corrective pullback is expected.
---
3. Fair Value Gap (FVG) Setup
The blue box zone marks a bearish FVG / imbalance zone:
Likely area for retracement before continuation down.
Price should retrace into 4218–4232 zone.
This aligns with:
Premium zone
Supply region
FVG mitigation
---
4. Projected Move
Primary Scenario (Bearish)
1. Pullback → into FVG (4218–4232)
2. Reaction lower → break structure
3. Pullback lower high → continuation
4. Move towards downside liquidity
Target Zone:
4,157.52
– Marked as “target point” on chart
– Confluence:
Previous swing low
Liquidity pool
Discount zone
---
5. Why Downside Targets Make Sense
Above liquidity already harvested
Trend shift confirmed
FVG awaiting mitigation
Liquidity sitting below lows shown by arrows at bottom
Market likely wants to collect liquidity below December lows.
This is a high-probability SMC continuation setup.
---
Trade Plan Idea
Potential Short Entry:
4218–4232 (FVG / supply zone)
Confirmation:
Rejection wick
BOS on lower TF (5–15m)
Stops:
Above sweep zone
≥ 4250 ideal
Targets:
1. 4170
2. 4157 (main target)
3. Extended: 4145 (if momentum strong)
---
6. Risk Notes
Gold is volatile, especially around US sessions.
Avoid chasing shorts at current level.
Best R:R is waiting for pullback into premium zone.
Mr SMC Trading point
---
Overall Thesis:
This chart is showing a textbook SMC reversal setup:
Liquidity sweep at highs
Structure break
Pullback to FVG
Downside trend continuation
Bias: Bearish until FVG mitigated and lower low formed.
---
Please support boost 🚀 this analysis

XAU/USD | Watch it closely! (READ THE CAPTION)By examining the 4H chart of Gold, we can see that after going through the supply zone, it failed to keep itself above there and experienced a heavy fall with more than 500 pips. Currently below the supply zone, I believe a fall to $4160 IFVG is possible and then another bullish run to the supply zone.
We shall see what happens.

EUR/USD | Where is it headed? Hello everyone, I'm here with another EURUSD analysis.
So, as you can see, EURUSD managed to break out of the supply zone, but only to reach the FVG and dropping back to the supply zone. If it manages to break out of the supply zone again, we could see a rise to 1.16810 and we have to see how it reacts to the FVG this time. If it breaks the FVG as well, a rise to 1.17000 is expected to happen.
However if it fails to go through the supply zone, a drop to 1.15790-1.1589 FVG zone is also likely.

Last XPT Options Insights & What They Mean for Precious MetalsPlatinum Options showed unusual activity last week — and it’s worth your attention.
Why focus on platinum?
It’s a traditional institutional instrument, with minimal retail presence.
Check your terminal: compare spreads in PL vs. gold or silver — you’ll see the difference.
Low liquidity → less noise → clearer signals from funds and smart money.
And here’s the key:
Platinum often leads the way.
Its moves and positioning frequently foreshadow broader precious metals trends.
🔍 What Are We Seeing Now?
Large structured plays emerged in platinum, targeting a range between 1,750 and 2,200.
Most portfolios are hedged, which tells us:
“We’re bullish long-term — but expect pullbacks before the main move.”
This isn’t speculation.
It’s strategic positioning with risk management built in.
📌 In short:
They believe in higher prices — just not in a straight line.
💡 Silver: Similar Sentiment
The same bias appears across the asset- Bullish call spreads actively traded
Targets:
Silver: $65–85
Horizon: from 16 days to March 2026
🧠 Final Takeaway:
Platinum has already spoken. Precious metals bias is bullish, but a price decline is expected.

Silver is in the Bearish directionHello Traders
In This Chart XAGUSD HOURLY Forex Forecast By FOREX PLANET
today XAGUSD analysis 👆
🟢This Chart includes_ (XAGUSD market update)
🟢What is The Next Opportunity on XAGUSD Market
🟢how to Enter to the Valid Entry With Assurance Profit
This CHART is For Trader's that Want to Improve Their Technical Analysis Skills and Their Trading By Understanding How To Analyze The Market Using Multiple Timeframes and Understanding The Bigger Picture on the Charts

SILVER: Bearish Continuation & Short Trade
SILVER
- Classic bearish pattern
- Our team expects retracement
SUGGESTED TRADE:
Swing Trade
Sell SILVER
Entry - 58.349
Stop - 58.743
Take - 57.644
Our Risk - 1%
Start protection of your profits from lower levels
Disclosure: I am part of Trade Nation's Influencer program and receive a monthly fee for using their TradingView charts in my analysis.
❤️ Please, support our work with like & comment! ❤️

Is the Metals Market Signaling a New Platinum Upswing?🏆 PLATINUM VS U.S. DOLLAR 📊 Metals Market Swing Trade Blueprint
━━━━━━━━━━━━━━━━━━━━━━━━━━━━━━━━━━━━━━━
📈 BULLISH SWING TRADE SETUP ⚡
Asset: XPT/USD (Platinum Futures)
Timeframe: Swing Trade (4H-Daily)
Strategy: Breakout Reversal
Risk/Reward Ratio: 1:2.85 ✓
━━━━━━━━━━━━━━━━━━━━━━━━━━━━━━━━━━━━━━━
🎯 TRADE SETUP PARAMETERS
💰 ENTRY ZONE
Primary Level: @1,620 (Post-Resistance Breakout Confirmation)
Trigger: Clear breakout above key resistance
Strategy Note: Enter ANY price level AFTER confirmed breakout candle closes above 1,620
🛑 STOP LOSS
Hard SL: @1,530 (Risk Buffer: $90 per contract)
⚠️ CRITICAL: Place SL ONLY AFTER breakout confirmation
📌 This is YOUR risk management choice - adjust per your position sizing & strategy
🎪 TARGET LEVELS
Primary TP: @1,720 (Resistance Trap + Overbought Zone)
Profit Taking: Strong resistance cluster + momentum divergence
📌 Exit strategy is YOUR choice - capture profits when conditions align
━━━━━━━━━━━━━━━━━━━━━━━━━━━━━━━━━━━━━━━
🔗 RELATED PAIRS TO MONITOR 📊
1️⃣ GC/USD (GOLD vs USD) 🥇
Correlation: POSITIVE (0.85+) - Precious metals move together
Key Point: If gold breaks above 2,050, XPT bullish bias strengthens
Watch: USD weakness = simultaneous gold/platinum rallies
2️⃣ SI/USD (SILVER vs USD) 🔶
Correlation: POSITIVE (0.78+) - Precious metals complex
Key Point: Silver acts as leading indicator; watch for breakout first
Watch: Industrial demand driver for platinum alternatives
3️⃣ DXY (US DOLLAR INDEX) 💵
Correlation: NEGATIVE (-0.82) - Inverse relationship
Key Point: Weaker dollar = stronger commodity prices
Watch: If DXY drops below 104.50, XPT uptrend likely accelerates
4️⃣ PALLADIUM/USD (PA/USD) 🔹
Correlation: POSITIVE (0.72+) - Autocatalyst/industrial metals
Key Point: Similar industrial demand patterns
Watch: Pd strength validates industrial commodity rally
5️⃣ CRB INDEX (Commodity Index) 📉
Correlation: POSITIVE (0.68+) - Broad commodity sentiment
Key Point: General risk-on environment supports metals
Watch: If CRB breaks resistance, XPT momentum likely continues
━━━━━━━━━━━━━━━━━━━━━━━━━━━━━━━━━━━━━━━
📋 TRADE MANAGEMENT CHECKLIST
✅ Wait for CONFIRMED breakout candle above 1,620
✅ Risk only what you can afford to lose
✅ Monitor USD weakness as bullish catalyst
✅ Watch gold (GC) for correlation confirmation
✅ Set alerts at key resistance levels
✅ Take partial profits at 1,720 resistance
✅ Trail stop after 50+ pips profit
✅ Review position during FOMC/economic data
━━━━━━━━━━━━━━━━━━━━━━━━━━━━━━━━━━━━━━━
🎓 KEY TAKEAWAYS
→ Platinum bullish bias on breakout above 1,620
→ Multiple precious metals correlations support uptrend
→ USD weakness = primary tailwind
→ Gold confirmation = higher probability setup
→ Target 1,720 resistance with proper risk management
Trade Smart. Trade Safe. Trade Responsibly. 🎯

The AI Boom's Unsung HeroThe rise of artificial intelligence isn’t just shaking up tech companies it’s quietly transforming the global silver market in a big way. As major players like NVIDIA, Google and others ramp up their AI infrastructure silver is becoming more critical than ever. Why? Because silver, thanks to its unmatched electrical conductivity, plays a key role in powering the hardware behind AI.
Silver is the most conductive metal on Earth. That makes it perfect for high-performance computing something AI needs a lot of. It’s especially important in data centers and advanced semiconductors, where both electrical and thermal performance are mission-critical.
What’s really interesting is that AI servers tend to use two to three times more silver than traditional data center servers. That’s because AI workloads are more power-hungry, generate more heat and require more complex cooling and electrical systems. Simply put, more AI means more silver.
If there’s one company at the heart of this trend it’s NVIDIA. Analysts at Morgan Stanley expect NVIDIA to consume a staggering 77% of all silicon wafers used for AI accelerators in 2025 up from 51% in 2024. That adds up to around 535,000 300-mm wafers a year each of which contains silver in key components.
All of this AI growth is showing up in the numbers. Industrial silver demand hit an all-time high of 680.5 million ounces in 2024. The electronics industry alone uses around 250 million ounces per year and AI is now the fastest-growing part of that.
Despite all this demand, silver supply just isn’t keeping up. The market’s been in deficit for four straight years, with a total shortfall of 678 million ounces between 2021 and 2024. That’s roughly ten months of global mine output gone missing from the balance sheet.
It’s no surprise, then, that silver prices have been climbing fast. As of July 2025 silver’s up nearly 30% for the year. Looking further ahead I see room for silver to keep climbing:
In the short term (2025): $36–$42 per ounce seems realistic
By 2026: Potential for $50+ as more AI growth stays strong
AI isn’t just changing how we work, communicate, or compute—it’s literally reshaping the commodities that make this technology possible. Silver, once thought of mainly in the context of jewelry or coins, is now a backbone material for the AI revolution.

GOLD (XAUUSD): Sticking to The Plan
Gold stuck on a key daily resistance this week.
To buy, we continue waiting for its breakout.
A daily candle close above 4266 will confirm a violation.
A bullish continuation will be expected to 4355 then.
❤️Please, support my work with like, thank you!❤️
I am part of Trade Nation's Influencer program and receive a monthly fee for using their TradingView charts in my analysis.

XAUUSD Long: The 4,160 Support Holds – Path to 4,260 is OpenHello, traders! The price action for XAUUSD is currently developing within a well-defined ascending trend structure, supported by a rising major Trend Line from the lows. The market previously showed multiple rejections from the Triangle Supply Line, each marked by clear breakout attempts followed by corrective pullbacks. These reactions formed a sequence of higher lows, confirming that buyers remain in control of the broader structure.
Currently, after the last strong impulsive move upward, Gold reacted from the Supply Zone around 4,260, forming a short-term corrective phase while respecting the rising Triangle Demand Line near the 4,160 demand level. Price is now compressing between the descending supply line and the ascending demand line, creating a tightening triangle structure that signals growing pressure for a directional expansion. This compression reflects a balance between profit-taking sellers at resistance and aggressive dip-buyers along demand.
My scenario for the further development is bullish continuation as long as price holds above the Triangle Demand Line and the 4,160 demand zone. I expect a rebound from current levels, followed by a renewed attack on the 4,260 Supply Zone. If buyers manage to produce a clean breakout above this resistance, Gold may accelerate toward higher targets with strong momentum continuation. However, if the supply zone holds and price breaks below the demand line, a deeper corrective pullback toward the main rising Trend Line could develop. For now, the structure favors buyers, with the key focus on a breakout attempt toward 4,260. Manage your risk!

GOLD DAILY CHART ROUTE MAPHey everyone,
Please see our Daily chart route map that we are tracking.
Price is currently playing between the longer daily chart range 4128 and 4259, with the channel half-line acting as support.
We need to see a body close or ema5 cross and lock above or below the weighted levels to confirm the next range. We're also watching for a break above 4259 to confirm a continuation above.
This is the beauty of our Goldturn channels, which we draw in our unique way, using averages rather than price. This enables us to identify fake-outs and breakouts clearly, as minimal noise in the way our channels are drawn.
We will use our smaller timeframe analysis on the 1H and 4H chart to buy dips from the weighted Goldturns for 30 to 40 pips clean. Ranging markets are perfectly suited for this type of trading, instead of trying to hold longer positions and getting chopped up in the swings up and down in the range.
We will keep the above in mind when taking buys from dips. Our updated levels and weighted levels will allow us to track the movement down and then catch bounces up using our smaller timeframe ideas.
Our long term bias is Bullish and therefore we look forward to drops from rejections, which allows us to continue to use our smaller timeframes to buy dips using our levels and setups.
Buying dips allows us to safely manage any swings rather then chasing the bull from the top.
Thank you all for your likes, comments and follows, we really appreciate it!
Mr Gold
GoldViewFX

GOLD WEEKLY CHART MID/LONG TERM ROUTE MAPHey everyone,
Please see our weekly chart timeframe Route map and Trading plans for the week ahead.
We are seeing a repeat of the same ranging action again. We still have a long range candle body close gap above at 4294, with 4059 acting as support. We can expect price action to play between these two levels. We now also have EMA5 cross and lock above to strengthen the gap toward 4294. Conversely, a ema5 lock back below 4059 would reopen the broader retracement range.
We’ll keep these long timeframe structures in mind as we continue with our plan to buy dips.
We will keep you all updated as this chart idea unfolds.
Mr Gold

XAUUSD: Triangle Breakdown Setup Points Toward $4,160 SupportHello everyone, here is my breakdown of the current Gold setup.
Market Analysis
Gold has recently moved out of a strong upward channel, where price previously showed consistent bullish momentum supported by higher lows and clean breakouts. After breaking out of the first channel, XAUUSD formed a consolidation range, signaling temporary equilibrium between buyers and sellers. This range acted as a base for the next impulsive bullish leg, which drove price back into a new upward channel. However, after the strong rally, gold formed a fake breakout near the $4,240 resistance area, which coincides with the upper boundary of the triangle resistance line. This false breakout indicated weakening bullish pressure and exhaustion near the top of the structure. Once price failed to hold above the resistance, it rotated downward and began forming a tightening triangle pattern between the descending resistance line and the rising support line.
Currently, XAUUSD is trading inside this triangle structure, with price gradually compressing. The $4,160 support level remains a key reference point, as it previously acted as a major demand zone during the last correction and is now aligned with the triangle’s lower boundary.
My Scenario & Strategy
My scenario is bearish as long as gold stays below the triangle resistance line and continues to respect the lower highs forming within the pattern. If price maintains this structure and fails to reclaim $4,240, I expect a downward move toward the $4,160 support zone.
Therefore, a clean breakdown below the triangle support line would confirm bearish continuation and could open the door for a deeper correction. On the other hand, if price rejects the support and breaks above the triangle resistance, the bearish setup becomes invalid, and buyers may attempt another retest of the $4,240 level. For now, the structure favors a short bias with the main objective being a move toward the $4,160 support level, which remains the next significant target for sellers.
That's the setup I'm tracking. Thank you for your attention, and always manage your risk.

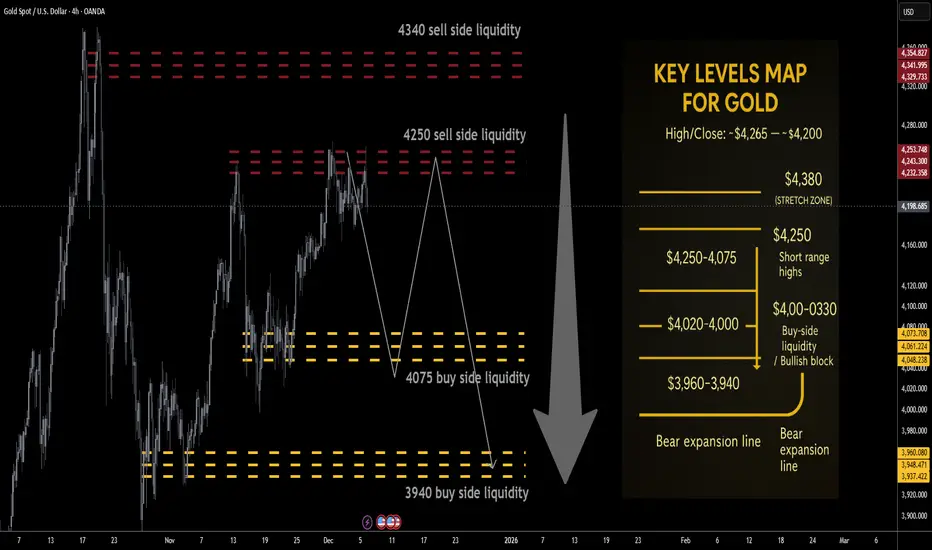
Gold next week Key S/R Levels and Outlook for Traders🔥 GOLD WEEKLY SNAPSHOT — BY PROJECTSYNDICATE
🏆 Swing High / Swing Low
$4,265 → ~$4,164 — clean rejection from the 4,26x breakout zone with a long upper wick, but weekly close still near $4,200, keeping price pinned in the upper part of the broader $4k range.
📈 Trend
Higher-timeframe: Structural bull trend intact while price holds above the $3,940–$4,000 block.
Tactical: Last week’s failed extension above $4,250 and the close back near $4,200 tilt the tape into distributive mode:
Rallies into $4,250 / $4,340 = sell-side liquidity magnets.
Downside liquidity sits lower at $4,075 / $3,940, making upside risk/reward look asymmetric to the downside from current levels.
🛡 Supports – Buy-Side Liquidity / Downside Objectives
$4,130–$4,100:
Short-term intraday pivot where buyers repeatedly stepped in last week; first micro-reaction zone on any flush.
$4,090–$4,075 🟢 Buy-side liquidity #1
First true BSL pocket below the close; ideal TP1 for shorts from above and a spot where responsive dip-buyers are likely to probe.
$4,020–$4,000:
Psychological shelf; loss of 4k would confirm that local distribution is winning and open the deeper BSL run.
$3,960–$3,940 🟢 Buy-side liquidity #2 / structural block
Higher-timeframe demand and key liquidity magnet for a fuller corrective leg. A sustained break/acceptance below $3,940 would signal that the 2025 blow-off is transitioning into broader mean-reversion rather than shallow consolidation.
🚧 Resistances – Sell-Side Liquidity / Short-Side Focus
$4,220–$4,250 🔴 Sell-side liquidity #1
First overhead supply from the prior week’s failed breakout structure and just under recent highs. Clean area for “sell the rip” probes and for late longs to de-risk.
$4,300–$4,340 🔴 Sell-side liquidity #2
Extension / SLI pocket aligned with the upper part of last week’s range and just below the prior $4,38x–$4,40x all-time high band. Ideal for scaling adds if a news-driven squeeze runs stops above 4,250.
Stretch: $4,380–$4,400:
Prior record spike / stop-run area; only expected on a full-on squeeze into the Fed, but a tag here would likely be exhaustion rather than a new sustainable trend leg higher.
🧭 Bias Next Week
Base tactical bias: fade strength / short rallies, not chase upside.
the tape favors a liquidity grab higher → rotation lower scenario:
Look for wicks into $4,220–$4,340 to be sold.
Downside path of least resistance: $4,090–$4,075 → $4,020–$4,000 → $3,960–$3,940.
⚖️ Base Case Scenario
Open/early week:
Price opens near $4,200 and either trades flat or spikes briefly into $4,220–$4,250 on weekend gap/early flow.
Liquidity sweep into resistance:
Rejection from SLI:
Failure to accept above $4,250/4,300 leaves upper wicks on 4H/daily, signaling distribution.
Rotation into BSL:
First objective: $4,090–$4,075 (TP1)
Secondary objective: $4,020–$4,000 (TP2)
Stretch / full flush: $3,960–$3,940 (TP3) into the structural demand block and buy-side liquidity pocket.
🚀 Breakout / Invalidation Trigger
Bearish framework invalidation:
A strong daily/weekly acceptance above $4,380 would imply shorts caught offside and re-open the path toward $4,450+ in line with the higher Street targets for 2026.
In that case, shift from short-the-rip → neutral / buy shallow pullbacks until a new top structure forms.
🔓 Bull / Bear Trigger Lines
Structural bull line:
Above $3,940–$4,000: long-term bull structure remains intact. Even if you’re tactically short, treat deep moves into this area with respect – this is where higher-timeframe players are likely to re-accumulate.
Bear expansion line:
Below $3,940: opens scope for a faster liquidation wave toward $3,880–$3,850 and potentially a broader 2025–26 consolidation phase instead of immediate continuation higher.
🧭 Recommended Strategy – Short at Market Open
⚠️ Illustrative trade plan, not financial advice. Size and risk-manage according to your own rules.
1️⃣ Primary Short – Open + Fade the Rips
Short at/near market open around the $4,195–$4,210 zone if price opens below $4,220 and orderflow confirms rejection of higher bids.
Add / build zones:
Add 1: into $4,220–$4,250 (first SLI band / prior breakout zone).
Add 2 (only if spike): $4,300–$4,340 (second SLI; look for clear blow-off / stop-run behavior before loading the last clip).
Stops / invalidation:
Tactical stop: hard stop above $4,380.
More conservative: soft line at $4,340, hard stop $4,390–$4,400 to allow for intraday wicks.
Targets (aligned with buy-side liquidity):
TP1: $4,090–$4,075 → take partials and reduce risk.
TP2: $4,020–$4,000 → core target for the week if distribution plays out.
TP3: $3,960–$3,940 → full BSL sweep into structural demand; expect responsive buying attempts here.
GOLD RISING TRENDLINE AHEAD|LONG|
✅XAUUSD price is reacting off the rising trendline after sweeping internal sell-side liquidity, creating an ICT-style rejection that signals a bullish draw toward the next buy-side inefficiency above. Continuation is favored as long as the trendline holds. Time Frame 2H.
LONG🚀
✅Like and subscribe to never miss a new idea!✅

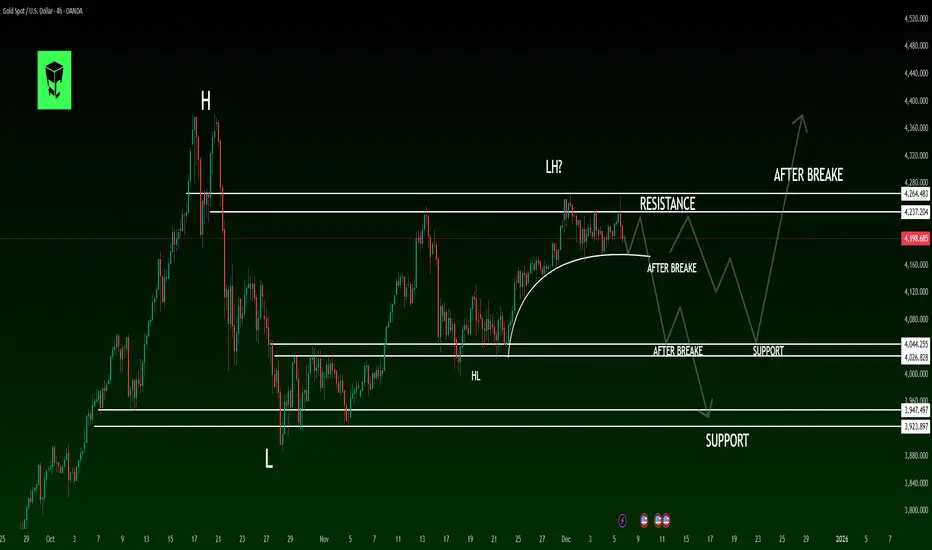
GOLD Technical Analysis: Multi-Layer Structure & Key Scenarios 4H Timeframe Analysis ⏰
Gold has entered a structural corrective phase after a strong bullish trend that formed a Higher High (HH). This correction is visible in momentum, volume, and market structure with a confirmed Lower High (LH) formation. The combination signals a powerful Decision Point that will determine gold's medium-term direction. 🔄
🔶 Market Structure Breakdown
◼️ 1. Main Bullish Wave 🚀
After breaking October resistance, price formed a HH
HH showed buyer strength, but first weakness appeared:
Sharp rejection from top → Declining bullish momentum 📉
◼️ 2. Correction Phase ⬇️
Initial correction formed a Higher Low (HL)
Price failed to break previous high → Valid LH formed
Market entered neutral-to-bearish structure
◼️ 3. Current Status 🎯
Price is trapped between two key zones:
Resistance:4270
Support: 4022
Key Levels:
🔸 Resistance Zone: LH formation area, multiple rejections
Breakout = Correction end + New bullish wave 🟢
🔸 Mid Support: Trend anchor level
Break = First confirmation of bearish structure 🔴
🔸 Major Support:4170
Break = Medium-term correction activation 📉
🔶 Probable Scenarios
🟢 BULLISH SCENARIO (Resistance Break)
Break & close above LH zone
R→S conversion
New bullish wave with volume increase
Targets:4440
🔴 BEARISH SCENARIO (Support Break)
Failure at resistance + Mid support break
Deep correction wave + New LL formation
Targets: 3950
🔶 Market Psychology 🧠
Current price action shows:
Buyer caution ⚠️
Gradual sell orders accumulation at resistance
Limited seller power in corrections
High sensitivity to fundamental news 📰
Typical pre-breakout/breakdown consolidation
📢 Your Thoughts?
Comment below with your analysis! 👇
⚠️ RISK DISCLAIMER:
Trading carries high risk. Always educate yourself and use proper risk management. Not financial advice. 📚
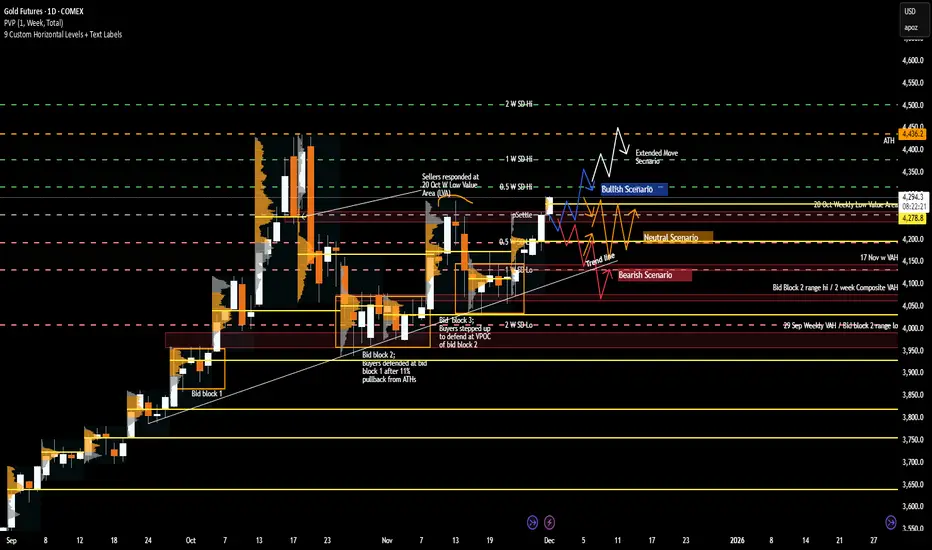
Gold Weekly Playbook: Key Levels, Scenarios & Sentiment Triggers1. Macro Update
Gold continues to trade within a macro environment defined by shifting rate expectations and evolving recession probabilities. With the Fed maintaining a data-dependent stance, the market remains highly sensitive to inflation and employment prints. Cooling inflation supports the case for rate cuts, pulling real yields lower and creating a constructive backdrop for gold.
Conversely, stubborn inflation pushes the narrative toward “higher for longer,” often slowing upside momentum and encouraging more rotational price action. This doesn’t immediately turn GC bearish, but it does cap impulsive continuation as traders reassess forward guidance.
Recession sentiment is the second major driver. Rising recession odds tend to benefit gold as investors rotate into safe-haven assets, even without imminent Fed easing. A persistent soft-landing narrative—stable labor markets, steady consumption—can reduce defensive flows and temper gold’s velocity. Overall, the macro backdrop remains cautiously supportive, but still very catalyst-driven.
2. What Has the Market Done?
Gold has exhibited constructive price action, with the recent week imbalancing up and out of the 17 Nov weekly balance/value area. Importantly, the market closed at the highs of the week, signaling sustained buyer aggression and broad acceptance of higher prices.
Weekly value and Volume point of Control (VPOC) have shifted upward, reinforcing a meaningful change in participant behavior: buyers are willing to transact at progressively higher prices, and sellers have not shown the ability to force price back into prior balance. This upward migration of value marks a firm shift in short-term sentiment.
The market is also now at an important structural zone at 4251.3—the 13 Oct weekly VPOC and the 20 Oct weekly Low value area (LVA). How the market reacts at this level—rejecting, stalling, or accepting—will be a telling indicator of whether buyers maintain control or whether sellers can slow the advance.
3. What to Expect in the Coming Week
The key level to watch this week:
4254.9 - Previous week/month’s settlement price
This level acts as a major pivot for directional conviction. Holding above settlement supports the case for continuation; a sustained move below it increases the likelihood of rotation or deeper testing.
Bullish Scenario
If the market holds and accepts above 4254.9, upside continuation becomes likely.
Target 1: 4378.6 (Weekly 1 Standard Deviation (SD) High) – expect responsive sellers.
If market accepts above 4378.6:
Target 2: 4436.2 (ATH region) – extended bullish objective.
Bearish Scenario
If the market fails to hold above 4254.9, expect sellers to target 4195.3 (previous week’s VPOC).
Additional downside triggers:
If buyers cannot reclaim 4261.3 (previous week’s high), pressure may push price through prior value toward 4136.5.
If buyers then fail to reclaim back above 4195.3:
Next target: 4131.2 (Weekly 1 SD Low / 17 Nov VPOC / Bid Block 3 midpoint).
Continued seller control may extend the move toward 4070/80, aligned with the 2-week composite VAH and upper boundary of Bid Block 2.
Neutral Scenario
If neither buyers nor sellers show conviction, expect two-way consolidation around previous week’s settlement, 4254.9, between 4316.7 and 4193.1 (10 Nov weekly high / 20 Oct LVA / weekly 0.5 SD high).
This remains the most probable balance zone unless a macro catalyst drives breakout behavior.
This week’s structure is clean: one major pivot and clearly defined pathways for both sides. Whether GC breaks out or slips back into rotation will hinge on how price behaves around 4254.9.
What’s your outlook for Gold this week? Drop a comment and give this post a boost so more traders in the community can join the discussion!
Disclaimer: This is for educational purposes only and not financial advice. Always trade your own plan with proper risk management.