XAU/USD Bullish trend analysis Read The captionSMC Trading point update
Technical analysis of XAU/USD – Bullish Continuation Setup (1H Chart)
Technical Overview:
Instrument: Gold Spot (XAU/USD)
Timeframe: 1 Hour
Current Price: $4,114
Next Target: $4,220
---
Chart Breakdown:
1. Demand Zone (Blue Box):
The price has respected a key bullish order block / demand zone between $4,040 – $4,080, showing strong buyer reaction (green arrows).
2. Ascending Trendline Support:
Multiple rejections from the ascending trendline confirm higher lows, signaling ongoing accumulation from buyers.
3. Fibonacci Retracement:
The market retraced around the 0.618 – 0.786 Fibonacci levels — a strong buy zone for continuation setups.
4. Moving Averages (EMA 50 & EMA 200):
EMA 50 (Blue) is trying to cross above the EMA 200 (Black), hinting at a possible bullish crossover.
A successful break above both EMAs would confirm bullish momentum.
5. Bullish Flag / Wedge Pattern:
The structure shows a bullish flag/wedge forming after an impulsive upward move — indicating potential for another breakout rally.
---
Trade Idea:
Buy Zone: $4,070 – $4,100
Target 1: $4,160
Target 2: $4,220 (main target on chart)
Invalidation (Stop Loss): Below $4,030
Mr SMC Trading point
---
Market Bias:
Bullish Bias – As long as the price holds above the highlighted demand zone and the ascending trendline, buyers remain in control. A breakout above recent highs will confirm momentum toward the next target.
---
Pelas support boost 🚀 this analysis
Metals

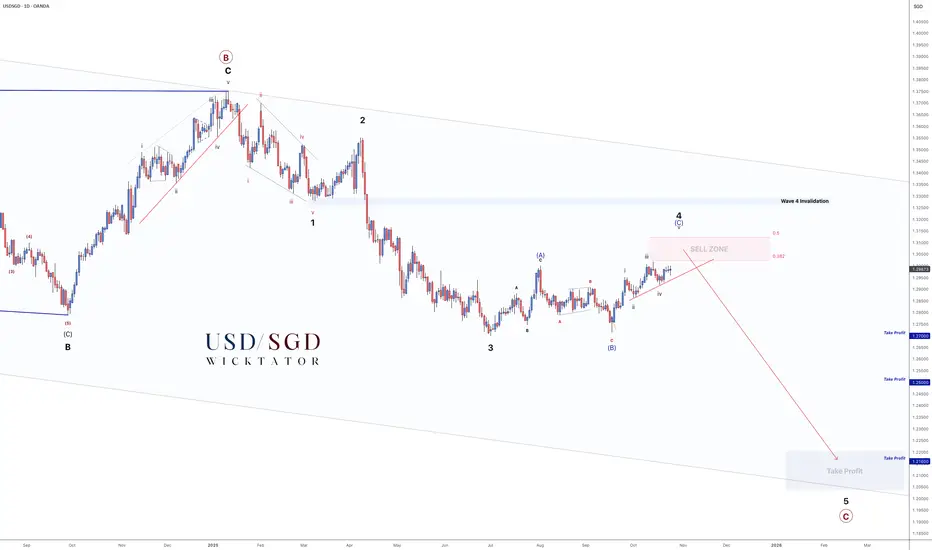
USDSGD - 1000pip Drop Almost Ready!1D Chart
In our previous breakdown, we highlighted the upcoming Wave 4 correction and the potential sell zone ahead — price has now followed that roadmap with precision and fast approaching our sell zone.
Wave 3 completed cleanly, and we’ve since seen a textbook ABC correction forming Wave 4.
Price is now approaching the Sell Zone (38.2–50% retracement), where we’ll be watching closely for confirmation to trigger shorts.
The structure remains intact — Wave 4 invalidation sits just above the 1.32 region. As long as we stay below that level, the bearish setup toward Wave 5 remains valid.
Trade Idea:
- Aggressive short: Rejection inside the Sell Zone
- Conservative short: Break of structure / trendline break confirmation
Targets:
TP1: 1.27 (400pips)
TP2: 1.25 (600pips)
TP3: 1.216 (1000pips)
Weekly Chart:
This is where patience pays off — we’ve tracked this correction from the start, and the final leg of Wave 5 is almost ready to begin.
Plan the trade. Wait for confirmation. Execute with precision.
Goodluck, and as always, Trade Safe!
GOLD (XAUUSD): Support & Resistance Analysis For Next Week
Here is my latest support & resistance analysis for Gold.
Horizontal Structures
Resistance 1: 4186 - 4244 area
Resistance 2: 4358 - 4381 area
Support 1: 4040 - 4060 area
Support 2: 3942 - 3959 area
Support 3: 3870 - 3897 area
Support 4: 3766 - 3831 area
Support 5: 3691 - 3735 area
Vertical Structures
Vertical Support 1: Rising trend line
Consider these structures for pullback/breakout trading next week.
❤️Please, support my work with like, thank you!❤️
I am part of Trade Nation's Influencer program and receive a monthly fee for using their TradingView charts in my analysis.

XAUUSD: Healthy Pullback or the Start of a Downtrend?👋Hello everyone! What do you think about the current trend of OANDA:XAUUSD ?
Looking at last week’s movement, gold experienced a pullback after nine consecutive weeks of gains. By the end of Friday’s session, price action remained relatively calm, consolidating around the $4115 area while maintaining the psychological support near $4000.
From a technical perspective, it’s still too early to conclude whether this marks the beginning of a bearish trend or just a temporary correction. However, in the short term, from my view — and that of many others — this looks more like a healthy correction than a full trend reversal.
The fundamental reasons supporting gold’s strength haven’t disappeared. The U.S. government shutdown continues, meaning we’re not receiving key economic data — increasing overall uncertainty. Meanwhile, central banks like Russia and China keep accumulating gold aggressively, and ongoing geopolitical tensions surrounding the war in Ukraine continue to support gold as a safe-haven asset.
Technically, after forming a double top, gold has entered an accumulation phase, potentially setting up for a new bullish structure. If price can break above the current resistance zone, it could open the door for a strong upward continuation.
And you — what’s your view on the future of this precious metal? 💬 Share your thoughts in the comments below!

XAUUSD: Bullish Momentum Still Intact After a Healthy PullbackHello everyone, here is my breakdown of the current Gold setup.
Market Analysis
The broader trend for Gold remains strongly bullish, as we can clearly see from the consistent upward channel that has been forming since mid-September. Each corrective phase has been followed by a decisive breakout, confirming buyers’ control and sustaining the uptrend.
Recently, the market broke out from the upper boundary of the range near 4020, establishing a new structural high close to the 4250 resistance zone. However, after reaching this zone, the price entered a correction phase, pulling back to retest the major support zone around 4050–4020 — a level that also aligns with the lower boundary of the ascending channel.
My Scenario & Strategy
At the moment, the price is stabilizing around the support zone, showing early signs of a potential bullish rebound. This zone has acted as a strong demand area throughout the uptrend, and I expect buyers to defend it once again. If the price confirms a bounce from this level, the next logical move would be a continuation towards the 4215 resistance zone, which also aligns with the mid-level of the previous range.
I remain bullish on Gold while the price holds above the 4020 support zone. A successful retest here would provide a good opportunity for long positions targeting 4215 initially. If the price fails to hold above this level, we could see a deeper pullback — but as long as the channel structure remains intact, the broader bias stays positive.
That's the setup I'm tracking. Thank you for your attention, and always manage your risk.

Siver may reach ATH again but not gold. 26/Oct/25 XAGUSD based on wave substructure silver may reach ATH again next week with price touching the upper trendline ( red) 3rd time at 55 +/-

Analysis of gold movement on the 4-hour time frameHi traders
Gold has not been able to close a candle above the equilibrium range (4114) for the 4-hour time frame for now, but it can have an upward movement to the resistance areas, pick up the rising liquidity, and then return to close a candle below the 4-hour equilibrium range (it can stabilize below 4067, in which case it will pullback to 4067 and 4090 and towards the sell).
For the resistances in question, 4171 - 4193 and 4208 - 4231 are two one-hour equilibrium resistances that the market has not yet pulled back to these numbers, and the 4-hour candle after the pullback should stabilize below these areas to confirm the continuation of the decline to low liquidity and sellers' TPs

Why Is Gold Called the King of Assets?👋Hello everyone!
If you are an investor, you have probably heard the saying: “Gold is the king of assets.” But why gold? Why does gold always hold a special place in the financial markets and is considered a safe haven in all circumstances? Let’s explore why gold deserves this title and why it remains a favorite choice among millions of people around the world!
1.Gold Is the Guarantee of Safety
When the stock market plunges, when economies face crises, or when inflation erodes the value of currencies, gold is always the first choice of smart investors. While other assets can lose value quickly, gold tends to hold its worth — and can even rise. This is why gold is regarded as a “safe haven” in times of uncertainty.
Gold is not only favored by individual investors but also by governments and central banks around the world. They accumulate gold as a way to protect their nations’ economies from global financial shocks.
2.Gold: An Asset That Cannot Be Printed Like Money
There’s one thing we must understand clearly: gold has a limited supply. Unlike money, which can be printed at the discretion of central banks, the supply of gold is fixed and can only increase through mining — a costly and time-consuming process. This natural scarcity makes gold a sustainably valuable asset.
3.Gold Is a Symbol of History
Gold is not a new type of asset. It has been intertwined with human history for thousands of years. Since the dawn of civilization, gold has been used as a medium of exchange, a precious possession, and even as the foundation of global monetary systems. From ancient Egypt to the modern day, gold has always held a special place in society.
This gives gold a level of longevity that few other assets can match. When you own gold, you don’t just own a valuable physical item — you own a piece of history.
4.Gold Is Easily Convertible and Highly Liquid
Wherever you are in the world, gold can easily be converted into cash. Unlike most other assets, you can sell gold in almost any country and in nearly any circumstance without major restrictions. Therefore, gold is not only valuable but also highly liquid, allowing you to turn it into cash whenever you need it.
5.Gold Is a Tool to Diversify Risk
While stocks or bonds can fluctuate wildly and cause anxiety, gold can serve as a perfect diversification tool. Suppose you have investments in stocks or real estate — allocating a small portion of your portfolio to gold can help reduce risk during times of market turbulence. Gold helps you protect your wealth and maintain stability in an unpredictable world.
6.Gold: An Asset Anyone Can Own
Gold isn’t just for billionaires or big institutions. You don’t need a million-dollar account to own gold. With the rise of online gold trading and products such as small gold bars, jewelry, and even digital gold, anyone can own it conveniently and affordably.
7.Gold Never Goes Out of Style
One unique thing about gold is that its appeal never fades. Every time the price rises, more people rush to buy it. Gold isn’t just valued for its stability and ability to preserve wealth — it’s also a symbol of prosperity and success. A gold ring or a small bar of gold always carries a sense of pride for its owner.
With all these reasons, it’s no surprise that gold is called the “King of Assets.” It can protect you during tough times, provide opportunities for profit in uncertain markets, and remain timeless through generations. Whether you’re a seasoned investor or a beginner, gold will always be a valuable and worthy investment choice.
Would you like to become a billionaire — a true gold trading expert?
💬Share your thoughts about gold below, and don’t forget to hit that like button — it means a lot to me!

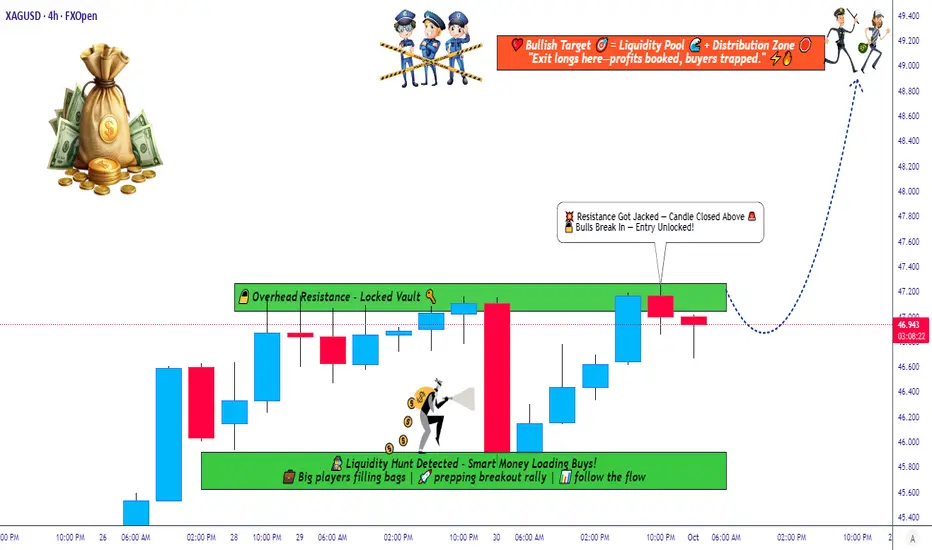
Silver Strategy Map — Thief Layers, Smart Targets, and Risk Zone📊 XAG/USD “Silver vs U.S Dollar” — Metals Market Wealth Strategy Map (Swing/Day Trade)
🔑 Plan: Bullish Setup
This setup follows the “Thief Strategy”, which means using layered limit entries to scale into the trade. Instead of going all-in at one level, we “steal the entries” across multiple layers.
💰 Layered Buy Limit Entries (Example Setup):
46.200
46.400
46.600
46.800
47.000
👉 You can increase layers as per your own plan and risk style.
🛑 Stop Loss (Protective Exit): 45.600
(This is my thief SL — but you’re free to adjust as per your own risk appetite.)
🎯 Target Zone: 49.000
⚠️ Around 49.300, we see a “Police Barricade” (heavy resistance + overbought conditions + potential trap).
That’s where profits should be taken — escape with gains before the trap closes!
Why This Setup?
Support Zones: Strong accumulation zones forming near 45.600–46.000.
Trend Bias: Silver remains bullish in the medium-term metals market outlook.
Layering Strategy Advantage: Reduces entry risk and allows better average fill.
Profit Zone: 49.000 aligns with strong supply area + RSI extension risk.
🔗 Correlation & Related Pairs to Watch
OANDA:XAUUSD (Gold vs USD): Gold often leads Silver’s moves — watch Gold for early signals.
TVC:DXY (US Dollar Index): A weaker USD usually boosts metals.
TVC:PLATINUM & CAPITALCOM:PALLADIUM : Industrial metals correlation — strong moves here can influence Silver sentiment.
TVC:SILVER Futures: Always track COMEX Silver contracts for volume confirmation.
✨ “If you find value in my analysis, a 👍 and 🚀 boost is much appreciated — it helps me share more setups with the community!”
📌 Disclaimer: This is a Thief-style trading strategy, created just for fun and educational sharing. Not financial advice — trade at your own risk.
#XAGUSD #Silver #Metals #TradingStrategy #SwingTrade #DayTrade #ThiefStrategy #Gold #DXY #Forex #Commodities
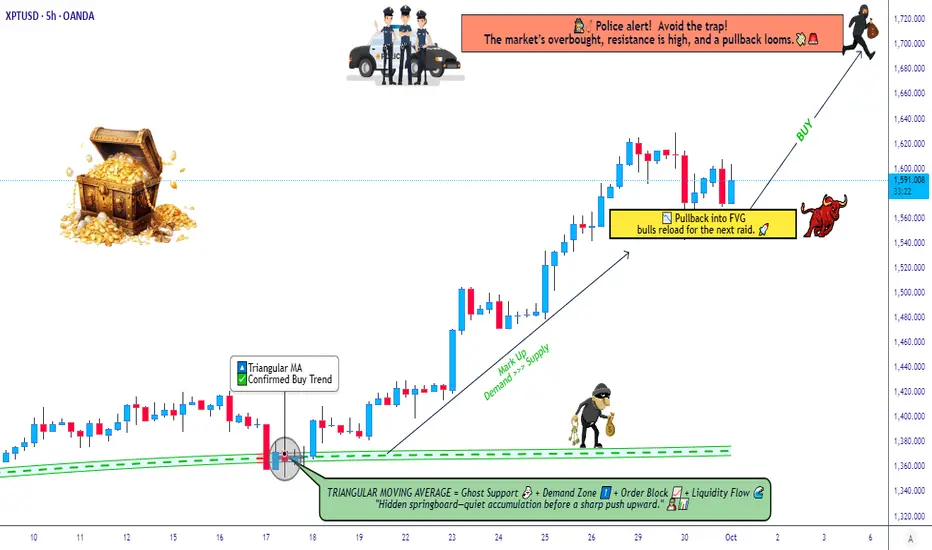
Bullish Momentum Confirmed on $XPT/USD!💎 PLATINUM vs U.S DOLLAR | Wealth Strategy Map (Swing/Day Trade) 💎
Plan:
📈 Bullish plan confirmed ✅ with pullback retest in triangular moving average + re-accumulation at neutral zone.
Entry:
💰 YOU CAN ENTER AT ANY PRICE LEVEL — Thief Layer Strategy.
Stop Loss:
⛔ This is Thief SL @1500
⚠️ Note: Dear Ladies & Gentlemen (Thief OG's), I do NOT recommend using only my SL. Your choice, your risk — make money responsibly.
Target:
🎯 @1720 → Police barricade zone: strong resistance + overbought + trap alert 🚨
💎 Preferred escape target: @1700
⚠️ Note: Dear Ladies & Gentlemen (Thief OG's), I do NOT recommend using only my TP. Your choice, your risk — take profits as you see fit.
🔗 Related Pairs to Watch & Key Points
$XAU/USD (Gold vs USD): Often shows strong correlation with Platinum. Watch Gold for leading/confirming bullish momentum.
$PALL/USD (Palladium vs USD): Platinum & Palladium can diverge in industrial demand cycles. Check for divergence alerts.
AMEX:USD Index (DXY): Strong USD = pressure on XPT/USD; weak USD = tailwind. Key macro driver.
Key Points:
1️⃣ Pullback retest on triangular MA shows strong buying interest.
2️⃣ Re-accumulation at neutral zone signals continuation of bullish trend.
3️⃣ Keep an eye on overbought conditions near $1720 — possible profit-taking zone.
4️⃣ Cross-asset signals (Gold/Palladium) strengthen conviction for swing/day trades.
✨ “If you find value in my analysis, a 👍 and 🚀 boost is much appreciated — it helps me share more setups with the community!”
Disclaimer:
⚠️ This is Thief-style trading strategy just for fun. Trade responsibly and at your own risk.
#XPTUSD #Platinum #ForexTrading #SwingTrade #DayTrade #BullishSetup #TradingStrategy #ThiefStyleTrading #MetalsMarket #TradingViewIdeas
Is the Yellow Metal Ready to BUST Out?Hold onto your hats, traders!
It's been a very wild ride in the FX_IDC:XAUUSD market, proving that what goes up (to a Double Top 🏔️🏔️) must come down (with a vengeance!). After a decisive rejection at the $4381 peak, Gold took a spectacular 8.64% dive last Tuesday, landing sharply at the $4002 low 📉. Talk about a waterfall! 🌊
But don't count the bulls out yet! Gold showed some backbone, bouncing 3.97% back up to $4161 before settling into a cage match. It's now consolidating in a classic Triangle pattern (a.k.a. Compression) 📐, ranging from the $4002 floor up to the stronger resistance near $4135.
The Great Consolidation: Triangle Tension 😮💨
The key takeaway? That $4000 psychological support is a BEAST. 💪 It survived test after test during the Asia, EU, and US sessions last Tuesday and Wednesday! This resilience allowed Gold to build support: first at the $4065 level (the Fib 0.382) and then down to the $4043 low, followed by rock-solid support near the $4000 zone.
As Friday closed out the week, Gold was still testing the lower $4100 area, pulling back to $4096. So, what’s next for the shiny metal?
That $33 candle Friday, was a direct reaction to the release of the slightly softer-than-expected US September Consumer Price Index (CPI) inflation data.
My Outlook: Patience is Gold, But the FED is Key 🔑
While some market watchers are singing a bearish tune 🐻, I see this as a healthy consolidation phase. Gold has already corrected 50% from its massive move (from $3631 low to the $4381 high). While a deeper correction to the 0.618 Fib at $3918 is possible, I don't see the catalyst right now to push it that far.
My bet? Gold will continue to consolidate in $4050 - $4150 range until the major announcement from the FED 🏦. The sharp reversal from the Double Top might just be the clean-out needed to launch prices higher once the rate cut announcement (or even just the dovish talk of future cuts) takes place! The last inflation data was a mixed bag, which gives the FED room to sound reassuringly dovish.
The FED Announcement is the main event this week. Mark your calendars! 🗓️
🔥 Key Economic Events: Central Bank Super Week! 🔥
This week is absolutely jammed with market-moving events across the globe. Get ready for volatility! 🌪️
Monday, October 27, 2025
8:30 AM ET: USD 🇺🇸 Durable Goods Orders (MoM) (Sep)
10:00 AM ET: USD 🇺🇸 New Home Sales (Sep)
Tuesday, October 28, 2025
10:00 AM ET: USD CB Consumer Confidence (Oct)
Wednesday, October 29, 2025 (The Fed Day) 🏦
All Day: HKD Holiday - Chung Yeung Day
9:45 AM ET: CAD BoC Interest Rate Decision
10:30 AM ET: USD Crude Oil Inventories
2:00 PM ET: USD Fed Interest Rate Decision
2:30 PM ET: USD FOMC Press Conference
10:00 PM ET (Approx.): JPY BoJ Interest Rate Decision
Thursday, October 30, 2025 (ECB and GDP Day)
2:00 AM ET: EUR German GDP (QoQ) (Q3)
4:00 AM ET: EUR German CPI (MoM) (Oct)
8:15 AM ET: EUR Deposit Facility Rate (Oct)
8:15 AM ET: EUR ECB Interest Rate Decision (Oct)
8:30 AM ET: USD GDP (QoQ) (Q3)
8:45 AM ET: EUR ECB Press Conference
9:30 PM ET: CNY Manufacturing PMI (Oct)
Friday, October 31, 2025 (Inflation and Month End)
6:00 AM ET: EUR CPI (YoY) (Oct)
8:30 AM ET: USD Core PCE Price Index (MoM) (Sep)
8:30 AM ET: USD Core PCE Price Index (YoY) (Sep)
9:45 AM ET: USD Chicago PMI (Oct)
-------------------------------------------------------------------------
This is just my personal market idea and not financial advice! 📢 Trading gold and other financial instruments carries risks – only invest what you can afford to lose. Always do your own analysis, use solid risk management, and trade responsibly.
Good luck and safe trading! 🚀📊

BRIEFING Week #43 : The Value Trade
Here's your weekly update ! Brought to you each weekend with years of track-record history..
Don't forget to hit the like/follow button if you feel like this post deserves it ;)
That's the best way to support me and help pushing this content to other users.
Kindly,
Phil

Gold > Previous Day Highs?Gold looks interesting from $4,100 - could act as a potential bullish pivot point to target previous day highs.
Kind regards,
Aman

Wall Street Weekly Outlook - Week 44 2025 [27.10.- 31.10.2025]Wall Street Weekly Outlook – Week 44, 2025 📊💥
Let’s dive into another exciting trading week! 🚀
Rate decisions, month-end flows, and fresh quarterly earnings are setting the stage for strong market moves.
Sit back, enjoy the overview, and dive into the world of banks, hedge funds, and institutional flows — with exclusive insights into how the pros are positioning right now. 🧠💼📈
Extra Lessons: Strategies, setups, and market psychology — everything you need to know for the week ahead. ⚡️
**S&P500 Performance after FED rate cuts**
**Overview: The most important events of the week**
Have a great start to the trading week!
Meikel

BTC - Liquidity Dynamics leading to new HighsMarket Context
Bitcoin has shown a constructive reaction from the recent lows, printing a clean double bottom structure that suggests short-term demand entering the market. After a previous buy-side liquidity sweep and rejection, price has rebalanced and is now challenging a fair value gap (FVG) that previously served as resistance. This marks a key decision zone where the next directional move will unfold.
Fair Value Gaps & Structure
The FVG overhead has already acted as resistance, capping the first impulsive move from the lows. Should price retrace slightly to take out the remaining sell-side liquidity below the double bottom before re-engaging higher, it would confirm the area as a springboard for a bullish continuation. A clean reclaim and hold above the FVG zone would signal a shift in order flow favoring buyers.
Liquidity Dynamics
The current setup offers both sides of the market clear liquidity targets: sell-side liquidity resting under the double bottom and buy-side liquidity resting above the prior high. Smart money could engineer a sweep of the lower side first to accumulate before expansion, or alternatively, break directly through resistance to trigger a larger bullish leg.
Final Thoughts
The structure reflects a balanced but bullish-leaning scenario — a classic accumulation and breakout setup. A deeper retest to clear out lower liquidity would strengthen the foundation for continuation, while sustained strength above the FVG opens the door for a reaction toward new highs.
If this analysis aligned with your view, drop a like — do you think we clear the lows first, or head straight for a bullish breakout?

GOLD → Retest 4060 within the range. What are the expectations?FX:XAUUSD is forming a correction from the Asian session, with the price testing the important 4060 zone ahead of two key events: US inflation data (CPI) and the results of US-China trade negotiations.
Key factors: US inflation (CPI): Low data will support gold (expectations of two cuts in 2024), but high figures will strengthen the USD and weaken gold (rates for a rate cut in December will decline).
Progress in negotiations between China and the US could weaken gold, while failure would bring back demand for safe havens. US sanctions against Russian oil are supporting oil prices and inflation expectations.
Gold is in wait-and-see mode. Growth is likely with weak CPI or a failure of negotiations. Strong CPI and progress in trade will reinforce the correction. The mood remains cautious ahead of events.
Resistance levels: 4090, 4150, 4163
Support levels: 4060, 4002
The important zone of 4060 - gold is forming a false breakdown. If the bulls hold their defense above this zone, it could trigger growth towards the resistance of the range. Otherwise, we can expect a retest of 4000K, and the reaction should be aggressive...
Best regards, R. Linda!

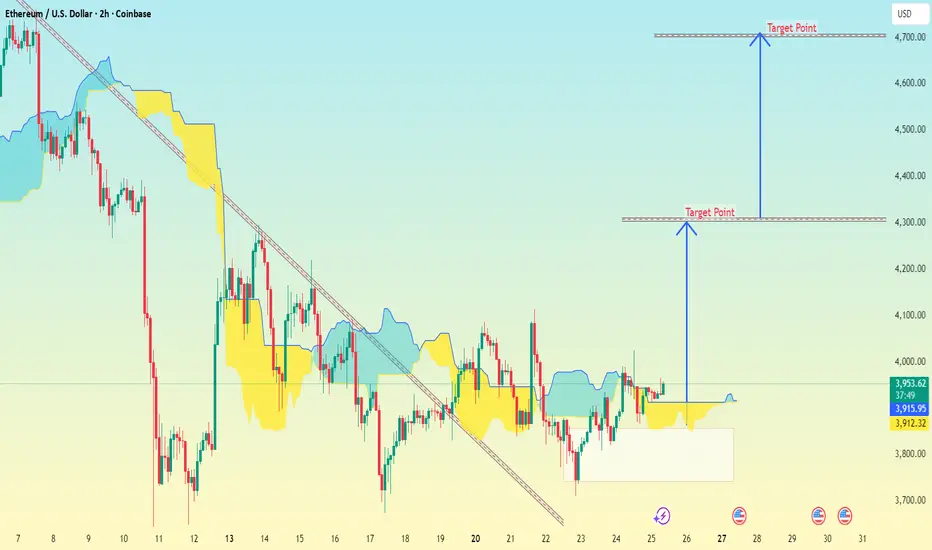
Ethereum (ETH/USD) on the 2-hour timeframe (Coinbase).Ethereum (ETH/USD) on the 2-hour timeframe (Coinbase).
My drawn two downward projection arrows labeled Target Point, showing possible downside continuation.
Here’s what the chart structure indicates:
Price is around $3,975–$4,000.
The structure shows a rising wedge breakdown, typically bearish.
Volume profile (yellow/blue areas) shows strong resistance above current levels.
Based on my arrows and price scale, my chart marks two main downside targets.
🎯 Target Zones
1. First Target Point: Around $4,200 → $4,250
Short-term correction zone, possible support test.
2. Second Target Point (Deeper move): Around $3,750 → $3,800
Major downside target — corresponds to full wedge breakdown measurement.
✅ Summary
Pattern: Rising wedge (bearish)
Current price: ~$3,975
Target 1: ~$4,200 (minor support retest)
Target 2: ~$3,750 (main bearish target)
BTC/USD (Bitcoin vs. USD) chart Pattern..BTC/USD (Bitcoin vs. USD) chart..
Here’s the breakdown of what’s visible:
The wedge is narrowing downward, suggesting price compression.
The breakout projection line (blue arrow) shows an upside target.
Current price (near wedge bottom): around $111,750.
The wedge top resistance area: around $113,500–114,000.
The measured move target (length of the widest part of the wedge projected upward) gives a target zone near $120,000–118,000.
✅ Projected Target Zone:
$12,0000 – $118,000 (USD)
⚙ Confirmation Needed:
Breakout above $113,500 with strong volume.
Retest of breakout zone holding as support.

(NZD/USD ) Chart Pattern..(NZD/USD ) the target point is clearly marked with a blue arrow labeled “Target Point.”
Looking closely:
The my target level appears to be around 0.57900 (approximately 0.5791).
The my chart shows this as an upward projection, so it looks like a bullish target from the current zone (around 0.5748).
✅ Summary:
Pair: NZD/USD
Target: ≈ 0.5790
Direction: Up (bullish move)

4 Best Forex Gold Trading Strategies For Beginners
If you just started trading and looking for a winning strategy to trade, I prepared for you 4 simple and profitable forex trading strategies for beginners.
1. Harmonic Strategy
With that strategy, you will trade harmonic patterns.
Here is the list of the most powerful ones:
Bullish/Bearish Gartley pattern,
Bullish/Bearish Bat pattern,
Bullish/Bearish Cypher pattern.
To properly apply the Harmonic Strategy you should learn just 3 things: Fibonacci numbers, impulse legs and the rules of harmonic patterns.
That strategy is very simple: it works on any time frame and your only task is to recognize the harmonic pattern and trade it strictly following the rules .
2. Trend Following Strategy
That strategy is price action based.
To properly apply that, you should learn trend analysis rules and how to identify price action legs.
Once you spotted that the market is trading in a bullish/bearish trend, your task will be to wait for a completion of a correctional movement to buy/sell t he market expecting a trend continuation.
That strategy works on any time frame, however, my recommendation is to trade 4H time frame or higher.
3. Structure Breakout Strategy
That strategy is based on structure analysis.
To properly apply Breakout Strategy , you should learn to identify key vertical and horizontal structures: supports and resistances.
Your task will be to look for a confirmed structure violation with a candle close beyond that.
Bullish breakout of a key resistance will be a signal for you to buy, expecting a bullish movement to the next resistance, while a bearish breakout of support will push the prices lower to the next structure support.
That strategy works on any time frame, however, my recommendation is to trade 4H time frame or higher.
4. Trend Reversal Strategy
That strategy is price action based.
To use it properly, you should learn trend analysis and trend reversal rules.
Your task will be to look for a confirmed trend reversal . It will lead to an initiate of a new trade and give you a perfect opportunity to catch an extended movement.
What I like about these strategies, is that while you trade with them, you master structure and price action analysis. 2 essential components of any sophisticated professional strategy.
Master one of these strategies and then modify that with experience, adding some extra layers of analysis.
Let me know which strategy do you like the most?
❤️Please, support my work with like, thank you!❤️
I am part of Trade Nation's Influencer program and receive a monthly fee for using their TradingView charts in my analysis.

XAUUSD Bearish Outlook – Liquidity Grab Into FVG ZoneThis is my new update for gold. On the 1H timeframe, we can see a double top followed by a change of character (CHOCH) to the downside, confirming bearish intent. I’ve marked two Fair Value Gaps (FVG 1 and FVG 2) as potential retracement zones.
Price has now reached a support level and bounced, forming equal highs (marked with dollar signs), indicating liquidity above. I expect a liquidity grab above these equal highs before a potential drop.
The retracement may reach FVG 1 (~50% Fibonacci) or FVG 2 (~61.8% Fibonacci). From either level, if we see a CHOCH to the downside on the 5M timeframe, that could be a strong sell confirmation, aligning with the 1H bearish structure.
My target is around $3,950, making this a high-probability short setup based on Smart Money Concepts.

XAUUSD Weekly Technical Forecast: Deep Dive AnalysisTraders, gear up for a pivotal week in Gold! As of the close at 4,112.84 on Oct 25th , XAUUSD is at a critical juncture. This analysis blends classic theory with modern indicators for intraday swings and positional trades. Bulls and bears are in a fierce battle ⚔️.
The stage is set for a significant volatility expansion. The key is to identify the dominant auction.
🎯 1D & 4H: The Swing Trade Panorama (Swing Bias)
The higher frames dictate the primary trend. The 1D chart shows a potential completion of an Elliott Wave corrective pattern (ABC) , suggesting a new impulsive wave up may be imminent.
Dow Theory : Higher highs & higher lows remain intact on the 1D, confirming the primary uptrend. ✅
Wyckoff Theory : We appear to be in a 'Spring' or 'Sign of Strength' phase after a re-accumulation period around the 4,080-4,100 zone.
Ichimoku Cloud : Price is trading above the Kumo (cloud) on 1D, a bullish bias. The Tenkan-sen (blue line) is a key dynamic support.
Key S&R : Major support rests at 4,080 (previous resistance, 50 EMA). Resistance is at the recent high of 4,140 .
A decisive 4H close above 4,130 could trigger a Bullish Breakout 🚀 targeting 4,180-4,200. Conversely, a break below 4,080 on high volume could see a drop to 4,040.
⏰ Intraday Focus: 1H, 30M, 15M, 5M (Intraday Bias)
For intraday action, lower timeframes offer precision entries.
Harmonic & Gann Theory : A clear Bullish Bat Pattern has potentially completed on the 1H chart. The PRZ (Potential Reversal Zone) aligns perfectly with the 4,100-4,105 support. Gann's 50% retracement level from the last swing up also converges here.
Bollinger Bands (20,2) : On the 1H/4H, price is hugging the upper band, indicating strong momentum. A squeeze on the 30M chart suggests a volatility expansion is due.
RSI (14) : On the 1H, RSI is in the 55-60 range, showing healthy momentum without being overbought. Watch for bearish divergence on a new high as a reversal signal.
VWAP & EMA Confluence : The 20 and 50 EMAs are providing dynamic support on pullbacks. For day trades, the VWAP on the 15M/5M charts will be your best friend for trend alignment. Long above, short below.
🚦Trade Plan: Entries, Exits & Risk Management
Identifying reversals is key. Use Japanese Candlesticks at key S&R levels. A bullish engulfing or morning star pattern at the 4,100 support, confirmed by a rising volume spike, is a high-probability long signal.
Swing Long Entry : On a 4H close > 4,130, or a pullback to 4,100-4,105 with bullish confirmation.
Swing Short Entry : On a 1D close < 4,080, targeting 4,040.
Intraday Long : Buy on a bounce from VWAP/20 EMA on the 15M chart with RSI > 50.
Intraday Short : Sell on a rejection from the 4,125-4,130 resistance with a bearish RSI divergence.
Stop-Loss : Always 15-20 pips below/above your entry trigger candle.
💡The Bottom Line:
The bullish structure is favored as long as 4,080 holds. The confluence of Harmonic patterns, Wyckoff accumulation, and bullish Ichimoku alignment points to a potential leg higher. However, respect the levels. A break below support will invalidate the bullish thesis.
Track these charts live:
1D:
4H:
1H:
30M:
15M:
5M:
⚠️ Disclaimer: This post is educational content and does not constitute investment advice, financial advice, or trading recommendations. The views expressed here are based on technical analysis and are shared solely for informational purposes. The stock market is subject to risks, including capital loss, and readers should exercise due diligence before investing. We do not take responsibility for decisions made based on this content. Consult a certified financial advisor for personalized guidance.

Dow Theory – A Compass to Help Traders Read Market TrendsHello everyone,
While Fibonacci, Trendlines, or Price Action can help you find precise entry points, nothing is more fundamental and reliable for understanding the market’s overall movement than Dow Theory . This isn’t an obscure or overly academic concept—it’s very practical. In fact, it underpins most of the trend-following strategies that traders use today.
Whether you trade Forex, Gold, Stocks, or Crypto, the core question remains the same: Is the market trending up, trending down, or just in a temporary correction? If you can’t answer this, all other technical analyses become meaningless. That’s why Dow Theory was developed—to serve as a compass, helping traders grasp the trend and make precise decisions.
Applying Dow Theory in Trading
The key to using Dow isn’t memorizing its principles; it’s about reading the real market and turning insights into action. When combined with tools like EMA and MACD , the market picture becomes much clearer: EMA shows the direction and momentum of price, while MACD alerts you to potential reversals.
For example, when prices are rising and EMA is pointing up, a MACD crossover or divergence signals a potential entry along the trend. At the same time, watching price patterns such as Head & Shoulders or Double Top/Bottom helps you anticipate trend reversals, avoiding false moves and short-term traps.
Of course, all these tools only work effectively if you manage your risk carefully , set Stop Loss levels based on price structure, and risk only a small portion of your account per trade. Dow reminds us that a trend continues until there’s a clear reversal signal, so don’t fight the market just because of a few opposing candles.
Once you grasp this principle, reading charts , identifying trends , and trading with the flow of money becomes natural and precise, without guesswork. More importantly, you’ll know when to stay out to preserve capital and when to step in to maximize profits.
That’s why Dow Theory remains a solid foundation for any trader looking to trade with the trend, whether in Forex, Gold, Stocks, or Crypto. So, are you ready to catch the market waves with Dow and capitalize on every swing?