AUDUSD: trendline breakout🛠 Technical Analysis: On the 4-hour timeframe, AUDUSD has broken above a key descending trendline and is currently testing immediate resistance near 0.65595. Although a "Global bearish signal" remains visible from the previous crossover, the recent price action suggests a bullish reversal if buyers can clear this short-term obstacle. The projected trade setup anticipates a confirmed breakout above this level, opening the door for a rapid rally toward the main resistance zone at 0.66200.
🌍 Fundamental Analysis: Volatility is expected to increase towards the end of the week amid Australian GDP data and key US data on Friday and Thursday. Traders are also exercising caution ahead of next week's Fed meeting, but this is more relevant to the medium-term outlook.
❗️ Trade Parameters (BUY) ❗️
➡️ Entry Point: Buy on breakout above short-term resistance (approx. 0.65600 – 0.65650)
🎯 Take Profit: 0.66200 (Major Resistance Zone)
🔴 Stop Loss: Below the recent consolidation (approx. 0.65369)
⚠️ Disclaimer: This is a potential trade idea based on current analysis; market conditions and price direction are subject to change based on news factors and volatility.
Metals

Gold Breakout Confirmed — New Cycle Targets Ahead(ATH Possible)Today, I analyze Gold( OANDA:XAUUSD ) on the 4-hour timeframe, building on the previous idea shared. The scenario remains unchanged.
In this analysis, I take a cyclical approach to gold on the 4-hour chart. It appears that gold is completing three similar cycles. For the third cycle to be completed, gold needs to increase.
Another point is that gold previously formed a bull trap when it tested the Resistance zone/Support zone($4,186– $4,133), but now it has successfully confirmed a breakout above that zone. This suggests that the bull trap is no longer a concern, and gold is likely resuming its uptrend.
Additionally, gold could form a bullish channel, but we currently have only one confirmed top and are waiting for a second top to validate the channel.
Moreover, today we’ll see the release of two important U.S. economic indicators, which can significantly impact gold’s movement, especially if the actual figures deviate significantly from expectations:
ADP Non-Farm Employment Change
ISM Services PMI
Considering all of the above, we can set an initial target of around $4,267 for gold. If the cycle completes fully, gold might even reach a Potential Reversal Zone(PRZ) and possibly set a new All-Time High(ATH).
Finally, geopolitical tensions, like those between the U.S. and Venezuela, often lead to higher gold prices since gold is considered a safe haven.
First Target: $4,267
Second Target: Potential Reversal Zone(PRZ)
Stop Loss(SL): $4,147
💡 Please respect each other's opinions and express agreement or disagreement politely.
📌 Gold Analyze (XAUUSD), 4-hour time frame.
🛑 Always set a Stop Loss(SL) for every position you open.
✅ This is just my idea; I’d love to see your thoughts too!
🔥 If you find it helpful, please BOOST this post and share it with your friends.

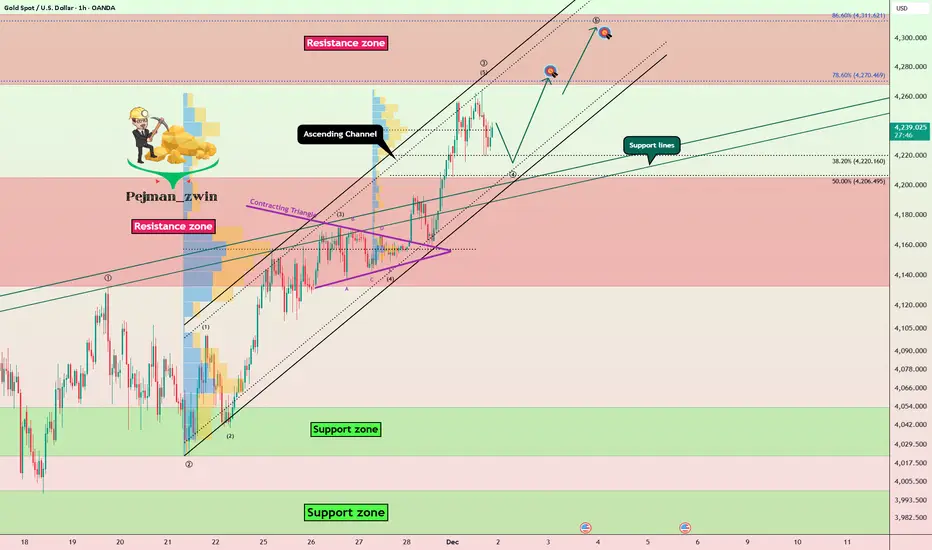
Gold Breakout + Wave Structure = New Targets LoadingGold( OANDA:XAUUSD ) has successfully broken through the Resistance zone($4,205 – $4,133) at the start of this new week, and over the past ten trading days, it seems to have formed an ascending channel.
From an Elliott Wave perspective, it looks like gold has completed wave 3 and is currently in the process of completing wave 4.
I expect that after a pullback toward the Resistance zone($4,205 – $4,133)—aligning with the lower line of the ascending channel and the support lines—gold will resume its upward movement and once again target the Resistance zone($4,316 – $4,261).
First Target: $4,266
Second Target: $4,294
Stop Loss(SL): $4,151
Note: Geopolitical tensions—especially the possibility of a direct confrontation between Venezuela and the U.S.—tend to push investors toward safe-haven assets, and gold historically reacts with strong upward momentum during such uncertainty. If this conflict escalates, increased risk aversion and volatility across global markets could support a bullish continuation in gold as capital shifts away from risk assets
💡 Please respect each other's opinions and express agreement or disagreement politely.
📌 Gold Analyze (XAUUSD), 1-hour time frame.
🛑 Always set a Stop Loss(SL) for every position you open.
✅ This is just my idea; I’d love to see your thoughts too!
🔥 If you find it helpful, please BOOST this post and share it with your friends.
Gold has entered a short-term consolidation phase.Gold continued its wide-range fluctuations, lacking sustained momentum. The daily chart showed another surge followed by a pullback, closing above the 7-day moving average. The RSI indicator remained above the midline. The 4-hour chart maintained its alternating up and down pattern, with prices consolidating around the Bollinger Band's middle line. The 1-hour chart showed the Bollinger Bands gradually narrowing. After breaking through the 4241 high in the US session yesterday following a significantly bullish ADP report, gold retreated to around 4195, continuing its range-bound consolidation. The trading strategy for gold remains unchanged: buy low and sell high, with quick entries and exits.
Gold prices have been volatile recently, mainly due to the approaching Fed rate cut, market volatility caused by economic data and official speeches, resulting in poor momentum. However, significant pullbacks have been followed by rapid rebounds, and the rising expectation of a rate cut continues to provide support for gold. Therefore, buying on dips and waiting for a breakout to new highs is a viable strategy.
Key Levels:
First Support: 4192, Second Support: 4183, Third Support: 4166
First Resistance: 4238, Second Resistance: 4250, Third Resistance: 4277
Intraday Gold Trading Strategy:
BUY: 4180-4185, SL: 4170, TP: 4200-4210;
SELL: 4240-4245, SL: 4255, TP: 4220-4210;

GBP/USD | Where is it headed? (READ THE CAPTION)Hello guys, Amirali here, back with another analysis, this time on GBPUSD.
As you can see, it reached to the FVG and then the supply zone and went up as high as 1.33540 before dropping down to 1.33280. At the moment, GBPUSD is consolidating at 1.33360 level. Should it close the supply zone and manage to stay above it, a move to 1.34000 is likely. If it fails to hold above the supply zone, I believe a downward move to 1.33000 is possible.

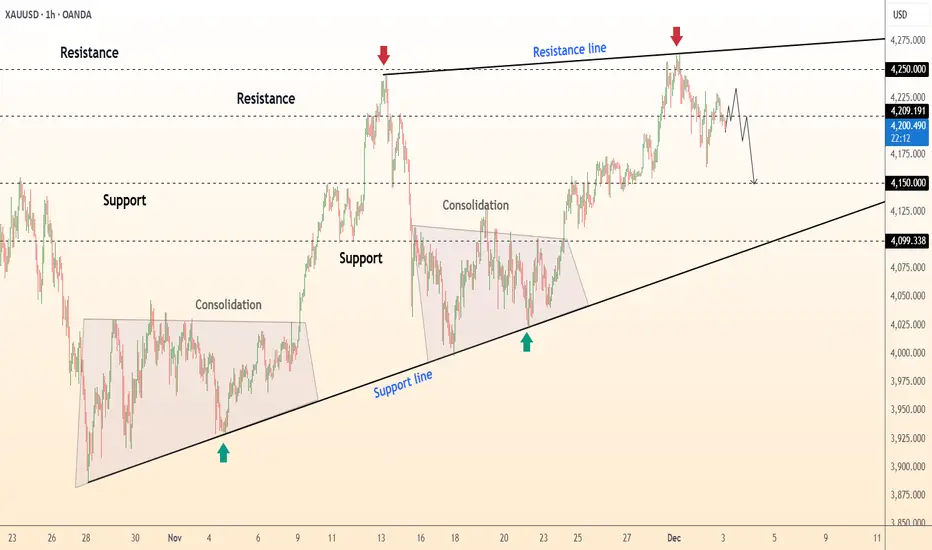
DeGRAM | GOLD is correcting from the resistance line📊 Technical Analysis
● XAU/USD rejected the upper resistance line three times, forming a clear bearish reaction near 4250. Price is losing momentum and sliding back toward the mid-range support after failing to sustain highs.
● Repeated consolidations along the rising support line show weakening bullish pressure, increasing the probability of a corrective drop toward 4150–4100.
💡 Fundamental Analysis
● Gold softens as U.S. yields rebound and Fed officials signal that policy easing is not imminent, limiting upside appetite.
✨ Summary
● Bearish bias below 4250. Targets: 4150 → 4100. Resistance: 4250. Support: 4150 / 4100.
-------------------
Share your opinion in the comments and support the idea with a like. Thanks for your support!
Why Silver Is Reaching New High?Why Is Silver Reaching New Highs?”
There are two key reasons for this:
First, it is due to de-dollarization. At this juncture, there are no other currencies ready to take over as the dominant reserve currency. Therefore, the market is turning to precious metals like gold and silver. We can also observe that each time the dollar trends lower, precious metals tend to move in the opposite direction.
Second, why is silver gaining momentum over gold this time? While gold is still trading below its October high, silver has already broken above it with strong momentum.
These are the two questions we will be discussing today.
Mirco Silver Futures
Ticker: SIL
Minimum fluctuation:
0.005 per troy ounce = $5.00
Disclaimer:
• What presented here is not a recommendation, please consult your licensed broker.
• Our mission is to create lateral thinking skills for every investor and trader, knowing when to take a calculated risk with market uncertainty and a bolder risk when opportunity arises.
CME Real-time Market Data help identify trading set-ups in real-time and express my market views. If you have futures in your trading portfolio, you can check out on CME Group data plans available that suit your trading needs www.tradingview.com

GOLD BULLISH STRUCTURE : M15 Buy Setup Greetings 👋
Gold On M15 Setup Has Bullish The Reason Of Buying Thats Liquidity Has Been Sweeped And Have A Demand Zone To Buy Gold With Confidence And The Target 🎯 is Buy Side Liquidity We Are Trade On Liquidity Hold With Breakeven

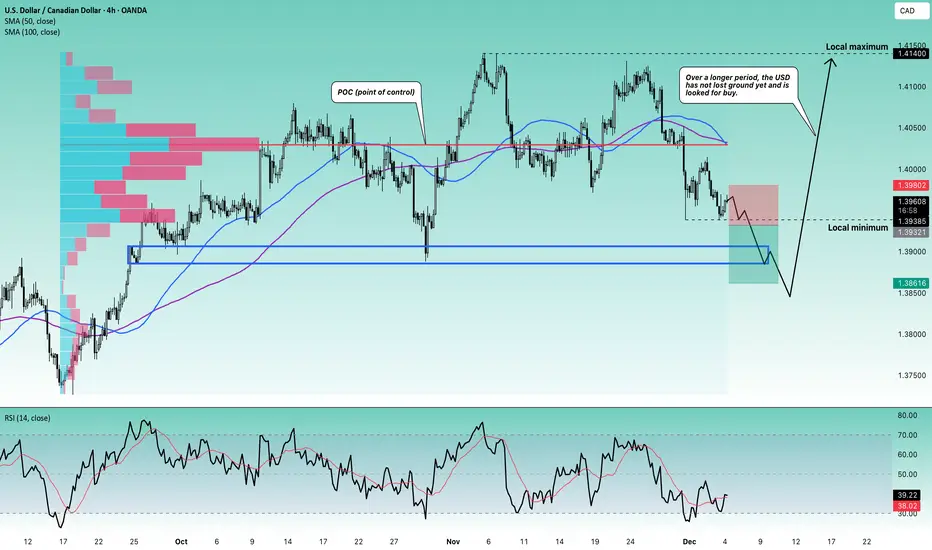
Stop!Loss|Market View: USDCAD🙌 Stop!Loss team welcomes you❗️
In this post, we're going to talk about the near-term outlook for the USDCAD currency pair☝️
Potential trade setup:
🔔Entry level: 1.32468
💰TP: 1.33901
⛔️SL: 1.31035
"Market View" - a brief analysis of trading instruments, covering the most important aspects of the FOREX market.
👇 In the comments 👇 you can type the trading instrument you'd like to analyze, and we'll talk about it in our next posts.
💬 Description: The USD will likely continue to decline in the short term, but the mid-term outlook remains favorable for buyers. For USDCAD, 1.39000 and 1.38500 are likely potential buying opportunities in the mid-term. Currently, given the price accumulation near the support level of 1.39385, a breakout to the levels outlined above is expected.
Thanks for your support 🚀
Profits for all ✅
GOLD ANALYSIS 12/04/20251. Fundamental Analysis:
a) Economy:
• USD:
The USD is recovering slightly after a strong decline earlier this week, mainly due to profit-taking flows from gold and bonds. However, the overall trend of the USD remains weak because the market believes the Fed will keep interest rates low and maintain the rate-cutting cycle to support economic growth.
• U.S. Stock Market:
U.S. equities are rising modestly thanks to expectations of a rebound in Q4 corporate earnings and capital rotating back into the tech sector. This reduces safe-haven demand, but the bullish momentum is not strong enough to exert significant downward pressure on gold.
• FED:
The Fed continues to signal a dovish stance, prioritizing economic stability over inflation control. The market is pricing in the possibility of two rate cuts in 2026, providing strong support for gold.
• TRUMP:
The Trump administration is pushing aggressive stimulus packages and trade-protection policies. Uncertainty surrounding tax strategies and pressure on China–Mexico is creating a mild risk-off sentiment, supporting gold.
• Gold ETF (SPDR):
SPDR continued to sell 1.71 tons yesterday → a slightly negative signal, indicating institutional outflows from gold as prices approached all-time highs → mildly bearish for gold.
b) Geopolitics:
• Ongoing instability in the Middle East and Venezuela, with small conflicts occurring frequently.
• U.S.–China tensions persist over technology and trade.
These factors maintain a cautious market tone and form a supportive foundation for gold to rebound.
c) Market Sentiment:
The market is in a mildly risk-on state, but not stable. Funds still move into gold as a defensive asset whenever the USD or equities show signs of profit-taking.
→ Gold continues to trade within a range, but with a bullish bias.
Asian markets are entering the year-end physical-gold buying season → supportive for gold.
2. Technical Analysis:
Trend:
• Price is holding above the rising trendline.
• MA20 – MA50 are about to cross upward → signal of short-term recovery.
• RSI is rebounding from the 30 zone → selling pressure has weakened.
Pattern:
• The U.S. session bottom has formed → price is retesting the trendline and building a new bullish structure.
• Scenario: a pullback to the trendline followed by a bounce.
RESISTANCE: 4,229 – 4,241 – 4,264
SUPPORT: 4,206 – 4,194 – 4,186
3. Yesterday’s Market (03/12/25):
• Gold moved sideways gently within a 45-dollar range.
→ The bearish structure was rejected and left a long wick → a signal that buyers have returned.
4. Trading Strategy for Today (4/12/25):
🪙 SELL XAUUSD | 4232 – 4230
SL: 4236
TP1: 4224
TP2: 4218
🪙 BUY XAUUSD | 4171 – 4173
SL: 4167
TP1: 4179
TP2: 4185

GOLD SHOOK THE MARKET – STRUCTURE STILL UNBREAKABLE!📌 CURRENT MARKET UPDATE (GOLD – 4H)
The market continues to respect the wave structure exactly as projected:
- Wave (1) – (2) has already completed
- Wave (3) tapped into the Liquidity zone 4250–4260, creating a clean corrective reaction
- Price is currently in a technical retest phase, perfectly normal within a strong macro uptrend
🎯 Key Level to Watch
The Swing Zone 4147–4150 remains solid — this is the core foundation of the entire bullish structure.
- Only if this zone breaks will the trend lose strength
- EMA34 & EMA89 continue trending upward, acting as strong dynamic support
✅ Main Scenario (High Probability)
Price makes a mild correction before pushing up to complete Wave (5) of (3).
Expected pullback zones:
🔹 4210 – 4180
🔹 Reaction confirmation → bullish continuation toward:
- 4310 – 4325 (Resistance)
- 4365 – 4370 (Liquidity – Completion of Wave (C))
Current liquidity flow still favors buy setups at support retest.
⚠️ Sub-Scenario (Low Probability)
If a 4H candle closes below 4147 → deeper correction toward EMA200 (4060–4080).
↳ Currently, there is NO sign of this scenario.
✅ TODAY’S TREND SUMMARY
Trend: Corrective – Accumulation
Optimal Buy Zones: 4210 → 4180 → 4150
Targets:
- 4310 – 4325
- 4365 – 4370
Trend invalidation: Break 4147

GOLD fluctuates sharply as labor data weakensSpot OANDA:XAUUSD closed nearly flat at $4,203.06 an ounce, down less than 0.1%, after a volatile session in New York. A significantly weaker-than-expected ADP report sent gold soaring to $4,241.60 an ounce, before profit-taking pressure and a sharp reversal in silver sent prices quickly tumbling back to $4,195 an ounce.
As of writing today, Thursday, December 4, spot gold was trading at $4,202 an ounce, up about $10 on the day.
ADP data showed the US private sector lost 32,000 jobs in November, in stark contrast to expectations for a gain of 10,000, the sharpest decline since March 2023. Win Thin (Nassau 1982) assessed that the ADP index had weakened continuously, reflecting a sustained downward trend in the labor market. Nela Richardson (ADP) noted the widespread slowdown across all business groups, especially the small and medium-sized sector, a sign of more cautious consumers in the context of macro instability.
While gold rebounded in response to the data, silver, which had touched $58.97/ounce in the early session yesterday, then fell sharply to $57.83/ounce, dragging the entire group of precious metals into a short-term correction.
Trump’s unexpected move causes market turmoil: Will the Fed chairmanship change soon?
A new political variable emerged when the White House abruptly canceled the interview schedule for the Fed chairman candidate this week. The Wall Street Journal commented that this move shows that President Trump may have finalized his choice to succeed Powell.
The market immediately raised the possibility that the leading candidate is Kevin Hassett, the White House economic adviser, who is seen as leaning towards a strong interest rate cut stance. The weak USD and recent recovery in gold partly reflect expectations that Hassett may push for a deeper easing cycle after Mr. Powell ends his term in May next year.
Steve Englander (Standard Chartered) said Hassett has an “impressive” track record, but worries about the Fed’s independence under political pressure. The Financial Times said bond investors have expressed concerns to the US Treasury that Hassett may prioritize short-term growth over price stability.
CME FedWatch currently prices an 89% chance of a Fed rate cut at its December 9-10 meeting. Markets are still waiting for September core PCE data, delayed until Friday, a key piece of the inflation puzzle.
Fundamental Outlook: Lower Yields Boost Gold, But Correction Risks Not Over
Given that gold is not yielding, expectations of QE are the central support. However, the combination of weak data, silver volatility and profit-taking pressure suggests that the road ahead for gold will be bumpy.
Macro trends – weak labor, softer USD, and political uncertainty surrounding the Fed Chair – continue to favor price support. But until we break above $4,400/oz with convincing liquidity, the momentum for acceleration will remain at the potential level.
Technical analysis and recommendations OANDA:XAUUSD
Gold is operating in a new bullish cycle: the price remains above the medium-term rising channel, making successive higher lows and closing above the short-term moving averages, indicating active buying.
The important support zone around $4,128–$4,130 (Fibo 0.236) is well defended; if maintained, the short-term bullish structure remains intact.
The RSI has recovered from the neutral zone, implying that the upside momentum is still strong but not overbought. The bullish scenario is complete when the price remains above the short-term MA21, does not break below $3,972–$3,973 (Fibo 0.382) and moves towards challenging the resistance zone of $4,300–$4,380 (channel top/Fibo extension).
Cyclical risk: a break below $3,972 would weaken the structure and could drag the price to a test of $3,846–$3,720.
SELL XAUUSD PRICE 4231 - 4229⚡️
↠↠ Stop Loss 4235
→Take Profit 1 4223
↨
→Take Profit 2 4217
BUY XAUUSD PRICE 4141 - 4143⚡️
↠↠ Stop Loss 4137
→Take Profit 1 4149
↨
→Take Profit 2 4155

Gold Bulls Smash Through the Flag PatternGold has climbed sharply, and after that sudden burst of momentum, the market naturally shifted into a cooling phase, forming a descending flag.
This pullback does not reflect weakness; instead, it represents a controlled pause as the market resets after a strong advance.
Sellers are attempting to push prices lower, yet the decline remains shallow. That limited retracement reveals that buyers are still firmly positioned and ready to defend the trend at every dip.
At this stage, price is breaking out of the flag with clear conviction, signaling that bullish strength is returning to the market. The breakout candle, supported by increasing volume, highlights strong market intent and renewed confidence from buyers.
With momentum building again, the next impulsive move is likely to extend toward the 4,300 target.

Gold — continuing the correctionInitially, we may draw one more small wave up, slightly above 4,350 — but it’s not necessary. Then we will move down into the 3,900 range (slightly lower). After that we’ll see — overall, the outlook points to a deeper correction.

4000 year old money EuphoriaKudos to my good friends that have patiently waited a decade for this ancient money to finally yield great returns. But it's my job here to urge caution and share the lessons of historical finance.
First, let's try to "value" silver historically:
Code of Hammurabi (1750 BC):
Minimum wage for common labor; 8 grains of silver (0.65 g) per day (0.021 oz)
Classical Athens – Periclean period (~450–430 BC):
Unskilled; 1 drachma = ~4.3 g per day (0.138 oz)
Skilled; 1.5–2 drachmae (0.21–0.28 oz)
Roman Republic (Early Empire – Augustus to ~200 AD):
Legionary; 2–2.3 g net per day (0.064–0.074 oz)
Urban unskilled; 3.5 g per day (0.1125 oz)
Roman Empire – Diocletian’s Edict (301 AD):
Farm labor; 0.5-1g per day (0.016-0.032 oz)
Sassanid Persia (~500–600 AD)
1 silver drachm ≈ 4 g per day (0.129 oz)
Medieval England – Statute of Labourers (1351, post-Black Death):
2-3 pence per day; 1 penny = 1.2-1.4g silver (0.077-0.135 oz)
United States – Early Federal period (1790–1800)
Common laborer $0.50–$1.00 per day; U.S. silver dollar = 24.06 g silver (0.39-0.66 oz)
United States – Coinage Act era average wage (1790s–1830s)
Unskilled labor ~$0.75–$1.25 per day (0.58–0.97 oz)
Throughout most of monetary history when silver was actually money, one day of common or semi-skilled labor bought roughly 0.05 to 0.28 troy ounces of silver (with 0.10–0.15 oz being the most common sweet spot in stable empires).
Today (Dec 3, 2025), with silver trading at $57.50/oz, an 8-hour low-skill U.S. wage at $17–$20/hr buys ≈ 2.37–2.78 troy ounces of silver per day — 10–25× higher than almost any pre-1900 historical benchmark.
So one could interpret this historic perspective in two ways:
Silver still has enormous upside to reapproach historical labor norms; An 8-hour U.S. production worker (~$31.50/hr) currently buys ≈ 4.4 troy oz per day — that is 4–7× higher than even the richest silver-standard societies ever paid free citizens, and 200–800× higher than the worst monetary collapses. For today’s wage to buy only the historical average of 0.12 oz/day, silver would need to trade around $2,100/oz.
We no longer pay wages in silver, so the comparison is meaningless; Labor is now paid in fiat, and silver is primarily an industrial/hedge asset. Monetary demand is only a fraction of what it once was, and productivity, technology, and energy inputs have exploded. A direct 1:1 labor peg is never coming back.
Now, let's dive back into the realm of historical analysis that is most relevant.
Much sooner than 4000 years ago (11 actually) silver had a great "yeet" which saw it rise bottom to peak by +493% (the current rise is at 412%). However, the drawdown from the 2011 high was -72%
If we go back half a century ago to 1976-1982 Silver rose +919% only to fall -88%.
The takeaway should not be that the rise in Silver might end here or anywhere. We just don't have enough data but we can infer historical parallels. Volatility is often a gift to investors but in silver, a 4000 year old money, it remains a double edged sword (as it may have been used to buy them back then).
Trade wisely.

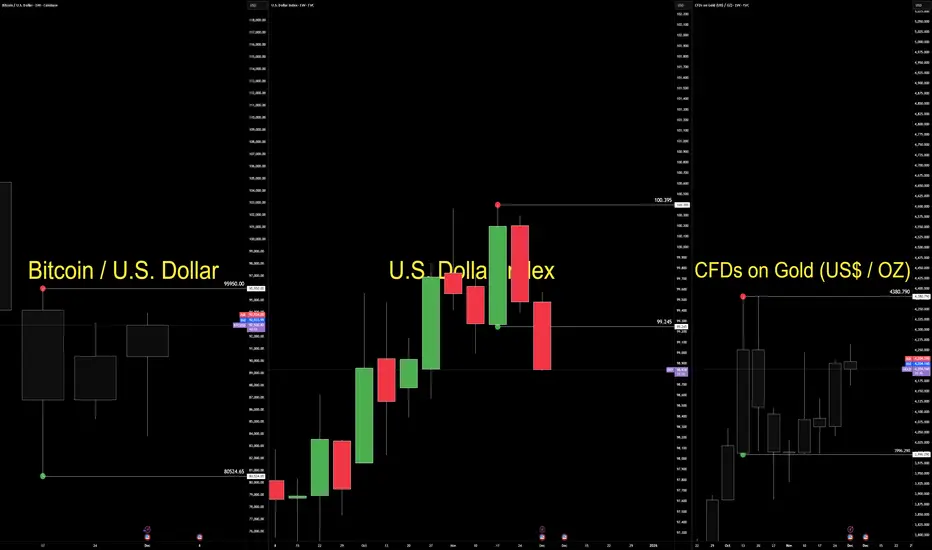
The Dollar Isn’t Falling. It’s Being Repriced.The dollar didn’t weaken because of a single headline.
It weakened because two forces aligned at the same moment—policy certainty and political uncertainty.
Futures now price a full December rate cut.
That removes the dollar’s yield premium and lifts liquidity expectations.
But the bigger shift is political.
Odds have increased that Kevin Hassett could replace Jerome Powell as Fed Chair.
Markets understand the implication: potential pressure on Fed independence.
Currencies respond quickly to credibility risk.
EURUSD strengthened.
Gold firmed.
Bitcoin stabilized despite its bearish structure.
Now the technical side.
The dollar still trades inside a bullish consolidation between 99.245 and 100.395.
Structure is intact, but behaviour has shifted under the surface.
Pressure is building inside the box.
Gold holds a weekly bullish consolidation above 3996.290.
Price is absorbing quietly—typical when investors hedge independence risk.
Bitcoin remains in a weekly bearish consolidation between 95,950 and 80,524.
A rare decoupling from the debasement narrative.
The macro story supports upside, but structure has not yet released.
This environment demands a behaviour-first lens.
Market Structure maps the containment.
Geometry shows the compression.
Volume Flow reveals participation rotation.
Order Flow exposes intent before trend.
Execution depends on pressure validation, not prediction.
Today is not a trend shift.
It is a credibility repricing.
The dollar hasn’t lost structure.
It has lost premium—while gold and crypto absorb the early rotation of capital into assets less dependent on institutional stability.
When policy becomes predictable and leadership becomes political, markets adjust before headlines explain why.
— CORE5DAN
Institutional Logic. Modern Technology. Real Freedom.
XAUUSD: Bearish Drop to 3885?OANDA:XAUUSD is eyeing a bearish reversal on the daily chart , with price testing resistance near ATH levels after recent rebounds from support, converging with cumulative sell liquidation and a potential entry zone that could spark downside momentum if sellers defend the highs. This setup suggests a pullback opportunity amid the ongoing uptrend, targeting lower support levels with strong risk-reward exceeding 1:3.
Entry between 4280–4340 for a short position (entry from current levels with proper risk management is recommended if price reaches the zone). Target at 3885 . Set a stop loss at a close above 4400 , yielding a risk-reward ratio of more than 1:3 . Monitor for confirmation via a bearish candle close below entry with rising volume, leveraging gold's volatility near peaks.🌟
Fundamentally , gold prices are hovering around $4,207–$4,222 per ounce as of December 3, 2025, after a 0.5% daily gain and a 7.37% rise over the past month, driven by safe-haven demand amid geopolitical tensions and expectations of Fed rate cuts. However, forecasts for 2025 suggest potential volatility with upside to new highs like $4,000+ in the longer term, though short-term corrections could emerge due to overbought conditions, central bank policies, and inflation dynamics. 💡
📝 Trade Setup
🎯 Entry (Short):
4280 – 4340
(Entry from current levels is valid if price reaches the zone with strict risk management.)
🎯 Target:
• 3885
❌ Stop Loss:
• Daily close above 4400
⚖️ Risk-to-Reward:
• >1:3 overall
💡 Your view?
Will gold reject this ATH resistance zone for a deeper correction — or break higher into new territory?
👇 Share your thoughts below! 👇

GOLD 4H CHART ROUTE MAP UPDATE & TRADING PLAN FOR THE WEEKHey Everyone,
Please see our 4h chart remaining levels and targets for the coming week with one updated Goldturn.
We are now seeing price play between two weighted levels with a gap above at 4224 and a gap below at 4124. We will need to see ema5 cross and lock on either weighted level to determine the next range.
We will see levels tested side by side until one of the weighted levels break and lock to confirm direction for the next range.
We will keep the above in mind when taking buys from dips. Our updated levels and weighted levels will allow us to track the movement down and then catch bounces up.
We will continue to buy dips using our support levels taking 20 to 40 pips. As stated before each of our level structures give 20 to 40 pip bounces, which is enough for a nice entry and exit. If you back test the levels we shared every week for the past 24 months, you can see how effectively they were used to trade with or against short/mid term swings and trends.
The swing range give bigger bounces then our weighted levels that's the difference between weighted levels and swing ranges.
BULLISH TARGET
4224
EMA5 CROSS AND LOCK ABOVE 4224 WILL OPEN THE FOLLOWING BULLISH TARGET
4328
EMA5 CROSS AND LOCK ABOVE 4328 WILL OPEN THE FOLLOWING BULLISH TARGET
4422
EMA5 CROSS AND LOCK ABOVE 4422 WILL OPEN THE FOLLOWING BULLISH TARGET
4494
BEARISH TARGETS
4124
EMA5 CROSS AND LOCK BELOW 4124 WILL OPEN THE FOLLOWING BEARISH TARGET
4042
EMA5 CROSS AND LOCK BELOW 4042 WILL OPEN THE SWING RANGE
3964
3873
As always, we will keep you all updated with regular updates throughout the week and how we manage the active ideas and setups. Thank you all for your likes, comments and follows, we really appreciate it!
Mr Gold
GoldViewFX

XAUUSD Intraday Plan|Bulls vs. 4232 — Break or Reject?Gold dropped into the Reaction Zone as outlined in yesterday’s analysis and bounced back, currently trading around 4206. Price is sitting between the two moving averages and still below the 4232 resistance, waiting for a fresh catalyst.
For buyers to take price higher, we need a clean break above 4232, which would open the path toward 4274, and if momentum is strong, a possible move toward 4322.
If we see another failed attempt at 4232, price is likely to revisit the Reaction Zone.
If this zone gives way, watch the Support Zone and the HTF Support Zone, where buyers are likely to step back in.
📌Key levels to watch:
Resistance:
4232
4274
4322
Support:
4185
4141
4102
4049
4014
3966
🔎Fundamental focus:
Today brings several high-mid-tier U.S. data releases - all of which may add short bursts of volatility. With major events still ahead later in the week, markets may stay reactive and sensitive to headlines.

GOLD: Bearish Continuation & Short Signal
GOLD
- Classic bearish pattern
- Our team expects retracement
SUGGESTED TRADE:
Swing Trade
Sell GOLD
Entry - 4217.9
Stop - 4226.7
Take - 4201.0
Our Risk - 1%
Start protection of your profits from lower levels
Disclosure: I am part of Trade Nation's Influencer program and receive a monthly fee for using their TradingView charts in my analysis.
❤️ Please, support our work with like & comment! ❤️

GOLD (XAUUSD): Updated Support & Resistance Analysis
Here is my latest support and resistance analysis Gold.
Vertical Structures:
Vertical Support 1: Rising trend line
Horizontal Structures
Support 1: 4164 - 4172 area
Support 2: 4080 - 4132 area
Support 3: 3996 - 4045 area
Support 4: 3869 - 3930 area
Resistance 1: 4230 - 4264 area
Resistance 2: 4359 - 4382 area
Consider these structures for pullback/breakout trading.
❤️Please, support my work with like, thank you!❤️
I am part of Trade Nation's Influencer program and receive a monthly fee for using their TradingView charts in my analysis.

SILVER - The ATH Retest Opportunity!!!🚀Silver has officially broken above its all-time high - a major milestone for the metal. But nothing moves in a straight line, and healthy trends always correct before continuing higher.
📉Price is now on its way to retest the previous ATH zone in red, which aligns perfectly with the rising trendline. This creates a powerful confluence area where buyers have historically stepped back in with strength.
⚔️As Silver taps into this intersection, we will be looking for trend-following longs, expecting the bulls to defend the zone and push toward new highs.
🏹The structure is bullish. The trendline is intact. The level is clean.
Now we wait for the reaction… will the bulls reload here? 🤔
⚠️ Disclaimer: This is not financial advice. Always do your own research and manage risk properly.
📚 Stick to your trading plan regarding entries, risk, and management.
Good luck! 🍀
All Strategies Are Good; If Managed Properly!
~Richard Nasr

Gold 30-Min — Volume Sell Reversal Triggered⚡Base : Hanzo Trading Alpha Algorithm
The algorithm calculates volatility displacement vs liquidity recovery, identifying where probability meets imbalance.
It trades only where precision, volume, and manipulation intersect —only logic.
✈️ Technical Reasons
/ Direction — SHORT / Reversal 4215 Area
☄️Bearish rejection confirmed through sharp candle body.
☄️Lower-high forming beneath resistance supply region.
☄️Volume decreasing confirms exhaustion in price rally.
☄️Sellers regained imbalance with heavy top rejection.
☄️Algorithm detects fading demand and shift to control.
⚙️ Hanzo Alpha Trading Protocol
The Alpha Candle defines the day’s real control zone — the first battle of momentum.
From this origin, the Volume Window reveals where the next precision strike begins.
⚙️ Hanzo Volume Window / Map
Window tracked from 10:30 — mapping true market behavior.
POC alignment exposes institutional bias and breakout potential zones.
⚙️ Hanzo Delta Window / Pulse
Delta window monitors real buying vs. selling power behind each move.
Tracks volume aggression to expose who controls the candle — buyers or sellers.
When Delta aligns with Volume Map, momentum becomes undeniable.
