Is the Yellow Metal Ready to BUST Out?Hold onto your hats, traders!
It's been a very wild ride in the FX_IDC:XAUUSD market, proving that what goes up (to a Double Top 🏔️🏔️) must come down (with a vengeance!). After a decisive rejection at the $4381 peak, Gold took a spectacular 8.64% dive last Tuesday, landing sharply at the $4002 low 📉. Talk about a waterfall! 🌊
But don't count the bulls out yet! Gold showed some backbone, bouncing 3.97% back up to $4161 before settling into a cage match. It's now consolidating in a classic Triangle pattern (a.k.a. Compression) 📐, ranging from the $4002 floor up to the stronger resistance near $4135.
The Great Consolidation: Triangle Tension 😮💨
The key takeaway? That $4000 psychological support is a BEAST. 💪 It survived test after test during the Asia, EU, and US sessions last Tuesday and Wednesday! This resilience allowed Gold to build support: first at the $4065 level (the Fib 0.382) and then down to the $4043 low, followed by rock-solid support near the $4000 zone.
As Friday closed out the week, Gold was still testing the lower $4100 area, pulling back to $4096. So, what’s next for the shiny metal?
That $33 candle Friday, was a direct reaction to the release of the slightly softer-than-expected US September Consumer Price Index (CPI) inflation data.
My Outlook: Patience is Gold, But the FED is Key 🔑
While some market watchers are singing a bearish tune 🐻, I see this as a healthy consolidation phase. Gold has already corrected 50% from its massive move (from $3631 low to the $4381 high). While a deeper correction to the 0.618 Fib at $3918 is possible, I don't see the catalyst right now to push it that far.
My bet? Gold will continue to consolidate in $4050 - $4150 range until the major announcement from the FED 🏦. The sharp reversal from the Double Top might just be the clean-out needed to launch prices higher once the rate cut announcement (or even just the dovish talk of future cuts) takes place! The last inflation data was a mixed bag, which gives the FED room to sound reassuringly dovish.
The FED Announcement is the main event this week. Mark your calendars! 🗓️
🔥 Key Economic Events: Central Bank Super Week! 🔥
This week is absolutely jammed with market-moving events across the globe. Get ready for volatility! 🌪️
Monday, October 27, 2025
8:30 AM ET: USD 🇺🇸 Durable Goods Orders (MoM) (Sep)
10:00 AM ET: USD 🇺🇸 New Home Sales (Sep)
Tuesday, October 28, 2025
10:00 AM ET: USD CB Consumer Confidence (Oct)
Wednesday, October 29, 2025 (The Fed Day) 🏦
All Day: HKD Holiday - Chung Yeung Day
9:45 AM ET: CAD BoC Interest Rate Decision
10:30 AM ET: USD Crude Oil Inventories
2:00 PM ET: USD Fed Interest Rate Decision
2:30 PM ET: USD FOMC Press Conference
10:00 PM ET (Approx.): JPY BoJ Interest Rate Decision
Thursday, October 30, 2025 (ECB and GDP Day)
2:00 AM ET: EUR German GDP (QoQ) (Q3)
4:00 AM ET: EUR German CPI (MoM) (Oct)
8:15 AM ET: EUR Deposit Facility Rate (Oct)
8:15 AM ET: EUR ECB Interest Rate Decision (Oct)
8:30 AM ET: USD GDP (QoQ) (Q3)
8:45 AM ET: EUR ECB Press Conference
9:30 PM ET: CNY Manufacturing PMI (Oct)
Friday, October 31, 2025 (Inflation and Month End)
6:00 AM ET: EUR CPI (YoY) (Oct)
8:30 AM ET: USD Core PCE Price Index (MoM) (Sep)
8:30 AM ET: USD Core PCE Price Index (YoY) (Sep)
9:45 AM ET: USD Chicago PMI (Oct)
-------------------------------------------------------------------------
This is just my personal market idea and not financial advice! 📢 Trading gold and other financial instruments carries risks – only invest what you can afford to lose. Always do your own analysis, use solid risk management, and trade responsibly.
Good luck and safe trading! 🚀📊
Metals

BRIEFING Week #43 : The Value Trade
Here's your weekly update ! Brought to you each weekend with years of track-record history..
Don't forget to hit the like/follow button if you feel like this post deserves it ;)
That's the best way to support me and help pushing this content to other users.
Kindly,
Phil

Gold > Previous Day Highs?Gold looks interesting from $4,100 - could act as a potential bullish pivot point to target previous day highs.
Kind regards,
Aman

Wall Street Weekly Outlook - Week 44 2025 [27.10.- 31.10.2025]Wall Street Weekly Outlook – Week 44, 2025 📊💥
Let’s dive into another exciting trading week! 🚀
Rate decisions, month-end flows, and fresh quarterly earnings are setting the stage for strong market moves.
Sit back, enjoy the overview, and dive into the world of banks, hedge funds, and institutional flows — with exclusive insights into how the pros are positioning right now. 🧠💼📈
Extra Lessons: Strategies, setups, and market psychology — everything you need to know for the week ahead. ⚡️
**S&P500 Performance after FED rate cuts**
**Overview: The most important events of the week**
Have a great start to the trading week!
Meikel

BTC - Liquidity Dynamics leading to new HighsMarket Context
Bitcoin has shown a constructive reaction from the recent lows, printing a clean double bottom structure that suggests short-term demand entering the market. After a previous buy-side liquidity sweep and rejection, price has rebalanced and is now challenging a fair value gap (FVG) that previously served as resistance. This marks a key decision zone where the next directional move will unfold.
Fair Value Gaps & Structure
The FVG overhead has already acted as resistance, capping the first impulsive move from the lows. Should price retrace slightly to take out the remaining sell-side liquidity below the double bottom before re-engaging higher, it would confirm the area as a springboard for a bullish continuation. A clean reclaim and hold above the FVG zone would signal a shift in order flow favoring buyers.
Liquidity Dynamics
The current setup offers both sides of the market clear liquidity targets: sell-side liquidity resting under the double bottom and buy-side liquidity resting above the prior high. Smart money could engineer a sweep of the lower side first to accumulate before expansion, or alternatively, break directly through resistance to trigger a larger bullish leg.
Final Thoughts
The structure reflects a balanced but bullish-leaning scenario — a classic accumulation and breakout setup. A deeper retest to clear out lower liquidity would strengthen the foundation for continuation, while sustained strength above the FVG opens the door for a reaction toward new highs.
If this analysis aligned with your view, drop a like — do you think we clear the lows first, or head straight for a bullish breakout?

GOLD → Retest 4060 within the range. What are the expectations?FX:XAUUSD is forming a correction from the Asian session, with the price testing the important 4060 zone ahead of two key events: US inflation data (CPI) and the results of US-China trade negotiations.
Key factors: US inflation (CPI): Low data will support gold (expectations of two cuts in 2024), but high figures will strengthen the USD and weaken gold (rates for a rate cut in December will decline).
Progress in negotiations between China and the US could weaken gold, while failure would bring back demand for safe havens. US sanctions against Russian oil are supporting oil prices and inflation expectations.
Gold is in wait-and-see mode. Growth is likely with weak CPI or a failure of negotiations. Strong CPI and progress in trade will reinforce the correction. The mood remains cautious ahead of events.
Resistance levels: 4090, 4150, 4163
Support levels: 4060, 4002
The important zone of 4060 - gold is forming a false breakdown. If the bulls hold their defense above this zone, it could trigger growth towards the resistance of the range. Otherwise, we can expect a retest of 4000K, and the reaction should be aggressive...
Best regards, R. Linda!

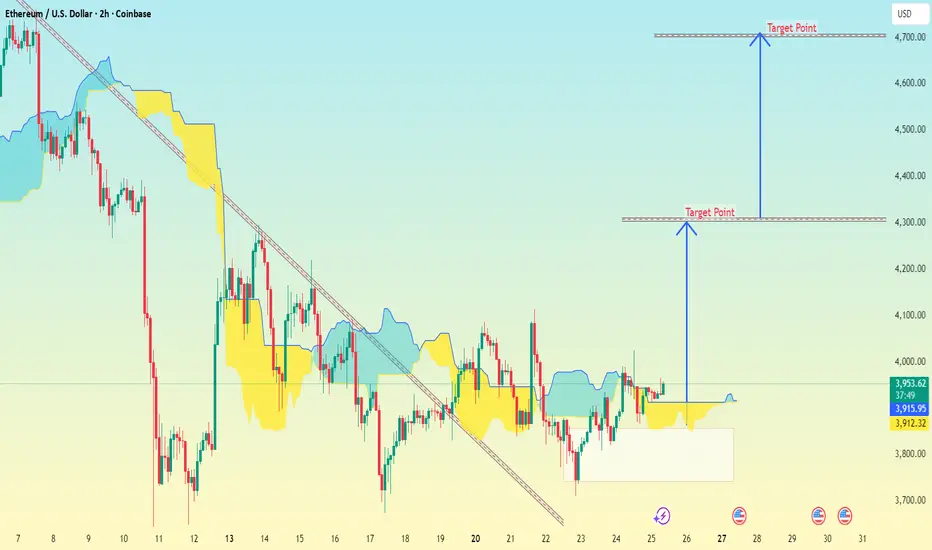
Ethereum (ETH/USD) on the 2-hour timeframe (Coinbase).Ethereum (ETH/USD) on the 2-hour timeframe (Coinbase).
My drawn two downward projection arrows labeled Target Point, showing possible downside continuation.
Here’s what the chart structure indicates:
Price is around $3,975–$4,000.
The structure shows a rising wedge breakdown, typically bearish.
Volume profile (yellow/blue areas) shows strong resistance above current levels.
Based on my arrows and price scale, my chart marks two main downside targets.
🎯 Target Zones
1. First Target Point: Around $4,200 → $4,250
Short-term correction zone, possible support test.
2. Second Target Point (Deeper move): Around $3,750 → $3,800
Major downside target — corresponds to full wedge breakdown measurement.
✅ Summary
Pattern: Rising wedge (bearish)
Current price: ~$3,975
Target 1: ~$4,200 (minor support retest)
Target 2: ~$3,750 (main bearish target)
BTC/USD (Bitcoin vs. USD) chart Pattern..BTC/USD (Bitcoin vs. USD) chart..
Here’s the breakdown of what’s visible:
The wedge is narrowing downward, suggesting price compression.
The breakout projection line (blue arrow) shows an upside target.
Current price (near wedge bottom): around $111,750.
The wedge top resistance area: around $113,500–114,000.
The measured move target (length of the widest part of the wedge projected upward) gives a target zone near $120,000–118,000.
✅ Projected Target Zone:
$12,0000 – $118,000 (USD)
⚙ Confirmation Needed:
Breakout above $113,500 with strong volume.
Retest of breakout zone holding as support.

(NZD/USD ) Chart Pattern..(NZD/USD ) the target point is clearly marked with a blue arrow labeled “Target Point.”
Looking closely:
The my target level appears to be around 0.57900 (approximately 0.5791).
The my chart shows this as an upward projection, so it looks like a bullish target from the current zone (around 0.5748).
✅ Summary:
Pair: NZD/USD
Target: ≈ 0.5790
Direction: Up (bullish move)

4 Best Forex Gold Trading Strategies For Beginners
If you just started trading and looking for a winning strategy to trade, I prepared for you 4 simple and profitable forex trading strategies for beginners.
1. Harmonic Strategy
With that strategy, you will trade harmonic patterns.
Here is the list of the most powerful ones:
Bullish/Bearish Gartley pattern,
Bullish/Bearish Bat pattern,
Bullish/Bearish Cypher pattern.
To properly apply the Harmonic Strategy you should learn just 3 things: Fibonacci numbers, impulse legs and the rules of harmonic patterns.
That strategy is very simple: it works on any time frame and your only task is to recognize the harmonic pattern and trade it strictly following the rules .
2. Trend Following Strategy
That strategy is price action based.
To properly apply that, you should learn trend analysis rules and how to identify price action legs.
Once you spotted that the market is trading in a bullish/bearish trend, your task will be to wait for a completion of a correctional movement to buy/sell t he market expecting a trend continuation.
That strategy works on any time frame, however, my recommendation is to trade 4H time frame or higher.
3. Structure Breakout Strategy
That strategy is based on structure analysis.
To properly apply Breakout Strategy , you should learn to identify key vertical and horizontal structures: supports and resistances.
Your task will be to look for a confirmed structure violation with a candle close beyond that.
Bullish breakout of a key resistance will be a signal for you to buy, expecting a bullish movement to the next resistance, while a bearish breakout of support will push the prices lower to the next structure support.
That strategy works on any time frame, however, my recommendation is to trade 4H time frame or higher.
4. Trend Reversal Strategy
That strategy is price action based.
To use it properly, you should learn trend analysis and trend reversal rules.
Your task will be to look for a confirmed trend reversal . It will lead to an initiate of a new trade and give you a perfect opportunity to catch an extended movement.
What I like about these strategies, is that while you trade with them, you master structure and price action analysis. 2 essential components of any sophisticated professional strategy.
Master one of these strategies and then modify that with experience, adding some extra layers of analysis.
Let me know which strategy do you like the most?
❤️Please, support my work with like, thank you!❤️
I am part of Trade Nation's Influencer program and receive a monthly fee for using their TradingView charts in my analysis.

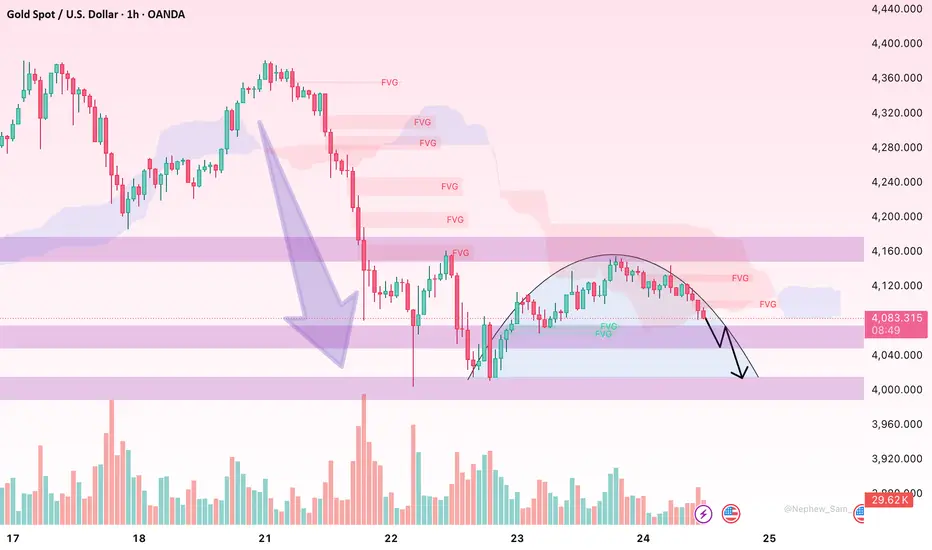
XAUUSD Bearish Outlook – Liquidity Grab Into FVG ZoneThis is my new update for gold. On the 1H timeframe, we can see a double top followed by a change of character (CHOCH) to the downside, confirming bearish intent. I’ve marked two Fair Value Gaps (FVG 1 and FVG 2) as potential retracement zones.
Price has now reached a support level and bounced, forming equal highs (marked with dollar signs), indicating liquidity above. I expect a liquidity grab above these equal highs before a potential drop.
The retracement may reach FVG 1 (~50% Fibonacci) or FVG 2 (~61.8% Fibonacci). From either level, if we see a CHOCH to the downside on the 5M timeframe, that could be a strong sell confirmation, aligning with the 1H bearish structure.
My target is around $3,950, making this a high-probability short setup based on Smart Money Concepts.

XAUUSD Weekly Technical Forecast: Deep Dive AnalysisTraders, gear up for a pivotal week in Gold! As of the close at 4,112.84 on Oct 25th , XAUUSD is at a critical juncture. This analysis blends classic theory with modern indicators for intraday swings and positional trades. Bulls and bears are in a fierce battle ⚔️.
The stage is set for a significant volatility expansion. The key is to identify the dominant auction.
🎯 1D & 4H: The Swing Trade Panorama (Swing Bias)
The higher frames dictate the primary trend. The 1D chart shows a potential completion of an Elliott Wave corrective pattern (ABC) , suggesting a new impulsive wave up may be imminent.
Dow Theory : Higher highs & higher lows remain intact on the 1D, confirming the primary uptrend. ✅
Wyckoff Theory : We appear to be in a 'Spring' or 'Sign of Strength' phase after a re-accumulation period around the 4,080-4,100 zone.
Ichimoku Cloud : Price is trading above the Kumo (cloud) on 1D, a bullish bias. The Tenkan-sen (blue line) is a key dynamic support.
Key S&R : Major support rests at 4,080 (previous resistance, 50 EMA). Resistance is at the recent high of 4,140 .
A decisive 4H close above 4,130 could trigger a Bullish Breakout 🚀 targeting 4,180-4,200. Conversely, a break below 4,080 on high volume could see a drop to 4,040.
⏰ Intraday Focus: 1H, 30M, 15M, 5M (Intraday Bias)
For intraday action, lower timeframes offer precision entries.
Harmonic & Gann Theory : A clear Bullish Bat Pattern has potentially completed on the 1H chart. The PRZ (Potential Reversal Zone) aligns perfectly with the 4,100-4,105 support. Gann's 50% retracement level from the last swing up also converges here.
Bollinger Bands (20,2) : On the 1H/4H, price is hugging the upper band, indicating strong momentum. A squeeze on the 30M chart suggests a volatility expansion is due.
RSI (14) : On the 1H, RSI is in the 55-60 range, showing healthy momentum without being overbought. Watch for bearish divergence on a new high as a reversal signal.
VWAP & EMA Confluence : The 20 and 50 EMAs are providing dynamic support on pullbacks. For day trades, the VWAP on the 15M/5M charts will be your best friend for trend alignment. Long above, short below.
🚦Trade Plan: Entries, Exits & Risk Management
Identifying reversals is key. Use Japanese Candlesticks at key S&R levels. A bullish engulfing or morning star pattern at the 4,100 support, confirmed by a rising volume spike, is a high-probability long signal.
Swing Long Entry : On a 4H close > 4,130, or a pullback to 4,100-4,105 with bullish confirmation.
Swing Short Entry : On a 1D close < 4,080, targeting 4,040.
Intraday Long : Buy on a bounce from VWAP/20 EMA on the 15M chart with RSI > 50.
Intraday Short : Sell on a rejection from the 4,125-4,130 resistance with a bearish RSI divergence.
Stop-Loss : Always 15-20 pips below/above your entry trigger candle.
💡The Bottom Line:
The bullish structure is favored as long as 4,080 holds. The confluence of Harmonic patterns, Wyckoff accumulation, and bullish Ichimoku alignment points to a potential leg higher. However, respect the levels. A break below support will invalidate the bullish thesis.
Track these charts live:
1D:
4H:
1H:
30M:
15M:
5M:
⚠️ Disclaimer: This post is educational content and does not constitute investment advice, financial advice, or trading recommendations. The views expressed here are based on technical analysis and are shared solely for informational purposes. The stock market is subject to risks, including capital loss, and readers should exercise due diligence before investing. We do not take responsibility for decisions made based on this content. Consult a certified financial advisor for personalized guidance.

Dow Theory – A Compass to Help Traders Read Market TrendsHello everyone,
While Fibonacci, Trendlines, or Price Action can help you find precise entry points, nothing is more fundamental and reliable for understanding the market’s overall movement than Dow Theory . This isn’t an obscure or overly academic concept—it’s very practical. In fact, it underpins most of the trend-following strategies that traders use today.
Whether you trade Forex, Gold, Stocks, or Crypto, the core question remains the same: Is the market trending up, trending down, or just in a temporary correction? If you can’t answer this, all other technical analyses become meaningless. That’s why Dow Theory was developed—to serve as a compass, helping traders grasp the trend and make precise decisions.
Applying Dow Theory in Trading
The key to using Dow isn’t memorizing its principles; it’s about reading the real market and turning insights into action. When combined with tools like EMA and MACD , the market picture becomes much clearer: EMA shows the direction and momentum of price, while MACD alerts you to potential reversals.
For example, when prices are rising and EMA is pointing up, a MACD crossover or divergence signals a potential entry along the trend. At the same time, watching price patterns such as Head & Shoulders or Double Top/Bottom helps you anticipate trend reversals, avoiding false moves and short-term traps.
Of course, all these tools only work effectively if you manage your risk carefully , set Stop Loss levels based on price structure, and risk only a small portion of your account per trade. Dow reminds us that a trend continues until there’s a clear reversal signal, so don’t fight the market just because of a few opposing candles.
Once you grasp this principle, reading charts , identifying trends , and trading with the flow of money becomes natural and precise, without guesswork. More importantly, you’ll know when to stay out to preserve capital and when to step in to maximize profits.
That’s why Dow Theory remains a solid foundation for any trader looking to trade with the trend, whether in Forex, Gold, Stocks, or Crypto. So, are you ready to catch the market waves with Dow and capitalize on every swing?
Bullish potential detected for BGLEntry conditions:
(i) higher share price for ASX:BGL along with swing up of indicators such as DMI/RSI.
Depending on risk tolerance, the stop loss for the trade would be:
(i) below the long-term support level of $0.98 (from the open of 7th January), or
(ii) below the rising 30 day moving average (currently $0.94).

Technical Correction – Bullish Structure Remains IntactHello everyone, after a strong rally to new highs, gold (XAU/USD) is entering a necessary corrective phase before deciding its next direction. On the H1 timeframe, price is temporarily consolidating around $4,090 – a key support area where buyers are beginning to show signs of defence.
From a technical perspective, the overall bullish structure remains intact as price continues to form liquidity zones followed by FVG fills. The $4,090–$4,080 zone still acts as the short-term defensive line for buyers. If this area holds, gold may rebound to retest $4,120–$4,130 – a region where selling pressure previously intensified. Ichimoku Cloud remains below price and has yet to signal a bearish reversal, indicating that this move is still a correction rather than distribution.
On the news side, gold continues to receive medium-term support from expectations of a Fed rate cut in December, a cooling US dollar, declining bond yields and lingering geopolitical risks. While US–China trade dialogue may offer temporary signs of easing tension, institutional capital still favours defensive positioning, keeping gold within its broader uptrend.
In the short term, I prioritise the scenario of gold extending its correction to gather liquidity around $4,080–$4,090 before potentially resuming its upside. Only a decisive break below this zone with strong bearish momentum would expose the psychological level at $4,000.
What do you think about gold’s current trend – is this just a healthy pullback or an early warning of a deeper decline?
Gold Eyes 4,010 Support Ahead of CPI – Big Move Loading?Hey Traders,
In tomorrow’s trading session, we’re monitoring XAUUSD for a potential buying opportunity around the 4,010 zone. Gold remains in a broader uptrend and is currently in a correction phase, approaching a key support and resistance confluence around 4,010 that aligns with the ascending trendline.
Market Focus:
All eyes are on tomorrow’s U.S. CPI release, with expectations for headline inflation at 3.0% and core at 3.1%. A softer-than-expected print could weigh on the U.S. Dollar, potentially igniting fresh momentum for GOLD to resume its bullish trend.
Next Move:
Watching price action around 4,010 closely — if CPI data confirms disinflation, we could see a strong rebound toward recent highs as safe-haven demand strengthens.
💬 What’s your take on the CPI? Are you positioning long or waiting for confirmation? Drop your thoughts below!
Trade safe,
Joe

Copper extends gains amid risk on tradeFollowing the weaker US cpi report, risk assets have all rallied and copper is among those. The metal broke out of a triangle continuation pattern yesterday and held above $5.00 key level. With optimism over US-China sending stocks to new records today, copper could follow suit and gain further ground in the days and weeks ahead. Watch out for more upside potential.
By Fawad Razaqzada, market analyst with FOREX.com

GOLD: Short Signal with Entry/SL/TP
GOLD
- Classic bearish setup
- Our team expects bearish continuation
SUGGESTED TRADE:
Swing Trade
Short GOLD
Entry Point - 4129.1
Stop Loss - 4142.0
Take Profit - 4102.9
Our Risk - 1%
Start protection of your profits from lower levels
Disclosure: I am part of Trade Nation's Influencer program and receive a monthly fee for using their TradingView charts in my analysis.
❤️ Please, support our work with like & comment! ❤️

GBP/USD Market Outlook 4 HR TFThe British Pound is currently trading near its 4th August weekly low, a key technical support level that has historically attracted strong buying interest. Price action suggests that the pair may be forming a potential base in this area, with upside targets extending toward the 1.35 level if bullish momentum follows through.
From a technical perspective, the current consolidation near support indicates that buyers may be positioning for a rebound. A sustained move above interim resistance zones—around 1.29, 1.31, and 1.33—would strengthen the bullish outlook and open the path toward 1.35. Confirmation through momentum indicators such as RSI or MACD would further validate this scenario.
On the fundamental side, market sentiment remains closely tied to developments regarding potential UK–US Free Trade Agreement (FTA) discussions. Investors appear to be awaiting official confirmation or commentary from former President Trump concerning trade negotiations. Any positive announcement could provide significant tailwinds for the Pound, while uncertainty or delays may limit upside potential in the near term.
In summary, GBP/USD is positioned at a critical juncture. Technical support aligns with potential fundamental catalysts, suggesting that a confirmed FTA or broader risk-on sentiment could drive the pair higher toward 1.35 in the coming sessions.

GOLD WEEKLY CHART MID/LONG TERM ROUTE MAPHey everyone,
Please check out our updated Weekly Chart Route Map, featuring updated revised key levels after completion of our last long term weekly chart idea for precise level-to-level tracking.
We’ve refreshed our long-term structure on the weekly chart. Price action recently rejected the 4294 level and is now range-bound between 4284 (resistance) and 4059 (support). This consolidation aligns with a detachment from the EMA5, highlighted on the chart with a circle. Even if a full detachment doesn’t materialize, a partial (halfway) correction remains the more probable scenario.
To determine the next directional move, we’ll need a decisive test and break of either boundary level. On the broader horizon, 3006 stands as the long-range pivotal swing zone, which may come into play if a major correction unfolds.
🔹 Note: The key distinction between a retracement range and a swing range is that swing ranges typically produce larger bounces and wider price reactions compared to standard retracement ranges.
We’ll continue to update this outlook throughout the week as the structure develops. Thank you all for your likes, comments and follows, we really appreciate it!
Mr Gold
GoldViewFX

XAUUSD remains stable at high levels, focus on what comes nextHey everyone, Erik here.
XAUUSD has been showing strong momentum lately. After a sharp decline, the market quickly recovered, rebounding powerfully from the lower boundary of the newly projected channel. What initially appeared as weakness was actually a calculated shakeout, trapping sellers before reversing upward with confidence.
This behavior is typical of strong bullish trends. It clears out weak positions, triggers stop losses, and restores balance before the next upward movement. At this stage, the market appears to be entering the early phase of a new bullish impulse.
There might be a short consolidation or a slight correction, but the momentum is clearly pointing toward the upper boundary of the channel. For XAUUSD, the bullish continuation scenario seems far more convincing.
My target is around 4,585, near the upper resistance zone of the projected channel. The overall market structure remains decisively bullish, and the emotional surge during the last drop may become the fuel that powers the next strong rally.

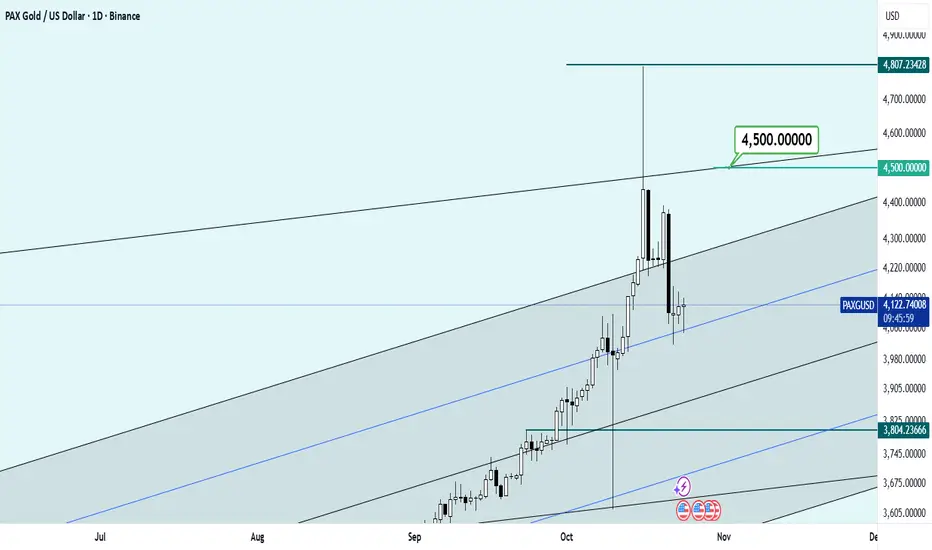
We should test gold with a price target of $4,800!!!This is an empirical test and forward and backtests on the gold chart have confirmed this to some extent, but the timing of the events remains a vague issue. In the end, I must say that I envision a range of $4,800 for the global gold price!
Good luck...
XAU/USD | Gold’s Historic Dump – Will $4,000 Hold or Break?By analyzing the Gold chart on the 2-hour timeframe , we can see that gold experienced an extremely sharp sell-off — the biggest single-day drop in over 12 years — falling nearly $400 in less than 24 hours!
After dropping from $4,381 to $4,003 , price rebounded to $4,162, but then corrected again and is now trading around $4,051.
Given the current volatility, it’s important to watch key levels closely. As long as gold holds above $4,000, there’s potential for a recovery toward the FVG zone between $4,100 and $4,128 .
The main supply levels to monitor are $4,101, $4,114, $4,128, and $4,155 — watch how price reacts at these points!
Please support me with your likes and comments to motivate me to share more analysis with you and share your opinion about the possible trend of this chart with me !
Best Regards , Arman Shaban
