Could we se a reversal from here?Gold (XAU/USD) is reacting off the pivot and could drop to the 1st support which aligns with the 61.8% Fibonacci retracement.
Pivot: 4,263.04
1st Support: 4,097.06
1st Resistance: 4,364.63
Disclaimer:
The opinions given above constitute general market commentary and do not constitute the opinion or advice of IC Markets or any form of personal or investment advice.
Any opinions, news, research, analyses, prices, other information, or links to third-party sites contained on this website are provided on an "as-is" basis, are intended to be informative only, and are not advice, a recommendation, research, a record of our trading prices, an offer of, or solicitation for, a transaction in any financial instrument and thus should not be treated as such. The information provided does not involve any specific investment objectives, financial situation, or needs of any specific person who may receive it. Please be aware that past performance is not a reliable indicator of future performance and/or results. Past performance or forward-looking scenarios based upon the reasonable beliefs of the third-party provider are not a guarantee of future performance. Actual results may differ materially from those anticipated in forward-looking or past performance statements. IC Markets makes no representation or warranty and assumes no liability as to the accuracy or completeness of the information provided, nor any loss arising from any investment based on a recommendation, forecast, or any information supplied by any third party.
Metals

GOLD breaks out of accumulation phaseOANDA:XAUUSD has moved from a consolidation phase to an active bull run: spot is trading around ~$4,200/oz, supported by expectations of Fed easing (markets are pricing in ~89% probability of a 25bp cut in December), central bank buying and a still uncertain geopolitical backdrop. In this context, a $5,000/oz target is no longer a pipe dream but a conceivable scenario, but only if a number of technical and fundamental conditions align.
Analysis (fundamentals — geopolitics)
1. Fundamentals: Central banks’ net buying (WGC: strong net buying), a weaker USD and falling real Treasury yields are the three fundamentals supporting gold. Recent weak US economic data (weak manufacturing PMI, ADP and PCE potentials reinforce cooling sentiment) push the market to price in higher interest rate cuts, reducing the opportunity cost of holding gold.
2. Geopolitics: Russia-Ukraine negotiations remain uncertain; regional tensions (Middle East, US-Venezuela relations…) maintain safe-haven demand. External shocks could spur rapid and strong demand for gold.
Conditions for the $5,000 scenario (necessary & sufficient)
• Necessary: The Fed makes at least one 25 bps cut in the near term (December) or the market is certain of a rate cut cycle; real yields continue to fall; the USD remains weak; the central bank continues to buy net.
• Sufficient: Price breaks the $4,216–$4,226 resistance zone on higher than average volume, accompanied by a sustained decline in real yields (-real basket) and no sharp reversal in the USD. When all three factors (technical break, real yield decline, sustained official demand) are present, the $5,000 target becomes a trackable possibility in the medium-long term.
Risks
Bear case risks include: the Fed unexpectedly takes a hard/clear stance without cutting, the USD strengthens again (e.g. due to better employment data), or market liquidity declines leading to massive profit-taking by funds. These factors could push gold back below $4,000 and break the short-term bullish structure.
In summary, the journey to $5,000 is a structurally plausible scenario: the macro fundamentals and the official demand flow are tilted to the upside, but that scenario will only be triggered by a volume-driven technical breakout combined with a sustained decline in real yields. I maintain a cautiously positive stance, closely monitoring the underlying geopolitical developments and yield developments to assess the sustainability of this rally.
Technical analysis and recommendations OANDA:XAUUSD
Gold price is maintaining a clear bullish structure as it continues to follow the medium-term rising channel and holds the important support zone around 4,128 – 4,130 USD/ounce (Fibo 0.236). The price continuously making higher lows and bouncing back above the short-term MA shows that active buying power is still dominant. The most recent candlestick pattern shows strong absorption at the support zone, implying that money flow is protecting the uptrend.
With no break below 3,973 USD/ounce (Fibo 0.382), the bullish structure continues to be consolidated. The next target of the current cycle is 4,300 – 4,380 USD/ounce, corresponding to the top of the rising channel and the extended Fibo zone. RSI is recovering from the neutral zone, showing that the upside momentum still has room to grow.
SELL XAUUSD PRICE 4277 - 4275⚡️
↠↠ Stop Loss 4281
→Take Profit 1 4269
↨
→Take Profit 2 4263
BUY XAUUSD PRICE 4191 - 4193⚡️
↠↠ Stop Loss 4187
→Take Profit 1 4199
↨
→Take Profit 2 4205

Gold Looks Heavy,Downside Break Loading?📰 What’s happening:
Gold is losing strength because the market thinks rate cuts are not coming soon.
Strong USD = weak gold.
Simple.
📉 What the chart is showing:
Selling pressure is stacking up.
Market structure is leaning bearish.
We’re sitting right on a major support zone: $4,200
⚠️ Why this matters:
If this support cracks, gold could slide fast into the $4,100zone — that’s the next clean liquidity area.
📌 My view:
I’m watching for a break → retest → continuation to the downside.
Buyers look tired. Sellers look hungry.

XAUUSD – Long Bias on the 4H TimeframeXAUUSD continues to show strong bullish momentum on the 4-hour chart, with price action positioning toward the 4,300 level. Recent market liquidity developments, including a reported $13B liquidity injection by the Federal Reserve, have contributed to a softer U.S. dollar, providing additional support for precious metals.
Geopolitical tensions remain elevated, particularly following the recent rejection of a proposed peace agreement in the East, adding to risk-off sentiment and strengthening safe-haven demand for gold.
From a technical perspective, silver has printed new all-time highs, reinforcing bullish sentiment across the metals complex. Gold itself has confirmed a clean breakout and retest, maintaining structure above key support and validating the continuation bias.
Overall, fundamentals and technicals are currently aligned in favor of further upside.

Gold Price Holding Near Range SupportGold is moving sideways near a key support zone after breaking its short-term trendline. If the price stays below the mid-range area, the chart suggests potential pressure toward the lower support zone. This idea highlights important levels without providing any trade signals.

XAU/USD Price Action AnalysisXAU/USD Price Action Analysis – December 3, 2025
Gold Faces Key Resistance With Potential Bearish Retracement
Gold price (XAU/USD) is trading around the 4210–4212 area after reacting strongly to a significant resistance zone. The recent structure shows a clear lower high, followed by a break of the ascending trendline, indicating fading bullish pressure and a potential shift toward short-term downside movement.
If price continues to fail in reclaiming the resistance region near 4218–4220, a corrective move toward the 4148–4152 support zone becomes likely. This level also aligns with previous reaction points, making it a notable zone for buyers to potentially step back in.
Technical Notes
Rejection at major resistance
Lower high formation signals weakening bullish momentum
Trendline break confirms structural shift
Possible price target at 4148–4152 support range
Trading Perspective
Short-term sentiment leans slightly bearish as long as price remains below the resistance zone. Traders may monitor price behavior around the highlighted support area to assess whether buyers defend the zone or if further downside unfolds.
Risk Notice
This analysis is for educational purposes only and not financial advice. Always conduct your own research and apply disciplined risk management.

GOLD → Correction to support amid a bullish trend FX:XAUUSD retreated from the $4,245 level reached on Monday. A countertrend correction is forming ahead of the news. But buyers are not sleeping...
Weak US economic data has heightened expectations of an imminent Fed rate cut. The PMI index in the US manufacturing sector continued to contract. The market estimates the probability of the Fed easing policy next week at 87%.
However, rising US Treasury yields and fears that the Fed may send cautious signals after its December decision are limiting gold's growth.
Market attention is shifting to ADP employment data and the US services business activity index (ISM Services PMI), which will be released on Wednesday. They will provide new signals about the health of the US economy.
The correction in gold appears to be under control amid continuing macroeconomic uncertainty. The 4200, 4193-4173 level remains an important area of struggle between bulls and bears.
Resistance levels: 4211, 4245
Support levels: 4193, 4173
A false breakdown and the bulls holding the market above the above support zone could trigger growth within the trend.
Best regards, R. Linda!

SILVER BEST PLACE TO BUY FROM|LONG
SILVER SIGNAL
Trade Direction: long
Entry Level: 5,701.3
Target Level: 5,814.5
Stop Loss: 5,626.2
RISK PROFILE
Risk level: medium
Suggested risk: 1%
Timeframe: 1h
Disclosure: I am part of Trade Nation's Influencer program and receive a monthly fee for using their TradingView charts in my analysis.
✅LIKE AND COMMENT MY IDEAS✅

XAUUSD–Volume Profile buy scenario around 4,200, target 4,265+XAUUSD–Volume Profile buy scenario around 4,200, target 4,265+
Brian – Prioritize buying with the trend, use VAL to position entry
Market snapshot
At the end of the US session yesterday, gold had a strong increase and then stabilized, currently moving sideways around 4,216 on H1.
The structure is still an uptrend, the current decline is mainly a technical correction within the value area.
On the chart, the 4,264–4,265 area is marked as important resistance, where if broken, the medium-term uptrend could be unleashed more strongly.
Volume Profile & key price areas
The VAL (Value Area Low) of the Volume Profile is currently around 4,200 – this is an area where the market has previously accepted a large volume of trades, suitable for trend-following buys.
A deeper support area is around 4,164 (Supportsides on the chart), where buyers have previously intervened very clearly.
Above: 4,265 – confirmed resistance, if broken will strengthen the scenario of gold heading to higher price areas, matching the "super cycle 5,000 USD" story in the long term.
Trading plan for next week (according to H1 & Volume Profile)
Priority scenario – Buy at VAL with the trend
Buying area: around 4,200 (VAL of Volume Profile).
Can flexibly range 4,198–4,203 depending on spread and market conditions.
Idea: wait for the price to pull back to the VAL area, observe H1 candle reactions (long lower tail, rejection candles...) before entering the order.
Immediate targets:
TP1: area 4,240–4,245
TP2: 4,265 – important resistance marked as "important resistance, confirming medium term increase".
If the price closes clearly above 4,265 and successfully retests, consider holding part of the position or finding additional entry points, according to the scenario of expanding to higher areas in the new cycle.
Defensive scenario – Deep support
If the 4,200 area does not hold, the 4,164 area will be the next support to watch.
Closing H1/D1 below 4,164 will be a signal to reduce short-term expectations and wait for a new structure instead of trying to "buy every dip".
Fundamental context – Reasons gold is still supported
Gold is heading for its best growth year since 1979, with an increase of over 60% in 2025 – this is the context of a true bull market, not just a recovery wave.
YTD performance of XAU outperforms BTC, showing that large capital flows prioritize stability and gold's safe haven role.
Current supporting factors: US bond yields cooling, USD weakening.
Geopolitical tensions escalating, Russia–US negotiations have not brought clear breakthroughs.
The market prices in nearly a 90% chance of the Fed cutting rates at the next meeting, making non-yielding assets like gold more attractive.
Follow Brian to share the Gold scenario together

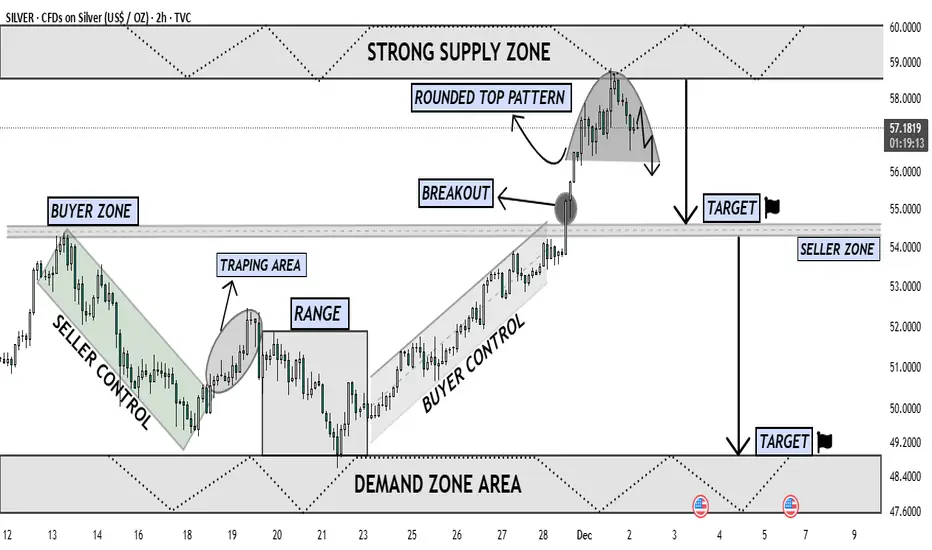
Silver Forming Major Top Near Supply Downside Retracement LikelyThe chart shows Silver reaching a major Strong Supply Zone near the 58–60 level, where price has reacted multiple times in the past. After a strong impulsive rally driven by Buyer Control, the market broke above the previous Buyer Zone, confirming bullish strength. However, once price entered the upper supply region, momentum started to fade, forming a clear Rounded Top Pattern — a classic distribution structure indicating exhaustion of buyers.
Following the breakout retest, buyers failed to continue upward, and sellers stepped in aggressively from the supply zone. The chart now shows a shift from buyer dominance to seller pressure, with price beginning to curve downward inside the rounded top. This shape reflects decreasing highs, weakening demand, and early reversal signals.
The projected move suggests that once the neckline of the rounded top breaks with strong bearish candle confirmation, price is likely to fall toward the first Target Zone around 54, which aligns with the Seller Zone and previous breakout structure. If bearish continuation remains strong, the next logical target lies in the Demand Zone Area between 48–49, where liquidity is expected to support a potential reversal or consolidation.
Overall, this chart indicates a high-probability corrective phase, with sellers preparing to reclaim control as the market rejects the supply zone and transitions into a deeper pullback phase. Buyers must show strong defense at the mid-support; otherwise, Silver could decline further toward the lower demand region.
Gold H1 – Will 4278–4280 Trigger a Drop Into 4170 Today?🟡 XAUUSD – Intraday Smart Money Plan | by Ryan_TitanTrader (01/12)
📈 Market Context
Gold continues its impressive rally as markets price in a potential rate cut by the Federal Reserve (Fed) in December. Spot gold recently surged past $4,230/oz — hitting a multi-week high — as the US Dollar Index (DXY) weakened.
The backdrop is increasingly dovish: fading USD strength, soft U.S. macro data, and dovish comments from Fed officials have fueled speculative buying in gold.
Technically, gold remains elevated, hovering inside a rising channel — similar to what’s shown on your chart. Price compression following strong displacement suggests a consolidation before the next institutional move.
🔎 Technical Framework – Smart Money Structure (H1)
Current state = Accumulation / Distribution within rising channel
Liquidity zones & key triggers
• Premium liquidity zone (sell-opportunity): ~ 4278–4280 (near upper channel resistance) — aligns with your SELL zone.
• Discount liquidity zone (buy-origin / re-entry zone): ~ 4172–4170 (near lower channel support / trendline) — aligns with your BUY zone.
• Equilibrium / chop zone: mid-channel / recent consolidation zone — avoid trading blindly here unless structure breaks.
Expected Smart Money sequence
Sweep → CHoCH/MSS → BOS → Displacement → Retest (FVG/OB) → Expansion
Given the macro tailwinds (weak USD, rate-cut odds), gold remains primed for a directional move once structure confirms.
🎯 Trade Plans for Today
🔴 SELL GOLD 4278 – 4280 | SL 4288
• Thesis: A liquidity sweep at channel top / premium zone followed by engineered bearish displacement — capturing liquidity before a reversal.
• Entry rules (must wait for confirmation):
• Price touches 4280 zone
• Bearish CHoCH / MSS + BOS down on M5–M15
• Entry ideally on FVG fill or after order-block retest post-BOS
• Targets:
1. 4245 – 4240 area (first reaction)
2. 4225 – 4215 (mid-channel retest)
3. 4175 – 4172 (lower channel + buy zone)
🟢 BUY GOLD 4172 – 4170 | SL 4162
• Thesis: Discount-origin tap near lower channel support / trendline — smart money likely to accumulate for next leg up, especially amid dovish Fed sentiment.
• Entry rules (must wait for confirmation):
• Price dips into 4170 zone
• Bullish CHoCH / MSS + BOS up on M5–M15
• Strong bullish wick + FVG fill or OB retest confirmation
• Targets:
1. 4225 – 4230 (first reaction / mid-channel)
2. 4255 – 4265 (upper mid-channel)
3. 4278 – 4280+ (premium liquidity retest)
⚠️ Risk Management & Notes
• Avoid trading inside the mid-channel chop zone without structural confirmation — no “blind” entries.
• Do not treat sweeps (top or bottom) as trend entries — these are often traps.
• Use tight SL (structure invalidation), avoid averaging in consolidation.
• Given potential volatility from macro headlines or a USD bounce, consider reducing lot size.
Summary
Gold is currently riding macro tailwinds — weak USD + Fed rate-cut odds — but from a technical perspective, it’s compressed inside a rising channel. The day’s price action may be a classic Smart Money liquidity hunt: either a sweep at 4278–4280 leading to a sharp drop toward 4170, or a retracement to 4170 that sets up a fresh bull leg.
Only trade after structural confirmation (CHoCH / BOS + retest) — avoid “trend-hop” entries.
📍 Follow @Ryan_TitanTrader for daily Smart Money updates.

Gold 1H – Can 4265 Breakout or Trap Into 4185?🟡 XAUUSD – Intraday Smart Money Plan | by Ryan_TitanTrader (02/12)
📈 Market Context
Gold continues its impressive rally as markets price in a potential rate cut by the Federal Reserve in December. Spot gold recently surged — reflecting multi-week highs — as the US Dollar Index (DXY) weakened. The backdrop is increasingly dovish: fading USD strength and rate-cut odds have kept gold bid.
From a technical perspective, price sits compressed at the channel top, signaling liquidity plays before the next institutional leg. Macro tone from Powell’s opening remarks on ForexFactory adds volatility fuel.
🔎 Technical Framework – Smart Money Structure (H1)
Current state = Accumulation / Distribution within rising channel
Liquidity zones & key triggers
• Premium liquidity zone (sell-opportunity): ~4265–4267 (upper-edge pool of liquidity)
• Discount liquidity zone (buy-origin / re-entry zone): ~4186–4184 (demand liquidity near prior displacement base)
• Equilibrium / chop zone: mid-channel compression → no blind trading unless structure validates direction
Expected Smart Money sequence
Sweep → CHoCH/MSS → BOS → Displacement → FVG/OB Retest → Expansion
Gold remains primed for a directional move only after structure confirms intent.
🎯 Trade Plans for Today
🔴 SELL GOLD 4265 – 4267 | SL 4275
• Thesis: Liquidity sweep above equal highs at premium edge, followed by engineered bearish BOS confirming institutional selling intent.
• Entry rules (must wait for confirmation):
✔ Price pokes 4266 zone → bearish CHoCH/MSS + BOS down (M5–M15)
✔ Entry on FVG fill or OB retest after BOS validation
• Targets:
1. 4245 – 4240 (first reaction)
2. 4225 – 4215 (channel EQ retest)
3. 4186 – 4184 (full delivery into discount)
🟢 BUY GOLD 4186 – 4184 | SL 4176
• Thesis: Discount liquidity tap at institutional base, buy absorption after sweep + bullish BOS signaling new intraday demand.
• Entry rules (must wait for confirmation):
✔ Price sweeps 4185 → bullish CHoCH/MSS + BOS up (M5–M15)
✔ Entry on rejection wick + FVG fill or OB retest confirmation
• Targets:
4. 4215
5. 4240
6. 4265+
⚠️ Risk Management & Notes
• Avoid trading inside mid-range without CHoCH/BOS validation — sweeps are traps until proven by MSS + BOS.
• Use SL for structure invalidation only — no averaging in compression.
• Reduce lot size during Powell’s delivery window; macro impulses can run both sides of liquidity fast.
📍 Summary
Gold is coiling at highs for liquidity. Either Powell triggers a 4266 sweep → bearish BOS → delivery, or price hunts 4185 discount → bullish BOS → continuation.
Trade the structure, not the narrative — wait for CHoCH & BOS + retest to unlock expansion.
📌 Follow @Ryan_TitanTrader for daily Smart Money updates.

Gold Analysis - Breakout Retest and High Probability BuyGold is pulling back toward the breakout zone but still holding above the key support area around 4175-4200. Anyway as long as this level holds the structure remains bullish and price can climb back toward 4245–4250 and a clean break above that opens the way toward the next targets around 4380 and 4460. Only a drop below 4175 would weaken the bullish outlook otherwise still favors continuation to the upside.
Price is still moving above the rising trendline and above multiple bullish structures, which keeps the bigger outlook strongly bullish.
Buy Setup
Buy Zone: 4205-4185 only if price shows support or a bounce
Breakout Buy: 4250 Breakout and Retest
Targets: TP1 4245–4250, TP2 4320, TP3 4380
Note
Please risk management in trading is a Key so use your money accordingly. If you like the idea then please like and boost. Thank you and Good Luck!
Gold Trading Strategy Within a Range.Yesterday, gold experienced wide-ranging fluctuations, resembling a rollercoaster ride with poor trend continuity. On the daily chart, after retracing to test the 7-day moving average support at 4163, it rallied strongly, rising back above the 5-day moving average at 4200. The short-term 4-hour chart continues its oscillating trend, with the price consolidating around the middle Bollinger Band and the RSI indicator hovering near the midline. On the hourly chart, the Bollinger Bands are gradually narrowing, and the moving averages are closely aligned. Gold is expected to continue its wide-range oscillation today. Short-term trading can focus on buying low and selling high, looking for buying opportunities based on the support levels of 4180/4163.
Gold has now entered a oscillating phase, swinging within a large range. This oscillating trend adds more uncertainty to the upcoming unclear news events. This uncertainty makes both bulls and bears hesitant, requiring patience to wait for further developments in market news. Given the short-term oscillation in gold, it's advisable to avoid buying at highs or selling at lows.
Key Levels:
First Support: 4196, Second Support: 4165, Third Support: 4140
First Resistance: 4230, Second Resistance: 4255, Third Resistance: 4278
Gold Intraday Trading Strategy:
BUY: 4170-4175, SL: 4160, TP: 4190-4200;
SELL: 4235-4240, SL: 4250, TP: 4220-4210;
More Analysis →

Gold Moves Sideways Ahead of the FED DecisionGold continues to trade within an extremely tight range, even as the USD Index (DXY) stabilises around 99–100. This signals that pressure from the dollar is no longer as dominant as before, while safe-haven flows quietly circulate beneath the surface—especially as global equities soften and sentiment grows cautious ahead of the FED’s rate announcement this month. Everything now hinges on a single question: will the FED deliver its third rate cut of the year? If so, the USD is likely to weaken, and gold could benefit directly and even aggressively from the shift.
On the 1H timeframe, gold remains sideways between 4,210–4,220 after retracing from 4,245–4,260. Notably, recent selling appears to come primarily from short-term profit-taking rather than genuine reversal pressure. The lower FVG zones at 4,185–4,195 and 4,160–4,170 continue to act as liquidity pockets where price may dip to gather momentum before following the prevailing trend. These areas have provided precise reactions in previous sessions and could again serve as springboards should gold pull back deeper.
If gold holds 4,210 and shows a strong bullish response, a retest of 4,245 becomes highly likely, with a potential breakout above 4,260 toward the broader target near 4,285—the key high from November. Conversely, a clean break below 4,210 opens the path for price to drift naturally into the 4,185–4,195 FVG before buyers step in. In the broader structure, the short-term uptrend remains intact; current pullbacks are functioning as liquidity sweeps rather than structural breaks.
With all of this in mind, my bias stays bullish. The 4,185–4,195 region is where I prefer looking for trend-aligned entries instead of chasing price near the 4,245–4,260 resistance, where sellers repeatedly wait. Should the FED deliver the dovish signal the market expects, gold could easily extend its upward trajectory in the sessions ahead.

POSSIBLE BUY CONTINUATION ON GOLD (XAUUSD) 1HR CHART TFOn the recent IDEA published which happened to be a premature entry whereby the break of sell structure was a fakout or false breakout.
After a thorough market review & post analysis we realised that mini sellers weren't done. They need to do one last more leg down to complete their rally.
This understanding has been supported & the market disclose in confirmation by immediate retracement by buyers aka Big boys making their presence known just after mini sellers completed their final leg.
We should be expecting bullish trend continuation from now till next week as long as our confirmation is met (higher low) then will rally till price target being daily recent high is reached.
EVENTUALLY TRADING
Undefeated!
Follow and stay tuned for live update!
#market #analysis #gold #trend #trade #xauusd #anesuralph #buy #gold #setup #buyers #eventually #trading #daytrader #bullish

XAUUSD: Buys (30m)R:R = 1.72:1
30M Resistance broken with decent room til the next ceiling. We’re in buys. This is not financial advice.

SLV long-term TASilver is going parabolic as well as gold, sure there are many who wonder when is the correction, and yet it's bullish on weekly time frame yes, but there's a negative divergence in the process on daily that started after the recent distribution, which means mid-term will correct eventually and you can't ignore the gap between the price and SMA50 on weekly which is getting huge, so you have to be prepared for the correction in the near future. In general, even after the correction it has plenty of cash flow on weekly trend yet and it will take time to absorb and distribute all the supply and likely the uptrend will continue through 2026.

XAUUSD – Fresh Intraday + Weekly OutlookGold is sitting in a key decision zone right now. After last week’s strong push, the market is correcting but still holding the broader bullish structure. We’re basically in the classic phase where the market tests whether the upside trend is ready to continue or if we’ll get a deeper pullback first.
**Where price stands:**
– Still inside the 4H ascending channel.
– Holding above the main support cluster at **4170–4160**, a zone packed with volume and previous absorption.
– Trading beneath the heavy supply area **4235–4245**, which rejected price last time.
– The current pullback has only reached the 38–50% retracement of the latest rally, which is typical of a healthy correction, not a trend reversal.
**Intraday scenarios I’m watching:**
**1. Bullish rotation back into 4230–4240 (most likely while above 4190–4180)**
Signs to confirm:
– Price holds above VWAP or reclaims it.
– 5m–15m MACD turns up or shows bullish divergence.
– Volume drops on the downside and reappears on the buy side near the mid-Bollinger band.
Targets: **4230 first**, then **4235–4240** where the real test sits.
**2. Deeper correction toward 4175–4160**
Triggers:
– Clean breakdown below 4190 with growing sell volume.
– 15m MACD accelerating below zero.
– Price failing to re-enter the Bollinger mid-band after pushes.
Support zones:
– **4180–4175**
– **4170–4160** (major support / best demand zone)
If buyers defend that region again, it becomes a solid area to look for upside continuation.
**3. Full breakout squeeze above 4240**
Less likely immediately, but possible if USD/yields stay weak. In that case, **4245–4250** comes quickly into play, and a move toward the upper side of the 4H channel could follow.
**For the rest of the week:**
As long as 4160–4170 holds, the higher-timeframe trend stays bullish. The only thing stopping gold right now is the supply layer at 4235–4245. If the market spends several sessions failing there, we could see a wider range forming between 4170–4240. If it breaks with volume, the trend extends.
**What I’m monitoring now:**
– Price reaction vs. VWAP
– Volume behavior at both extremes
– Divergences on 5m–15m
– USD and yields (still the biggest driver this month)
This type of movement — impulse → range → sharp pullback → decision — is extremely typical for gold before choosing its next leg. The structure still slightly favors continuation higher, but the real confirmation will happen around **4235–4245**.

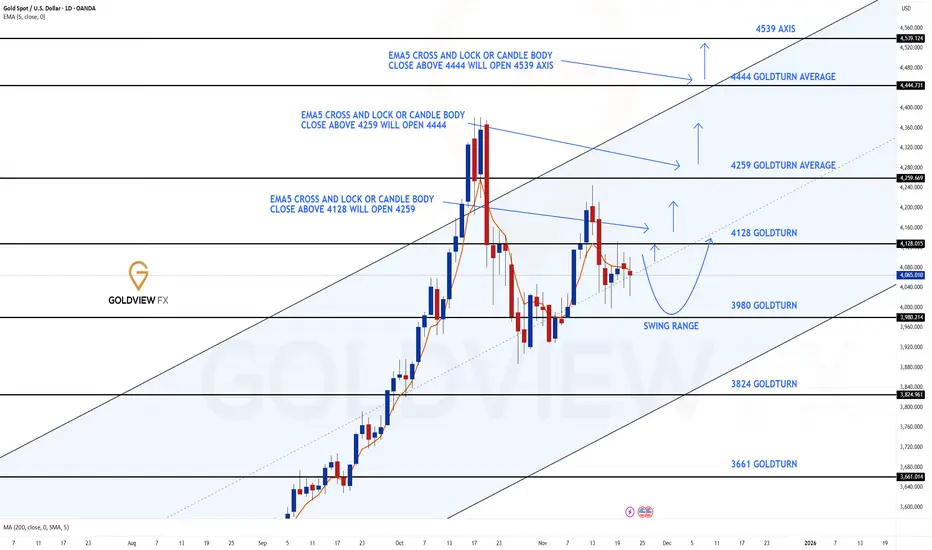
GOLD DAILY CHART ROUTE MAPHey everyone,
Please see our updated Daily chart route map with updated levels.
Price is currently playing between the longer daily chart range 4128 and 3980, with the channel half-line acting as support.
If this support holds, we should see a move toward the 4128 target. A body close or ema5 cross and lock below the half-line would open the swing range for a test and bounce. We're also watching for a break above 41238 to confirm a continuation above.
This is the beauty of our Goldturn channels, which we draw in our unique way, using averages rather than price. This enables us to identify fake-outs and breakouts clearly, as minimal noise in the way our channels are drawn.
We will use our smaller timeframe analysis on the 1H and 4H chart to buy dips from the weighted Goldturns for 30 to 40 pips clean. Ranging markets are perfectly suited for this type of trading, instead of trying to hold longer positions and getting chopped up in the swings up and down in the range.
We will keep the above in mind when taking buys from dips. Our updated levels and weighted levels will allow us to track the movement down and then catch bounces up using our smaller timeframe ideas.
Our long term bias is Bullish and therefore we look forward to drops from rejections, which allows us to continue to use our smaller timeframes to buy dips using our levels and setups.
Buying dips allows us to safely manage any swings rather then chasing the bull from the top.
Thank you all for your likes, comments and follows, we really appreciate it!
Mr Gold
GoldViewFX
GOLD, silver climb as Fed enters decisive phaseOANDA:XAUUSD and OANDA:XAGUSD began December with sharp moves, reflecting the intersection of U.S. monetary policy expectations, weak growth pressure, and rising defensive sentiment across global markets.
Spot gold touched USD 4,264/oz, the highest level in six weeks, while silver surged to USD 58.82/oz, marking a historic record. This price momentum is driven not only by a weakening U.S. dollar and prospects of rate cuts, but also by strategic repositioning among funds ahead of a data-heavy week.
Rate-cut expectations have become the central catalyst, with markets pricing in a near-certain reduction in December. Dovish remarks from Fed officials—from Waller to Williams—together with soft manufacturing data reinforce the argument that growth risks are rising faster than inflation risks. Gold has reacted quickly, especially as the Dollar fell to a two-week low before recovering slightly.
Silver, meanwhile, is following a completely different trajectory. Since the start of the year, silver has risen over 100%, benefiting from both safe-haven demand and industrial demand—particularly from electronics and solar energy. Silver’s high sensitivity to policy expectations, combined with speculation about a more dovish-leaning Fed under potential new leadership, is making it difficult for the market to find equilibrium. The fact that White House economic adviser Kevin Hassett is viewed as a possible Fed Chair nominee further increases downward pressure on the Dollar—an effect silver responds to even more strongly than gold.
At the same time, U.S. PMI manufacturing data continues to show economic fatigue, with the November index falling to 48.2, marking the ninth consecutive month below the 50 threshold. Declining new orders, rising input costs, and increasing import-tariff risks are creating a more challenging policy environment for the Fed. And all of this comes just as markets await a wave of high-impact data: ADP employment, and PCE inflation, the Fed’s preferred metric.
In the bond market, a sharp adjustment took place following comments by BOJ Governor Kazuo Ueda, who hinted at possible rate hikes—rare after decades of ultra-easing. Japanese yields surged, transmitting upward pressure to U.S. bonds: the 10-year Treasury yield jumped to 4.096%, the strongest move since mid-July. Meanwhile, U.S. corporations like Merck returning to the market with large bond issuances (USD 8 billion) forced dealers to sell Treasuries for hedging, amplifying volatility.
Another layer of uncertainty comes from the search for the next Fed Chair, with expectations that the White House will make a decision before Christmas. Traders are closely monitoring this because it directly influences the rate path for 2026. The Dollar just had its worst week in four months, and a dovish appointment could extend the decline.
On the geopolitical front, the White House expressed “cautious optimism” about reaching a resolution to the Russia–Ukraine conflict following discussions with Ukrainian officials in Florida. While these signals slightly reduce systemic risk, they remain insufficient to reverse safe-haven demand for precious metals.
I believe the gold–silver market is entering a high-volatility phase, but the bullish structure remains intact.
Rate-cut expectations, a weaker Dollar, and soft economic data continue to form the three core pillars supporting prices. However, rising bond yields and uncertainty over Fed leadership may interrupt the upward momentum in the short term. Powell’s speech this week will serve as an important guidepost, particularly for Q1 2026 rate expectations.
From a strategic perspective, investors should closely monitor employment data, PCE, and bond-market dynamics. In an environment where the monetary-policy cycle is pivoting, gold remains a portfolio hedge, while silver continues to be the asset most reactive to market sentiment and macro expectations—high return, but also higher risk.
Technical analysis and suggestions to follow OANDA:XAUUSD
The main trend of gold remains structurally bullish. The series of higher lows (HL) and higher highs (HH) is intact, supported by the medium-term rising channel and the 0.236–0.382 Fibonacci retracement cluster is acting as a defensive zone. The price is currently trading around $4,223/oz, above the dynamic MA21 and maintaining the bullish market status.
Main Support Zones
• $4,128 – $4,130 (Fib 0.236): the nearest support zone and the boundary of the uptrend.
• $3,972 (Fib 0.382): stronger support; a break below would open a medium-term correction.
• $3,846 (Fib 0.5): the level that protects the large bullish structure.
Resistance – upside target
• 4,380 – 4,390 USD (Fib extension + upper limit of rising channel): next upside target if price holds above 4,128 USD.
• In case of strong momentum (RSI is recovering from the technical oversold zone), the possibility of price moving up to 4,450 – 4,500 USD is not excluded.
Bearish risk conditions
Correction risk is formed only when:
1. Price closes below 4,128 USD, signaling short-term weakness.
2. Breaks 3,972 USD, the mid-term bullish structure is violated, opening a downside zone to
o 3,846 USD,
o or deeper than 3,720 USD (Fib 0.618).
3. RSI fails to surpass the 50 zone.
If the above 3 conditions occur at the same time, the bullish momentum will temporarily lose its dominance.
SELL XAUUSD PRICE 4329 - 4327⚡️
↠↠ Stop Loss 4333
→Take Profit 1 4321
↨
→Take Profit 2 4315
BUY XAUUSD PRICE 4178 - 4180⚡️
↠↠ Stop Loss 4174
→Take Profit 1 4186
↨
→Take Profit 2 4192

GOLD ANALYSIS 12/02/20251. Fundamental Analysis:
a) Economy:
• USD:
The USD is seeing a mild rebound after a strong decline, mainly technical in nature, with no sufficiently strong data to reverse the trend. This only creates short-term pressure on gold.
• U.S. Stock Market:
U.S. markets are mixed due to concerns over slowing corporate earnings. This cautious sentiment is shifting capital flows toward gold.
• Federal Reserve (FED):
The FED maintains a dovish stance, prioritizing economic stability and considering rate cuts. This continues to support gold.
• Trump Administration:
The Trump administration is taking a tougher stance toward several countries, increasing geopolitical uncertainty and boosting safe-haven demand.
• Gold ETF – SPDR:
SPDR has been buying strongly for two consecutive sessions, reinforcing the medium-term uptrend for gold — a highly important factor.
b) Politics:
Multiple geopolitical hotspots occurring simultaneously:
• Ongoing Middle East conflict
• Intensifying strategic competition in Asia
• Russia–Ukraine tensions unresolved
• Venezuela–U.S. relations becoming a new focal point as the Trump administration takes a tougher stance
→ Overall: Risk-off sentiment rises sharply, benefiting gold.
c) Market Sentiment:
Safe-haven sentiment continues to dominate. Investors are reducing risk, pulling out of equities, and pouring into gold — especially with strong SPDR inflows. Asia is also entering its seasonal year-end gold-buying cycle.
2. Technical Analysis:
• Gold has broken out of a major wedge pattern and is currently retesting the breakout area.
• Price is trading above short-term moving averages, showing a clear bullish trend.
• The market is expected to retest the 4186–4190 zone before pushing higher again.
• Next target zones: 4274 → 4320 → 4380.
• M15 RSI is slightly oversold → suitable for a technical bounce.
RESISTANCE: 4,274 – 4,320 – 4,380
SUPPORT: 4,186 – 4,146 – 4,095
3. Previous Market Session (01/12/25):
• Gold maintained its primary uptrend, with only mild corrections that did not break structure.
• SPDR continued buying → confirms real demand.
• USD’s slight rebound did not significantly affect the overall bullish momentum.
• Gold dropped to the opening price at 4,217 and then surged back up to 4,264.
4. Trading Strategy for Today (02/12/25):
🪙 SELL XAUUSD | 4241 – 4239
SL: 4245
TP1: 4233
TP2: 4227
🪙 BUY XAUUSD | 4178 – 4180
SL: 4174
TP1: 4186
TP2: 4192

BUY SIGNAL Trend trade setupAccording to the 4hr/1hr chart TF: Gold is in a BULLISH MODE
On 1hr chart we encounter a shallow correcting and the mini sellers are done.
BULLS are to resume with the trend.
This is my 1st attempt long.
Will be holding till price reaches the recent high on daily TF or till momentum begin to fade.
Trade is ACTIVE!
Eventually Trading
Undefeated!
#gold #buy #anesuralph #xauusd #daytrader #trendcontinuation #signal
