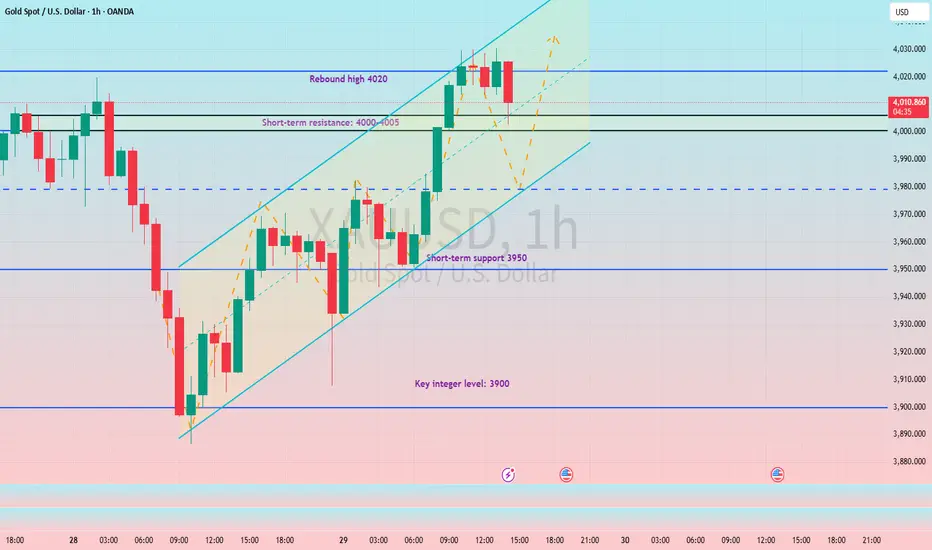
xauusd today 💡 What to watch now:
If price spikes above 4020 and then closes below 4010, that would be a classic manipulation wick, potentially followed by a drop.
If the USDX starts breaking above 99.25, that would confirm the short bias on gold.
I’m not entering yet — it looks promising, but we’re still waiting for a clearer picture. Definitely worth keeping an eye on though!
Metals

XAUUSD H4 | Bullish Rebound from SupportGold (XAU/USD) has bounced off the buy entry at 3,893.61, which is a pullback support that aligns with the 61.8% Fibonacci retracement and could potentially rise from this level to the take profit.
Stop loss is at 3,794.38, whichis a pullback support that aligns with the 78.6% Fibonacci retracement.
Take profit is at 4,060.49, which is an overlap resistance that lines up with the 38.2% Fibonacci retracement.
Stratos Markets Limited (tradu.com ):
CFDs are complex instruments and come with a high risk of losing money rapidly due to leverage. 68% of retail investor accounts lose money when trading CFDs with this provider. You should consider whether you understand how CFDs work and whether you can afford to take the high risk of losing your money.
Stratos Europe Ltd (tradu.com ):
CFDs are complex instruments and come with a high risk of losing money rapidly due to leverage. 70% of retail investor accounts lose money when trading CFDs with this provider. You should consider whether you understand how CFDs work and whether you can afford to take the high risk of losing your money.

Silver - Expecting Bullish Continuation In The Short TermH4 - Strong bullish momentum.
No opposite signs.
Until the two Fibonacci support zones hold I expect the price to move higher further.
If you enjoy this idea, don’t forget to LIKE 👍, FOLLOW ✅, SHARE 🙌, and COMMENT ✍! Drop your thoughts and charts below to keep the discussion going. Your support helps keep this content free and reach more people! 🚀
--------------------------------------------------------------------------------------------------------------------

Potential bearish drop?The Gold (XAU/USD) has rejected off the pivot and could drop to the 1st support, which aligns with the 78.6% Fibonacci retracement.
PivotL 4,016.90
1st Support: 3,791.73
1st Resistance: 4,131.50
Disclaimer:
The above opinions given constitute general market commentary, and do not constitute the opinion or advice of IC Markets or any form of personal or investment advice.
Any opinions, news, research, analyses, prices, other information, or links to third-party sites contained on this website are provided on an "as-is" basis, are intended only to be informative, is not an advice nor a recommendation, nor research, or a record of our trading prices, or an offer of, or solicitation for a transaction in any financial instrument and thus should not be treated as such. The information provided does not involve any specific investment objectives, financial situation and needs of any specific person who may receive it. Please be aware, that past performance is not a reliable indicator of future performance and/or results. Past Performance or Forward-looking scenarios based upon the reasonable beliefs of the third-party provider are not a guarantee of future performance. Actual results may differ materially from those anticipated in forward-looking or past performance statements. IC Markets makes no representation or warranty and assumes no liability as to the accuracy or completeness of the information provided, nor any loss arising from any investment based on a recommendation, forecast or any information supplied by any third-party.

Gold: Trending downwards, 3980 is key.#XAUUSD TVC:GOLD OANDA:XAUUSD
In the short term, gold is still digesting the hawkish impact of Powell's speech, and selling pressure remains heavy.
From a technical perspective, yesterday's daily candlestick closed with a long upper shadow. The 4030 level has proven to be a strong resistance level for gold prices, while the daily MA5 moving average has continued to cross below the MA10 moving average, making 3980-3990 a key short-term resistance level. Only by breaking through this key resistance range can gold prices potentially test higher levels further. Otherwise, the market will remain in a weak and volatile state in the short term.
On the support side, pay close attention to the double bottom support level formed on the hourly chart at 3920-3915.
If this range is breached, gold prices may experience an accelerated decline, further testing 3880 or even 3850.
Therefore, in the short term, European trading can try to short gold with a small position when the price rebounds to 3980-3990. The first target can be 3960-3950, and if the price falls sharply, the next target is 3920-3915.

Gold facing pressure ahead of US - China meetingChina's purchase of its first US soybean cargo this year, ahead of a meeting with the US, signals expectations for a constructive dialogue and a positive outcome on the sidelines of the APEC summit.
Optimism over a potential trade breakthrough may continue to pressure gold prices.
However, the ongoing data blackout leaves the Fed cautious, heightening volatility in the near term.
XAUUSD failed to breach the EMA, but the higher swing low signaled diminishing bearish momentum. If XAUUSD holds above 3900, the price may retest the resistance at 4020.
Conversely, if XAUUSD closes above 4020, the price may retest the next resistance at 4150 and reverse the trend.
By Van Ha Trinh - Financial Market Strategist at Exness.

BTC/USD Timeframe 4H ..🔍 Chart Overview
Pair: BTC/USD
Timeframe: 4H (Bitstamp feed)
Current price: ≈ $110,300
Pattern: Downward channel breakout → retest → bullish continuation expected
Indicators: Ichimoku Cloud showing price above Kumo with bullish bias.
Support zone: around $108,000–$109,000 (highlighted pink zone).
---
⚙ Technical Setup
This looks like a bullish breakout of a descending channel:
Price broke out of the downtrend channel.
It’s currently retesting the upper boundary of that channel (around $109–110k).
If the retest holds, bullish continuation targets are projected based on the height of the channel.
---
📈 Target Calculation (Based on Chart)
The chart marks two “Target Points”:
1. First Target Point: around $120,000
→ This is a near-term target based on the first measured move after breakout.
2. Second Target Point: around $125,000–$126,000
→ This aligns with a full measured move or Fibonacci extension (1.618 zone).
---
🎯 Target Summary
Target Level (approx) Type Notes
Target 1 $120,000 Conservative First major resistance / take-profit zone
Target 2 $125,000–$126,000 Aggressive Full channel projection / secondary target
Support Zone $108,000–$109,000 Retest area Should hold for bullish setup to remain valid
---
🧭 Plan Summary
Bullish bias remains valid as long as BTC stays above $108k–$109k.
Break below $108k could invalidate the breakout and suggest deeper retracement toward $105k.
Upside targets: $120k → $125k
---

USD/JPY 4-hour timeframe..USD/JPY 4-hour timeframe, and you can clearly see my looking at. Let’s analyze it carefully.
---
🔍 Chart Overview
Pair: USD/JPY
Timeframe: 4H
Current price: ≈ 152.97
Structure: Clear Triple Top pattern (1st top, 2nd top, 3rd top)
Neckline / Support zone: Around 151.50–151.70
Indicator: Ichimoku Cloud showing early bearish bias (price retesting near top of Kumo).
---
📉 Pattern Setup
A Triple Top is a bearish reversal signal.
If price breaks below the neckline (≈151.50), the measured move is typically the height of the pattern projected down from the neckline.
---
📏 Measured Move Estimate
Top of pattern: ~153.50
Neckline: ~151.50
Height: ~200 pips
So if price breaks below 151.50, targets are projected 200 pips lower:
---
🎯 Target Points
From what’s marked on my chart:
1. First Target Point: around 149.50–149.70
→ Near-term measured move from the neckline.
2. Second (deeper) Target Point: around 146.80–147.00
→ Extended target if bearish momentum continues (likely based on full height of previous rally leg).
---
⚙ Summary
Level Meaning Zone
152.90–153.50 Resistance (triple top area) Watch for rejection
151.50–151.70 Neckline / key support Break = confirmation
149.50 Target 1 Conservative
146.80–147.00 Target 2 Aggressive

AUD/USD 2-hour chart Pattern..AUD/USD 2-hour chart
---
📊 Chart Overview
Pair: AUD/USD
Timeframe: 2-hour
Current Price: Around 0.6490
Support Zone: Around 0.6460 – 0.6470 (small consolidation area below price)
Indicators: Ichimoku Cloud + Trendline Break
Bias: Bullish correction after a breakout from downtrend line
---
🎯 Target Levels
1. 🎯 Target Point 1 (Short-Term Target):
Price Zone: 0.6530 – 0.6540
This matches my first blue “Target Point” on the chart.
It’s the first major resistance level above the cloud and likely a take-profit zone for early longs.
Expect some price reaction or pullback around this area.
2. 🎯 Target Point 2 (Extended Target):
Price Zone: 0.6600 – 0.6610
This is my second (upper) “Target Point” on the chart.
It aligns with a previous high and represents the completion of a bullish swing projection if momentum continues.
---
🧭 Summary Table
Target Type Price Level Notes
🎯 TP1 0.6530 – 0.6540 First resistance / partial profit zone
🎯 TP2 0.6600 – 0.6610 Extended bullish target (strong resistance area)
🛑 Support / Stop Area 0.6460 – 0.6470 Key support / invalidation zone

GBP/JPY 1-hour timeframe ...GBP/JPY 1-hour timeframe — and based on my setup with Ichimoku and the trendline break:
Current price: around 202.96
The pair has broken below the ascending trendline and the Ichimoku cloud, suggesting a bearish move is expected.
I have two “Target Points” marked below current price.
From what’s visible:
First Target Point: around 202.05 – 202.10
Second Target Point: around 201.20 – 201.30
So my potential targets are:
🎯 Target 1: 202.05 – 202.10
🎯 Target 2: 201.20 – 201.30
This setup aligns with a short continuation pattern after a trendline and cloud break, with likely retest confirmation near the broken trendline (around 203.40).

Gold Could Finally Be Set for a BounceGold is on track for its second week lower, its first such bearish sequence since June. But clues on price action and options positioning suggests upside risks for gold could prevail.
Matt Simpson, Market Analyst at City Index.

XAU/USD – Gold awaits confirmation before the next big moveAfter moving into the new day, the market’s behavior remains within expectations, showing no significant change in the overall structure. On the H1 chart, gold continues to fluctuate around $3,940, facing a clear short-term resistance near $3,990–$4,000 and a higher resistance zone around $4,070–$4,120.
From a technical perspective, the price is attempting a short-term pullback. If buyers manage to hold above the intraday support zone of $3,920–$3,910, a corrective rally toward $4,000–$4,070 could unfold. However, failure to sustain above that area could trigger another leg down, targeting $3,870 and possibly $3,820.
The RSI remains neutral, showing no strong momentum shift yet, while EMA lines suggest bearish pressure remains dominant until a breakout above $4,070 occurs.
This makes the current phase a liquidity-building zone before a decisive move either way.
Key Levels to Watch
Resistance 1: $3,990–$4,000
Resistance 2: $4,070–$4,120
Support 1: $3,920–$3,910
Support 2: $3,870–$3,820
Trading Strategy
Scenario 1 (Bullish): Wait for a confirmed break and retest above $4,000 to aim for $4,070–$4,120.
Scenario 2 (Bearish): If price rejects the $4,000–$4,070 zone, consider short positions toward $3,870 with tight risk control.
Gold traders should remain patient and let price action confirm direction before committing to new entries. Remember, clarity often comes after liquidity sweep — stay disciplined and react to confirmation, not prediction.

GC Futures – Patience While the Market Waits for a CatalystYesterday’s session was pure range — no real direction, likely ahead of Fed news and the Trump-China talks. Price continues to consolidate beneath the H4 FVG and above the Daily Low (D-L), with both sides holding liquidity.
Until we see a clean displacement, I’m sitting on my hands and preserving capital. The market’s indecision is information — it’s telling us to wait.
Key levels remain 4,046 (D-H) and 3,930 (D-L) — any clean break beyond these zones should define the next directional move.
#Gold #Futures #GC #DayTrading #NoFOMO #ICT #OrderFlow #MarketStructure

XAUUSD: The Bullish ABCD Pattern Signals Potential Price SurgeHey everyone, it's Erik!
The price has decreased within the bullish ABCD pattern, a pattern that often indicates that the sellers have exhausted their strength, with their momentum weakening near the bottom.
Recently, the price broke above the upper trendline, signaling that buyers are starting to intervene, shifting the market dynamics in their favor.
If the price stays above this recently broken level, we could see a significant rise. My target is for the price to reach around 4,130, a reasonable level based on the current setup.

Gold peaks once the Fed's cutting cycle is over...As the cutting cycle ends and rates remain relatively low, that is when the gold price tends to peak. This suggests that we are not yet near a gold price top, as the cutting cycle has not been ended by Chairman Powell. With poor economy or jobs data, or via a dovish Trump candidate for Fed Chair next year, rates will drop further. History tells us that once the cutting is over, the gold price will stall.

GOLD Bearish Bias!
HI,Traders !
#GOLD made a bearish
Breakout of the key
Horizontal level of 4189.93
Which is now a resistance
AndAfter retesting that area we
will be expecting
A further move down !
Comment and subscribe to help us grow !

Gold’s Correction Is Exhausting SellersGold is not collapsing. It is cleansing. After an explosive rally that pushed XAUUSD above 4380, the metal has undergone a sharp but orderly retreat to the 3940 zone. This pullback has flushed out weak hands and reset overbought conditions without breaking the core structure of the uptrend. The data across timeframes confirms that buyers are regrouping, not retreating.
On the daily chart, price has found support near the 20-period SMA at 4069, but more importantly, it has held well above the 50-day SMA near 3780. This wide cushion shows the underlying trend remains intact. The RSI has fallen from extreme highs above 90 to neutral territory near 35, eliminating the overbought pressure that threatened a deeper correction. The MACD histogram has turned deeply negative, but this reflects momentum exhaustion, not bearish conviction. Volume has declined on the down moves, signaling lack of aggressive selling.
The 4-hour chart reveals a critical detail. Price recently tested 3886, the low of the last major swing, and bounced sharply. This level now acts as strong technical support. The RSI on this timeframe has bottomed near 18 and is curling upward, while the MACD histogram has flipped positive for the first time in days. These are early signs of accumulation. The current price hovering around 3940 is not a sign of weakness but a consolidation phase where the market digests the prior move.
Weekly structure remains overwhelmingly bullish. Despite the recent drop, the close above 3886 in the prior week preserved the higher low pattern that began in early 2024. The 10-week SMA continues to rise steadily, now near 3776, and price remains well above it. Even the monthly chart shows no reversal signal. The latest monthly candle closed at 3858, still deep within the upper half of its Bollinger Band, and the OBV remains in an uptrend, confirming volume-backed strength.
This setup points to a resumption of the primary uptrend. Short term, gold will likely reclaim 4025 within the next 5 to 10 days as the 4-hour MACD crossover gains traction. Medium term, a retest of 4250 is probable within 4 to 8 weeks, targeting the previous consolidation zone that now acts as support-turned-resistance. Long term, with all major moving averages sloping upward and no structural damage done, gold is on track to challenge 4500 by the end of the first quarter of 2026.
The current dip is a tactical opportunity, not a strategic warning. The trend remains firmly in gold’s favor.

XAU/USD | Gold Setup Before FOMC – Big Move Coming Soon!By analyzing the Gold (XAUUSD) chart on the 2-hour timeframe, we can see that after the previous analysis, gold rose to $3,970 before facing heavy selling pressure that pushed it down to $3,908. Once price entered this demand zone, buyers stepped in again, driving gold back above $4,000.
As we marked on the chart, the $4,015–$4,050 range is a key supply zone, and today the price climbed to $4,030 before pulling back again. Gold is currently trading around $4,005, and if it holds below $4,014, we can expect a deeper decline.
Alternatively, if price breaks above $4,030, gold could aim for higher targets near $4,055 and beyond.
Keep in mind that tonight’s FOMC meeting could bring strong volatility — a rate cut of 25 basis points (to 4%) may cause short-term fluctuations, but a larger cut could trigger a sharp gold rally.
Stay cautious with your trades — I’ll update you after the FOMC results. Happy trading, guys! 💛
THE LATEST ANALYSIS :
Please support me with your likes and comments to motivate me to share more analysis with you and share your opinion about the possible trend of this chart with me !
Best Regards , Arman Shaban

Watch for support at 3990-3980 to consider going long on gold.#XAUUSD TVC:GOLD OANDA:XAUUSD
Gold prices have repeatedly tested the 4030 level without a successful breakout. Gold has now begun to decline, with short-term bears gradually releasing their momentum. Further downside is expected, with support expected in the 3990-3980 range. If gold prices can pull back to this range in the short term, we can consider going long on gold in anticipation of a rebound. Target range: 4030-4050

Gold Daily | The Pause That Defines the BullGold Daily – Support Holds, But the System Still Says Wait
Gold has now completed what looks like a classic 10 percent pullback inside a secular bull market: a move that tests conviction, not trend.
Price found support exactly at the green line, a level that has defined structure since late summer.
From a system perspective, however, the setup remains bearish for now.
MLR < SMA < Price < BB Center, and PSAR still above price, confirming that momentum hasn’t flipped yet.
The interesting part is how this technical pause meets the macro turning point.
The Fed just announced another rate cut, lowering rates by 25 bps and signaling more easing ahead. Historically, rate cuts have had a dual effect on gold.
In early cycles, they boost risk appetite, sometimes pulling capital into equities first.
Later, when easing becomes structural, gold reclaims dominance as real yields compress.
That’s why this zone matters.
Gold is sitting right where both technical exhaustion and monetary easing collide.
A bounce here would fit the larger bull narrative, a rotation from short-term fear back to long-term trust hedging.
A breakdown, on the other hand, would tell us the market’s still digesting the new policy shift.
Either way, this is a recalibration phase, not a top.
Pullbacks like this are the pauses that let bull markets breathe.
Bias Neutral-to-bullish, support confirmed, structure lagging, macro tailwinds building.
Always take profits and manage risk.
Interaction is welcome.

( Gold Protocol ) Bullish & Bearish Reversal DetectedStatus: Active Reversal Protocol
Symbol: Gold
Session: London–New York Overlap (Smart Exit Window)
Bullish Reversal Zone : 3980 : 3962
Bearish Reversal Zone : 4055 : 4070
Bias: Bullish & bearish Reversal
☄️ Volume Surge Confirmed — Sellers dominate exhausted highs
☄️ Session Aligned — Smart money exit window open
☄️ Cluster Shield Active — Supply imbalance verified
☄️ Delta Shift Negative — Buyers trapped above
☄️ POC Retest Completed — Liquidity absorbed at resistance
☄️ Structure Break Pending — Bearish bias confirmed
Goal: Controlled with minimal drawdown
Tactical Edge: Reversal Protocol through liquidity engineering
Confidence Level: ★★★★★ (Smart Money Aligned)
⤵️Every like & comment on our TradingView posts helps us grow. More engagement means more exposure, which benefits everyone in the community!

Second Gold Short AttemptGold has broken out of its wedge pattern and is now forming either a flag or a trend channel. My second attempt today will use a tighter stop level. It’s a risky setup but offers a high risk-reward ratio. I haven’t yet decided whether to take profit at the lower trendline or hold the position to the original target.
