GBPUSD: sales from resistance🛠 Technical Analysis: On the 4-hour timeframe, GBPUSD remains strictly within a descending channel, confirming a strong downtrend. The chart highlights a "Global bearish signal", where Moving Averages have crossed downwards, acting as dynamic resistance that pushes the price lower. Currently, the price is testing a confluence area formed by the upper trendline and the key resistance zone around 1.3150 – 1.3200. The technical setup suggests a rejection from this level, followed by a bearish impulse breaking through the local support at 1.3000 and continuing towards the lower boundary of the channel.
🌍 Fundamental Analysis: The British Pound remains vulnerable due to the divergence in monetary policy expectations between the Bank of England and the Federal Reserve. For the US Dollar, the focus this week is on high-impact data, specifically the US GDP revision and the PCE Price Index (inflation data). If these reports come out stronger than expected, it will reinforce the "higher for longer" narrative for US rates, putting heavy pressure on GBP. Additionally, traders should be cautious of potential volatility or lower liquidity as markets approach the US Thanksgiving holiday.
📉 Trade Parameters (SELL):
Entry Point: Sell around the resistance zone 1.3150 – 1.3180 (watch for rejection candles).
Take Profit: Break of the local support at 1.3000 (the first target). Down to the channel low at 1.2750 (the second target).
Stop Loss: Above the upper resistance block, around 1.3250.
⚠️ Disclaimer: This is a potential trade idea based on current analysis; market conditions and price direction are subject to change based on news factors and volatility.
Metals

NZDUSD: bearish channel rejection🛠 Technical Analysis: On the 4-hour timeframe, NZDUSD is trending strictly within a descending channel and is currently rejecting off the key resistance zone near 0.5700. A "Global bearish signal" is highlighted where the Moving Averages have crossed downwards, confirming strong institutional selling pressure. The technical structure suggests a continuation of the decline toward the channel support at 0.5545, provided the price does not close back above the immediate resistance block.
🌍 Fundamental Analysis: The New Zealand Dollar faces downward pressure as markets position themselves for the US GDP data release scheduled for this week (Nov 26), which is expected to drive significant USD volatility. Investors are favoring the US Dollar due to resilient economic growth expectations compared to the softer outlook for the New Zealand economy. This divergence creates a fundamental backdrop that supports the technical bearish trend, with liquidity likely to focus on further downside.
❗️ Trade Parameters (SELL) ❗️
➡️ Entry Point: Sell on rejection from the Resistance Zone (approx. 0.5690 – 0.5700)
🎯 Take Profit: 0.55445 (Support Zone)
🔴 Stop Loss: Above the resistance structure (0.57371)
⚠️ Disclaimer: This is a potential trade idea based on current analysis; market conditions and price direction are subject to change based on news factors and volatility.

XAUUSD: symmetrical triangle breakdown🛠 Technical Analysis: On the 4-hour timeframe, Gold (XAUUSD) is consolidating within a large symmetrical triangle, indicating a massive volatility squeeze. The price is currently testing the upper boundary but shows signs of rejection, with the projected path pointing to a bearish breakout below the ascending support line. A confirmed close below the triangle structure would validate the bearish momentum, targeting the immediate support zone at 3,913 and potentially extending to the medium-term target of 3,700.
🌍 Fundamental Analysis: Market activity is heavily influenced by the upcoming US Thanksgiving holiday (Thursday, Nov 27), leading to thinning liquidity and potential erratic moves. Traders are bracing for the "pre-holiday data dump" this Wednesday, including Initial Jobless Claims and Durable Goods Orders. Strong US economic data could reinforce the Dollar's strength, further pressuring Gold to break downside before the market close.
❗️ Trade Parameters (SELL) ❗️
➡️ Entry Point: Sell on confirmed breakdown of triangle support (approx. 4,140 – 4,150)
🎯 Take Profit: 3,913, medium-term target at 3,700
🔴 Stop Loss: Above the recent resistance structure (approx. 4,255)
⚠️ Disclaimer: This is a potential trade idea based on current analysis; market conditions and price direction are subject to change based on news factors and volatility.

GOLD (XAUUSD): Bullish Continuation
There is a high probability that Gold will continue rising
after a confirmed breakout of a key intraday/daily resistance cluster.
Expect a move up at least to 4205
❤️Please, support my work with like, thank you!❤️
I am part of Trade Nation's Influencer program and receive a monthly fee for using their TradingView charts in my analysis.

XAUUSD – H1 uptrend channel, short-term downside risk increasingXAUUSD – H1 uptrend channel, short-term downside risk increasing Brian – Prioritize short selling at the channel peak, wait to buy back at lower support
I. Strategy Summary Gold is trading in an uptrend channel on H1, but the rise around 4.160 shows signs of weakening, increasing short-term correction risk.
Preferred Scenario: Short sell at the channel peak 4.162–4.164, targeting support areas 4.145 – 4.130 – 4.115 – 4.100.
After the correction, the 4.100–4.080 area may become the foundation for the next rise in the larger trend.
Important price areas to watch: 4.139 – 4.127 – 4.110 – 4.088.
II. Macro Context & News 27/11
02:00 – Fed releases Beige Book This document updates the Fed branches' assessment of the US economic situation.
Describing slower growth, cooling price pressures will further reinforce expectations that the Fed will soon cut interest rates → supporting gold.
Conversely, if the Beige Book describes the economy as still “resilient,” the market may temporarily slow down pricing in rate cuts → causing a short-term adjustment for gold.
19:30 – ECB releases October meeting minutes
If the minutes lean towards the scenario of keeping high interest rates longer, the EUR may be supported, indirectly affecting the USD and gold inflows.
However, the impact is usually not as strong as US data, mainly affecting the overall risk-on/risk-off sentiment.
General Context: Gold has surpassed 4.160 USD/oz as the market increasingly expects the Fed to cut interest rates as early as December, reducing the appeal of interest-bearing assets and increasing the allure of gold – a non-yielding asset. This creates a support foundation for the medium-term uptrend, but after a hot rise, technical adjustments on H1 are normal.
III. Technical Structure – H1 uptrend channel
The price is within the H1 uptrend channel, with rising peaks and troughs, but the upper area near 4.160 coincides with:
The upper boundary of the price channel. The “Sell POC” area on the chart – where liquidity and sell orders are concentrated.
Preferred scenario on the chart: The price may slightly rebound to the POC area 4.162–4.164, then be rejected and slide to the important support area around 4.110 before extending the adjustment down to 4.100–4.080.
The lower trendline of the uptrend channel also acts as a short-term buy area if a clear candle reaction appears.
Notable price areas on H1: Resistance: 4.162–4.164 (channel peak + POC). Intermediate support: 4.139 – 4.127 – 4.110. Deep support: 4.088 – 4.080 – 4.100 (area that may form the bottom for the next rise).
IV. Trading Plan 1. Preferred Scenario – Short sell at the channel peak Idea: Short sell when the price rebounds to the upper boundary of the H1 uptrend channel and POC 4.162–4.164, expecting a correction to support.
Sell: 4.162–4.164 SL: 4.168 TP targets: TP1: 4.145 TP2: 4.130 TP3: 4.115 TP4: 4.100
This is a counter-move order in the uptrend channel, only targeting a short-term correction, not a major trend reversal scenario.
2. Supplementary Scenario – Short buy at support trendline Idea: When the price hits the lower trendline of the H1 uptrend channel and a nice candle reaction appears, consider a short-term buy according to the channel, prioritizing areas:
4.139 – 4.127 – 4.110 – 4.088
Specific Entry/SL levels will depend on the actual price reaction at the trendline, but the general principle:
Buy close to the trendline,
SL placed below the immediate support area,
TP aimed at the middle of the channel or the nearest resistance.
V. Risk Management & Notes
Do not open new positions right before or at the time of the Beige Book and ECB minutes release, as volatility may suddenly increase, widening spreads.
The sell order at 4.162–4.164 is a short-term counter-trend order in the uptrend channel, requiring moderate volume and strict adherence to SL 4.168.
If the price clearly breaks and holds above the 4.170 area, the H1 correction scenario weakens – in that case, stay out, wait for a new structure instead of trying to maintain a sell view.

Stop!Loss|Market View: EURUSD🙌 Stop!Loss team welcomes you❗️
In this post, we're going to talk about the near-term outlook for the EURUSD currency pair☝️
Potential trade setup:
🔔Entry level: 1.16465
💰TP: 1.15347
⛔️SL: 1.16985
"Market View" - a brief analysis of trading instruments, covering the most important aspects of the FOREX market.
👇 In the comments 👇 you can type the trading instrument you'd like to analyze, and we'll talk about it in our next posts.
💬 Description: The euro price failed to breakout 1.15000, nor even approach it as we expected at the beginning of the week. Today, we're likely to see further short-term growth toward 1.16600, from where selling could again be considered. However, if we're accumulating a short position over the medium term, we could consider conservative selling from current levels. A more global target near 1.14000 remains.
Thanks for your support 🚀
Profits for all ✅

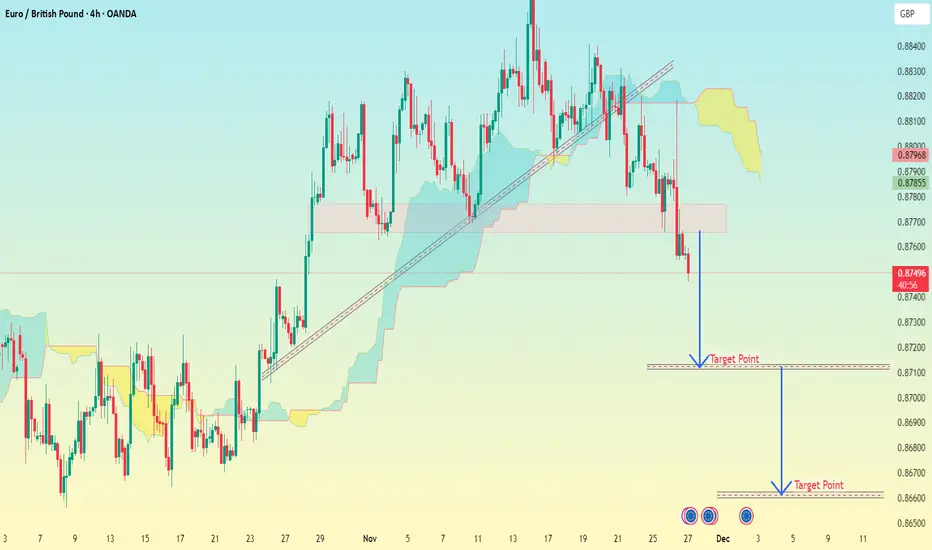
EUR/GBP 4H Chart Pattern.EUR/GBP short targets based on My chart (4H timeframe):
EUR/GBP – Sell Targets
Price right now is near 0.8750 and clearly breaking below support.
✅ Target 1 (Short-Term): 0.8710 – 0.8705
This aligns with my first horizontal marked zone.
✅ Target 2 (Main / Mid-Term): 0.8655 – 0.8645
This matches your second target zone at the bottom.
Bonus Levels (If momentum stays strong):
0.8625
0.8600
Stop-Loss Suggestion
Above broken support zone: 0.8785 – 0.8795
Quick Summary
Trend: Bearish
Bias: Sell on pullbacks
TP1: 0.8710
TP2: 0.8655
BTC/USD (1H Timeframe) ...📌 BTC/USD (1H Timeframe) – Target Analysis
My chart shows:
Price moving above an ascending trendline
Price breaking above the Ichimoku cloud
A clean space above for an upward move
This setup indicates bullish continuation.
---
🎯 BTC Target (Based on my Chart)
✔ Main Target
$91,500 – $92,000
This matches the “Target Point” my marked and is a valid resistance zone based on the chart structure.
---
📈 Why This Target Is Valid
Price is holding above my trendline support
Price has broken out of the cloud, indicating bullish momentum
No major resistance between $87,500 → $91,500
---
📌 Suggested Trade Plan
Entry: Already near breakout zone ($87,000 – $87,600)
Stop-Loss: Below trendline / cloud → $85,800 – $86,200
Take Profit: $91,500 – $92,000

GBP/JPY – 1H Chart Pattern..📊 GBP/JPY – 1H Professional Technical Analysis
MY chart shows:
A long rising trendline
Price recently rejected near 207.00
Price is pulling back toward the trendline
I have already marked two potential “Target Points” on the chart
Ichimoku cloud is forming support but price is weakening
This looks like a potential corrective decline toward structure support.
---
🎯 Targets Based on my Chart & Structure
TARGET 1 — Shallow Pullback (Trendline Re-test)
➤ 205.80 – 206.00
Why:
Matches the first target marked on my chart
Trendline retest + top edge of your highlighted zone
Strong structural support
---
TARGET 2 — Break of Trendline → Deeper Correction
➤ 205.00 – 205.20
Why:
I have this drawn on my chart
This is the first major horizontal support below the trendline
Also aligns with Kijun + prior consolidation base
Good liquidity zone
---
TARGET 3 — Full Breakdown Objective (Major Target)
➤ 203.20 – 203.50
Why:
This matches the lowest "Target Point" my marked
This is the cleanest imbalance + untouched demand zone
If trendline fully breaks and momentum accelerates down
Strong area for institutional liquidity sweep
---
📌 Summary Table
Target Price Zone Reason
Target 1 205.80 – 206.00 Trendline retest
Target 2 205.00 – 205.20 First major support zone
Target 3 203.20 – 203.50 Deep correction / demand zone
---
🛑 Invalidation (Bullish Defend Zone)
If GBP/JPY breaks back above 206.90–207.10, the downside idea weakens and a re-test of highs becomes more likely.

GBP/USD – 4H Chart PatterN..📊 GBP/USD – 4H Professional Technical Breakdown
1. Market Structure
Price has broken a long-term descending trendline.
A clean bullish breakout from a multi-week consolidation zone.
Ichimoku cloud has turned bullish, with price far above the Kumo → strong momentum.
2. Momentum
Current candle expansion shows impulsive bullish orderflow.
No visible resistance until significantly higher → market is in “airspace.”
---
🎯 Professional Target Zones (Educational Technical Levels)
Target 1 – Nearest Logical Upside
➤ 1.3300 – 1.3330 (Short-term liquidity target)
Why?
Minor imbalance fill
Psych level 1.3300
Closest resistance cluster
---
Target 2 – Momentum Continuation
➤ 1.3370 – 1.3400
Why?
Past structural turning point
Round number magnet
Matches previous volume node on 4H
---
Target 3 – Major Resistance Zone (my chart’s “Target Point”)
➤ 1.3450 – 1.3500
Why?
Strong historical resistance
Weekly supply zone
Follows the projection shown in my chart (blue arrow target)
---
Target 4 – Extended Bullish Objective (If momentum remains extremely strong)
➤ 1.3600 – 1.3650 (Advanced target)
Why?
Weekly imbalance above
Completion of breakout structure
Expanding Ichimoku projection supports this distance
---
🛑 Invalidation / Risk Levels
These help understand where the upside idea weakens:
Key invalidation zone (support)
➤ 1.3180 – 1.3200
Re-entry into the old consolidation box would weaken the bullish continuation idea.
📌 Summary (Professional Format)
Level Type Notes
1.3300–1.3330 Target 1 First liquidity zone
1.3370–1.3400 Target 2 Momentum continuation
1.3450–1.3500 Target 3 (Major) Matches my chart target
1.3600–1.3650 Extended Target Only if trend continues
1.3180–1.3200 Invalidation Break below = weakens bullish bias

Gold prices traded in a narrow range today.Gold maintained its consolidation pattern, with the New York market rebounding after testing lower levels. On the daily chart, the closing price in New York has remained above the 10-day, 7-day, and 5-day moving averages for three consecutive trading days, with the price hovering around the upper Bollinger Band. The RSI indicator is above the midline. Short-term 4-hour and 1-hour charts show an upward trend, with the price moving along the upper Bollinger Band. However, the converging moving averages haven't yet led to increased volume or a sustained breakout. With the US market closed early today for Thanksgiving, the market is expected to continue its consolidation.
Overall, the market remains slightly bullish. On the weekly chart, the price has found solid support at the 10-day moving average. The daily chart also shows a tendency to form a triangle pattern, with short-term resistance around 4180-85. Also note that the US market is closed early today for Thanksgiving, so market activity will not be very high!
Key levels:
First support level: 4153, Second support level: 4140, Third support level: 4132
First resistance level: 4180, Second resistance level: 4196, Third resistance level: 4208
Gold intraday trading strategy:
Buy: 4140-4145, SL: 4130, TP: 4160-4170;
Sell: 4195-4200, SL: 4210, TP: 4180-4170;

Gold Is Preparing for Its Next Major BreakoutHello everyone,
Looking at the chart — and combining it with how fast macro signals are shifting — gold feels like a machine that’s just been recharged. In only two sessions, the price surged more than 120 USD even while the US Dollar Index stayed above 100. That’s a very clear sign that capital is choosing gold before the Fed makes any move.
The market is now pricing in nearly an 83% chance that the Fed will cut rates by 0.25% on 10 December. This is no longer a vague expectation. Fed officials like Waller and Williams have softened their tone, signalling willingness to support cuts if the data doesn’t run too hot. When expected interest rates fall, gold essentially steps onto a “fast lane”: lower holding costs and stronger inflows from both defensive and speculative money.
That’s why I’m leaning toward one scenario: gold continues to rise. If the price pulls back to 4,140–4,130 or even 4,120, I see these moves as healthy retracements — not signs of reversal. Once buying pressure returns, I expect gold to break above 4,160, move toward 4,200, and potentially expand into the 4,230–4,250 USD/oz region.
What about you? Are you waiting for a pullback or planning to trade the breakout?

GOLD/ SILVER RATIO - Quarterly FlagBeautiful looking quarterly flag present on the gold silver ratio, should this break down, which would be likely to play out over the next 12-18 months (at most) then expect much higher silver prices.
I would expect to see the ratio hit between 50-30 should this flag pattern materialize.

GOLD Free Signal! Buy!
Hello,Traders!
GOLD has reacted from the horizontal demand after sweeping sell-side liquidity, suggesting early accumulation. If bullish intent holds, SMC order-flow favors a move toward the next buy-side liquidity above.
--------------------
Stop Loss: 4,134$
Take Profit: 4,202$
Entry Level: 4,161$
Time Frame: 3H
--------------------
Buy!
Comment and subscribe to help us grow!
Check out other forecasts below too!
Disclosure: I am part of Trade Nation's Influencer program and receive a monthly fee for using their TradingView charts in my analysis.

Gold Market at turning point | target inside The Gold is running in the bullish trend, it can change the direction into the bearish when the price touch 4189 to 4211, then the price can fall till 4157.
If price breaks 4223, it can fly till 4247, if the price respects 4189 to 4211, it can give us more pips and we can see a big drop.
What's your idea about it.

XAGUSD H1 | Bullish Bounce Off Key SupportMomentum: Bullish
Price is currently above the ichimoku cloud.
Buy entry: 50,608
- Strong pullback support
- 50% Fib retracement
- 100% Fib projection
- Fair Value Gap
Stop Loss: 49.634
- Swing low support
Take Profit: 51.631
- Multi-swing high resistance
High Risk Investment Warning
Stratos Markets Limited (tradu.com/uk ), Stratos Europe Ltd (tradu.com/eu ):
CFDs are complex instruments and come with a high risk of losing money rapidly due to leverage. 70% of retail investor accounts lose money when trading CFDs with this provider. You should consider whether you understand how CFDs work and whether you can afford to take the high risk of losing your money.
Stratos Global LLC (tradu.com/en ): Losses can exceed deposits.
Please be advised that the information presented on TradingView is provided to Tradu (‘Company’, ‘we’) by a third-party provider (‘TFA Global Pte Ltd’). Please be reminded that you are solely responsible for the trading decisions on your account. Any information and/or content is intended entirely for research, educational and informational purposes only and does not constitute investment or consultation advice or investment strategy. The information is not tailored to the investment needs of any specific person and therefore does not involve a consideration of any of the investment objectives, financial situation or needs of any viewer that may receive it. Past performance is not a reliable indicator of future results. Actual results may differ materially from those anticipated in forward-looking or past performance statements. We assume no liability as to the accuracy or completeness of any of the information and/or content provided herein and the Company cannot be held responsible for any omission, mistake nor for any loss or damage including without limitation to any loss of profit which may arise from reliance on any information supplied by TFA Global Pte Ltd.

ANFIBO XAUUSD – Elliott Wave Pullback or Continuation? [11.26]Gold XAUUSD – Elliott Wave Pullback or Continuation?
Hi guys, Anfibo’s here!
XAUUSD Short-Term Trading Plan
Overall Picture
On H1, gold is still trading inside a rising channel, but price has just completed a potential 5-wave impulsive leg into the upper boundary of the structure. From here, we’ve got short-term bearish confirmation around the 4147 area, suggesting that price may be entering an ABC corrective phase within the channel.
In other words:
Bigger picture: structure remains bullish as long as the channel holds.
Short term: I’m prepared for a corrective drop before the next directional leg.
On the macro side, fresh data show the U.S. is burning around 22B USD per day, with October spending at 688.7B vs 404B in tax revenue. The first month of fiscal year 2026 already printed a record 284.4B deficit, and interest payments alone reached 1.24T over the last 12 months – about 24 cents of every tax dollar going just to service debt.
This kind of fiscal pressure is structurally supportive for gold in the long run, but it doesn’t prevent short-term pullbacks inside the current channel.
Trading Plan – Playing the ABC Correction
I’m focusing on two key zones derived from the Elliott structure:
one for tactical sells from premium prices, and one for buys at the end of the correction.
>>> Scenario #1 – Tactical SELL from the Upper Zone (Short-Term Bearish)
If price retests the short-term bearish confirmation area and fills the upper liquidity zone, I’ll look for sell setups:
Sell entry: 4150 – 4152
Stop loss: 4158
Take profit levels: 4140 – 4133 – 4110 – 4088
Idea: fade the final push into the upper boundary / FVG area, targeting completion of wave A–B–C towards the mid and lower parts of the channel. This is a short-term play against the local high, not a long-term bearish view on gold.
>>> Scenario #2 – BUY the End of Wave C (Continuation with Trend)
If the ABC correction extends into the lower part of the short-term structure and shows bullish reaction, I’ll switch to a buy-the-dip plan:
Buy entry: 4130 – 4133
Stop loss: 4125
Take profit: 4145 – 4160
Idea: buy near the potential end of wave C, in confluence with channel support, for a continuation back toward the upper boundary and possibly a new impulsive leg.
Risk Management
Trade only when price respects one of the planned zones – no chasing in the middle of the range.
Always wait for clear confirmation (rejection wick, market structure shift, or strong reaction) before entering.
Keep risk per trade controlled and aim for Risk:Reward ≥ 1:2.
Do not hold both scenarios in opposite directions at the same time – choose the plan that the market confirms.
If price invalidates the structure (strong break beyond SL without reaction), step aside and reassess the wave count.
Conclusion
Gold is likely moving into an Elliott ABC correction phase inside a still-bullish channel. That gives us room for a tactical short from premium levels and a high-probability dip buy if price completes wave C lower. With macro debt and deficit pressures quietly supporting the long-term bullish case, this week is all about executing clean setups inside structure, not forcing trades.
STAY PATIENT, FOLLOW YOUR PLAN, AND TRADE WITH DISCIPLINE, GUYS! 💛📈

Gold H1 – Liquidity Plays as Hassett Leads Fed Chair Race🟡 XAUUSD – Intraday Smart Money Plan | by Ryan_TitanTrader (26/11)
📈 Market Context
Gold opens the week reacting to fresh political headlines as Kevin Hassett emerges as the frontrunner for Trump’s next Fed Chair.
This matters for gold because:
• A hawkish-leaning Fed Chair pick typically strengthens USD and weighs on gold.
• Markets may price in tighter policy expectations, increasing short-term bearish pressure.
• Political volatility ahead of the official announcement often triggers liquidity grabs on both sides.
With sentiment shifting toward a stronger USD, gold is positioned for classic SMC-style sweeps around key premium and discount zones.
🔎 Technical Analysis (1H – Smart Money Structure)
• Market Structure
Price has tapped into a minor premium zone and is showing early rejection signs.
Below, the 4140–4138 area aligns with intraday demand and the origin of recent displacement.
• Premium Sell Zone (1H Supply)
4210 – 4212
• Sits above current buy-side liquidity
• Clear premium relative to intraday structure
• High-probability sweep zone before any downside displacement
• SL region: 4220 liquidity pocket
• Discount Buy Zone (1H Demand)
4140 – 4138
• Previous CHoCH origin
• Aligns with discount retracement
• Confluence with unmitigated internal demand block
• SL region: 4130 sell-side liquidity
• Liquidity Map
• Buy-side: 4212 → 4220
• Sell-side: 4138 → 4130
Expect the typical SMC sequence:
Sweep → CHoCH → Displacement → Retest → Expansion.
🔴 Sell Setup – Premium Reaction
Entry: 4210 – 4212
Stop-Loss: 4220
Take-Profit:
→ 4160 (reaction level)
→ 4145 (mid-range liquidity)
→ 4140–4138 (discount zone retest)
📌 Only activate after a liquidity sweep + bearish CHoCH on M5–M15.
🟢 Buy Setup – Discount Reaction
Entry: 4140 – 4138
Stop-Loss: 4130
Take-Profit:
→ 4160 (intraday reaction)
→ 4185 (premium edge)
→ 4210 (liquidity sweep target)
📌 Valid only after sell-side sweep + bullish CHoCH.
⚠️ Risk Management Notes
• Headlines around the Fed Chair nomination may create sudden USD strength spikes—wait for structure shifts.
• Avoid trading inside the chop zone 4150–4180 without clear displacement.
• Treat today as a liquidity-driven session, not a directional trend day.
📝 Summary
Gold is rotating between premium and discount zones as markets digest news of Kevin Hassett leading the Fed Chair race, a development that could tilt expectations toward firmer policy.
Institutional players are likely to hunt liquidity above 4210 or below 4140 before committing to direction.
Key Levels Today (26/11)
🔴 Sell Zone: 4210–4212
🟢 Buy Zone: 4140–4138
Prepare for:
Accumulation → Sweep → Displacement → Retest → Target.
📍 Follow @Ryan_TitanTrader for daily Smart Money updates.

Gold (XAUUSD) 15m entry setupGold (XAUUSD) 15m entry setup. Price just confirmed a nice setup in 15m timeframe.
Cheers

GOLD Buyers In Panic! SELL!
My dear friends,
Please, find my technical outlook for GOLD below:
The instrument tests an important psychological level 4150.7
Bias - Bearish
Technical Indicators: Supper Trend gives a precise Bearish signal, while Pivot Point HL predicts price changes and potential reversals in the market.
Target - 4134.3
Recommended Stop Loss - 4160.3
About Used Indicators:
Super-trend indicator is more useful in trending markets where there are clear uptrends and downtrends in price.
Disclosure: I am part of Trade Nation's Influencer program and receive a monthly fee for using their TradingView charts in my analysis.
———————————
WISH YOU ALL LUCK

Market outlook and investment strategy: I am bullish.#XAUUSD TVC:GOLD OANDA:XAUUSD
Judging from the structural trend and the performance of gold in different timeframes, gold has formed a short-term double bottom structure based on the trend line, and the prototype of the W pattern is gradually emerging.
Although the price retreated slightly after touching the channel resistance level around 4160 in the evening, it did not break the current upward structure, and the market is still dominated by bulls. Meanwhile, influenced by multiple positive factors such as geopolitical uncertainties and rising market speculation about a December rate cut, gold still has the potential for further gains.
Therefore, based on the current trend structure and fundamental logic, in the future trading process, we can first pay attention to the short-term resistance of 4170-4180, which is a key resistance under the triangle consolidation pattern. When it first touches this level, we can try to short gold with a small position and set the stop loss above 4185 to prevent the risk of a strong bullish breakout.
Meanwhile, if this strategy is effective, we need to pay attention to the subsequent rebound after the gold price falls back and stabilizes, which will help confirm the completion of the W pattern. At that time, we will focus on the breakout of the neckline at 4200-4205. If it can stabilize above this level, the upside potential will be further opened up, and it may extend to 4240-4245, or even higher!
In summary, our trading strategy must closely follow the confirmation signals of the trend structure. Therefore, it is essential to strictly control position size and stop-loss. We will continue to monitor market dynamics and optimize our trading strategy accordingly.

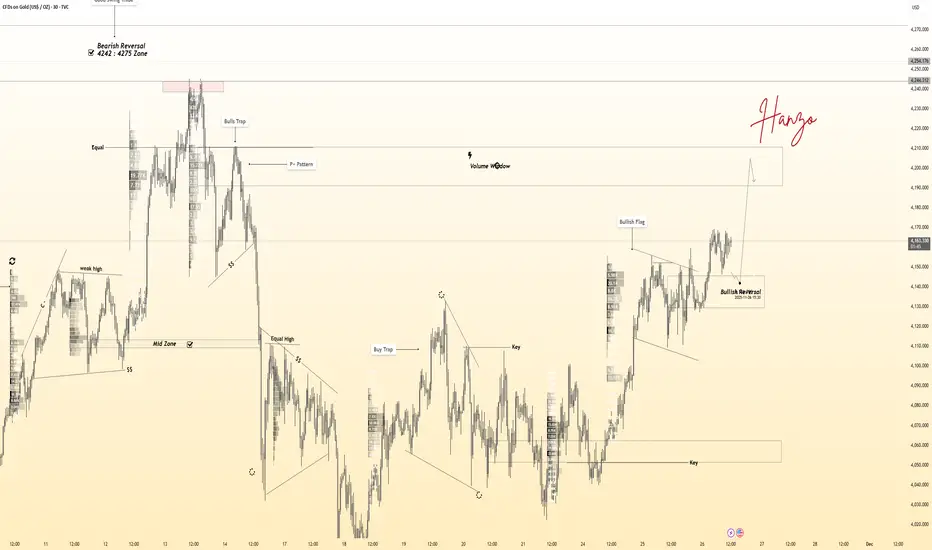
Gold 30-Min — Volume Buy Reversal Triggered⚡Base : Hanzo Trading Alpha Algorithm
The algorithm calculates volatility displacement vs liquidity recovery, identifying where probability meets imbalance.
It trades only where precision, volume, and manipulation intersect —only logic.
Technical Reasons
/ Direction — LONG / Reversal 4147 Area
☄️Bullish momentum confirmed through strong candle body.
☄️Structure shifted with higher-low near key demand base.
☄️Volume expanding confirms order-flow alignment upward.
☄️Buyers reclaimed imbalance with sustained clean break.
☄️Algorithm detects rising momentum under low liquidity.
⚙️ Hanzo Alpha Trading Protocol
The Alpha Candle defines the day’s real control zone — the first battle of momentum.
From this origin, the Volume Window reveals where the next precision strike begins.
⚙️ Hanzo Volume Window / Map
Window tracked from 10:30 — mapping true market behavior.
POC alignment exposes institutional bias and breakout potential zones.
⚙️ Hanzo Delta Window / Pulse
Delta window monitors real buying vs. selling power behind each move.
Tracks volume aggression to expose who controls the candle — buyers or sellers.
When Delta aligns with Volume Map, momentum becomes undeniable.
Gold Price Poised for Breakout as Bullish Channel StrengthensHi!
Market Structure Overview
Price is moving within a clearly defined ascending channel, forming higher highs and higher lows. The recent pullback corrected only about 35% of the previous bullish leg, indicating that buyers are still in control and momentum remains positive.
Key Support Zone (Green Area 4,150–4,175)
This zone represents a former supply that has now flipped into a potential demand area. Price is currently pushing into it from below, and the reaction here will determine the next major move. A clean break and hold above this zone would signal strength and open the path toward higher targets.
Breakout Scenario
If price breaks above the green resistance block, the chart suggests a bullish continuation toward the major supply zone highlighted in red (4,220). The drawn arrow implies that momentum could accelerate once the breakout confirms, aligning with the channel’s upper boundary.
Upside Target (Red Zone 4,220)
This red area represents a strong supply where sellers previously stepped in aggressively. Should price reach this level again, some form of reaction or correction is likely.
Downside Risk
If the breakout fails and price rejects the green zone, a retracement back toward the mid-channel dashed line or even the lower channel boundary would be the next logical move.
Disclaimer: As part of ThinkMarkets’ Influencer Program, I am sponsored to share and publish their charts in my analysis.
