Gold retest of the pivotal 4010 levelThe Gold remains in a bullish trend, with recent price action showing signs of a corrective pullback within the broader uptrend.
Support Zone: 4010 – a key level from previous consolidation. Price is currently testing or approaching this level.
A bullish rebound from 4010 would confirm ongoing upside momentum, with potential targets at:
4215 – initial resistance
4270 – psychological and structural level
4315 – extended resistance on the longer-term chart
Bearish Scenario:
A confirmed break and daily close below 4010 would weaken the bullish outlook and suggest deeper downside risk toward:
3985 – minor support
3955– stronger support and potential demand zone
Outlook:
A bullish bias remains intact while the Gold holds above 4010. A sustained break below this level could shift momentum to the downside in the short term.
This communication is for informational purposes only and should not be viewed as any form of recommendation as to a particular course of action or as investment advice. It is not intended as an offer or solicitation for the purchase or sale of any financial instrument or as an official confirmation of any transaction. Opinions, estimates and assumptions expressed herein are made as of the date of this communication and are subject to change without notice. This communication has been prepared based upon information, including market prices, data and other information, believed to be reliable; however, Trade Nation does not warrant its completeness or accuracy. All market prices and market data contained in or attached to this communication are indicative and subject to change without notice.
Metals

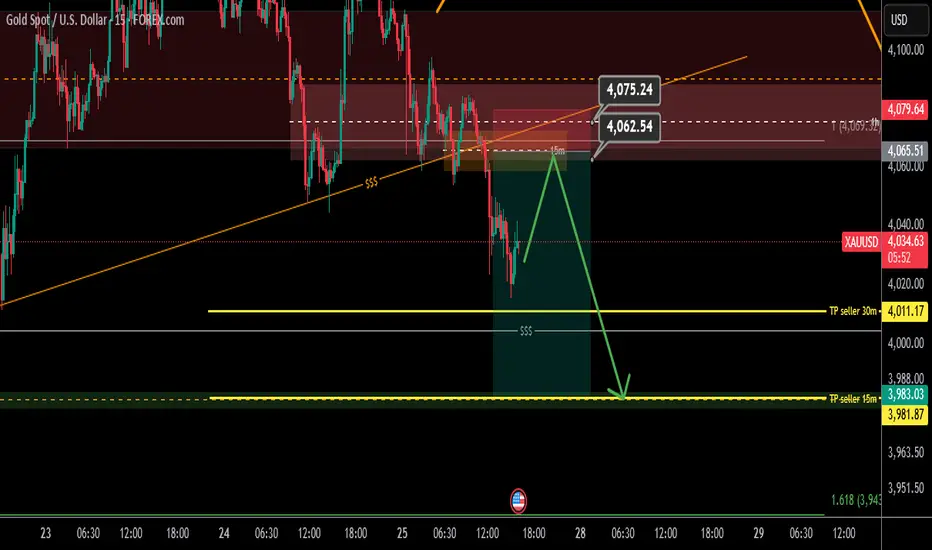
Time frame 15 minutes gold
The range I intend for the sell is 15 minutes for the seller's target and if it stabilizes below this target, 3895
XAUUSD - Gold awaits a decisive week?!Gold is trading below the EMA200 and EMA50 on the hourly timeframe and is trading in its range. A break below or above this range will lead to a continuation of the trend in the same direction. A correction towards the demand range will provide us with a better risk-reward buying opportunity. And a rise will provide us with the next short position!
After experiencing one of the worst trading sessions for gold in recent years and failing to achieve its tenth consecutive week of gains, many traders, analysts, and retail investors are now wondering where the gold market is headed next.
Mark Leibovit, publisher of the VR Metals/Resource Letter, took a cautious stance, saying:
“At the moment, I prefer not to hold any position in the market. I’m simply observing and waiting to see how conditions unfold.”
With the U.S. federal government shutdown still ongoing, the release of economic data next week is expected to be limited. As a result, market attention will once again shift toward central banks, particularly the Federal Reserve’s upcoming interest rate decision.
On Tuesday, the U.S. Consumer Confidence Index for October will be released. However, the main market movements are expected on Wednesday, when the Bank of Canada’s policy decision and the U.S. pending home sales data will be published — followed by the Federal Reserve’s policy announcement. Later, the Bank of Japan will provide an update on its monetary stance, and finally, the week will conclude with the European Central Bank’s (ECB) policy decision on Thursday, which could also influence the euro’s direction.
It is widely expected that the Federal Open Market Committee (FOMC) will cut its benchmark interest rate by 0.25 percentage points at the conclusion of its two-day meeting on Wednesday.
The Fed aims to lower borrowing costs and support the labor market through this move. Having kept rates elevated for an extended period to combat stubborn inflation, policymakers now view labor market stability as a higher priority, given that recent data show inflation remains persistent but under control.
According to the CME FedWatch Tool, which tracks rate expectations through federal funds futures, the FOMC is likely to reduce the federal funds rate to a range of 3.75%–4.00%, marking a second consecutive rate cut.
While many Fed officials have expressed readiness to ease rates, opinions still differ on the pace and extent of future reductions.
The outlook for upcoming policy actions remains uncertain, as the Fed continues to balance its dual mandate from Congress — containing inflation while maximizing employment.
A rate cut would bring the federal funds rate closer to a neutral level, where it neither stimulates nor restrains economic activity. Although the Fed kept rates high to fight inflation, the recent weakening in the labor market has become a more pressing concern.
Even though inflation remains above the Fed’s 2% annual target, officials are increasingly worried about the health of the labor market, as job creation has nearly stalled in recent months.
By lowering the federal funds rate, the Fed seeks to reduce short-term borrowing costs, encourage lending and investment, and bolster employment.
At the same time, trade tariffs are contributing both to rising prices and slower job growth. These import taxes have created uncertainty among business leaders, discouraging expansion plans and pushing higher costs onto consumers.
The Fed now faces the challenge of making interest rate decisions without access to many key economic reports it typically relies upon. In fact, the September Consumer Price Index (CPI) may be the last major economic data release the central bank receives for some time.
Other crucial government reports — including employment and GDP growth data — have been delayed or suspended due to the ongoing federal government shutdown, and may not be released at all for October.

Gold (XAU/USD) – Testing key support zone near 4,020 USDGold (XAU/USD) – Testing key support zone near 4,020 USD, potential short-term rebound
On the 15-minute chart, Gold (XAU/USD) continues to show weakness after failing to hold above the 4,080 USD resistance. Price action has formed a clear lower-high structure, indicating sellers remain in control.
Currently, gold is testing the horizontal support area around 4,010 – 4,020 USD, which previously acted as a strong demand zone. The market is consolidating in this region, suggesting that a short-term reaction or pullback could occur before the next major move.
Technical Outlook
Resistance: 4,080 – 4,090 USD
Support: 4,010 – 4,000 USD
Market Structure: Lower-High / Lower-Low (bearish bias)
EMA50: Slope remains downward, confirming short-term bearish momentum
RSI: Near oversold territory on lower timeframes, indicating possible rebound pressure
Despite the downward trend, the proximity to the 4,010 USD support zone increases the likelihood of a technical bounce toward 4,080 USD before any continuation lower.
Trading Plan Suggestion
Buy (counter-trend scalp):
Entry: 4,030 – 4,035 USD
Stop Loss: 4,010 USD
Take Profit: 4,080 USD
Sell (trend continuation):
Entry: 4,083 – 4,090 USD (after rejection)
Stop Loss: 4,110 USD
Take Profit: 4,020 – 4,000 USD
Summary
Gold remains in a short-term downtrend, but buyers may attempt to defend the 4,010 USD level. A strong bullish reaction from this zone could trigger a temporary pullback, whereas a breakdown below 4,000 USD would confirm further weakness toward 3,950 USD.
Keep this setup on your watchlist — follow to receive daily price action updates and intraday trading strategies.

GBP/USD on the 2-hour timeframe...GBP/USD on the 2-hour timeframe, using Ichimoku Cloud and trendline breakout structure.
My marked a “Target Point” with an arrow pointing upward — this suggests you’re identifying a potential bullish breakout target after the price broke above a descending trendline and out of the consolidation box.
---
Key Observations:
Current Price: Around 1.3345
Breakout Zone: Around 1.3320 – 1.3340
Target Zone (as per your chart): Approximately 1.3460 – 1.3470
Support Zone: Around 1.3300 – 1.3310 (recent consolidation box bottom)
---
📈 Estimated Target:
✅ Target = 1.3466 (±10 pips)
This aligns with the level i marked on the chart as the “Target Point.”
That’s about +120 pips potential from the breakout region (~1.3340 → 1.3460).
---
🔍 Technical Justification:
Price seems to have broken above the descending trendline.
The Ichimoku Cloud is thinning and may turn bullish if price sustains above it.
The measured move (height of the box added to the breakout level) also roughly aligns with 1.3460.
---

XAU/USD (Gold vs USD) chart on the 4-hour timeframe..XAU/USD (Gold vs USD) chart on the 4-hour timeframe, here’s the analysis based on what’s visible:
My drawn a rising trendline that has been broken to the downside — suggesting a bearish breakout.
The price is currently trading around $4,035, below the Ichimoku cloud (which adds to bearish confirmation).
I have two target points already marked on the chart, showing potential downside levels.
Based on my chart markings:
🎯 Target 1: Around $3,960
🎯 Target 2: Around $3,780 – $3,800
These targets match the measured move from the range of the consolidation (roughly $150–$200) projected downward from the breakout level.
✅ Summary:
Current price: ~$4,035
First target: ~$3,960
Second target: ~$3,780
Bearish bias remains valid while price stays below ~$4,150–$4,200 (the resistance and cloud zone).

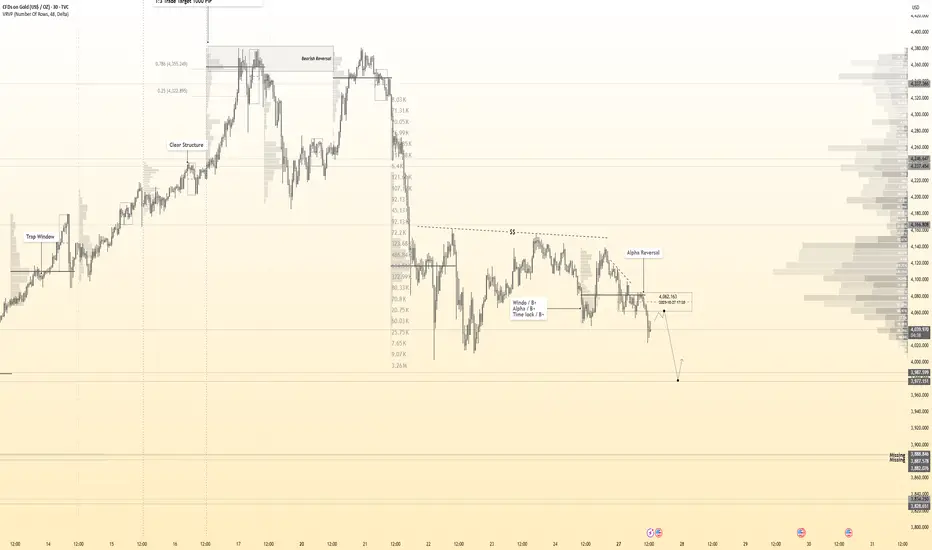
XAUUSD | Correction of the Corrective ImpulseThe Market Flow | Oct 26, 2025
Technical Overview
Monthly/Weekly:
• Both remain in structural expansion phases following a strong higher-timeframe impulse.
• Bias continues long above prior pivots, maintaining bullish structure despite current mid-term correction.
Daily:
• Broke the previous valley (daily pivot) and reached the daily breakout zone at 4040.20 .
• This defines the ongoing corrective impulse against the dominant bullish trend.
• Price is attempting to correct that impulse, forming a counter-correction structure beneath resistance.
H4/H1:
• Local wave structure is consolidating after a multi-leg retracement.
• The corrective move remains contained between the H4 pivot 4060.68 and EXP 4129.14 .
• The green EXP level at 4129.14 represents a clean, untested M15 breakdown —the active long trigger .
• Targets align with H1 Fibonacci 138.2–161.8% and the correction 61.8% retracement zone near 4204–4246 .
• Momentum fading below the EXP would imply continuation within the corrective leg.
Trade Structure & Levels
• Bias: Long above 4060.68
• Trigger = Break and sustained hold above 4129.14 (M15 EXP)
• Primary Invalidation = 4060.68 (H4 pivot)
• Secondary Invalidation = 4054.68 (H1 pivot)
• Path → 4129 → 4204 → 4239 → 4246
• Phase: Counter-corrective advance within a higher-timeframe expansion
Risk & Event Context
• Low probability structure as it represents a correction of the corrective impulse.
• Watch intraday reactions at the M15 expansion level—failure to confirm beyond it keeps bias neutral.
• Volatility expected around USD macro data.
Conclusion
XAUUSD is attempting a minor counter-correction within a broader corrective phase. The M15 expansion level at 4129.14 is the structural trigger for continuation toward 4204–4246, but the move remains fragile as long as price trades below the daily breakout pivot.
Disclaimer
This analysis is for informational purposes only and does not constitute investment advice, an offer, or a recommendation. Market conditions and price behavior may change without notice. Past performance is not indicative of future results. Always conduct your own research or consult a licensed financial advisor before making investment decisions.

SOL/USDT (3h timeframe)....SOL/USDT (3h timeframe), here’s what’s visible:
Im showing a symmetrical triangle breakout pattern.
The price has broken above the descending resistance line (around $198–$200).
My already marked two target points on the chart:
1. First Target Point ≈ $216
2. Second Target Point ≈ $236
So my price targets after the breakout are:
🎯 Target 1: $216
🎯 Target 2: $236
These targets align with the measured move from the height of the triangle (around $20–$30) added to the breakout level.
✅ Bonus tip: Watch for a retest of the breakout area (~$198–$200). If price holds above that and volume confirms, those targets remain valid.

XAUUSD Long: Bulls Preparing for the Next Impulse Toward 4180Hello, traders! Gold (XAUUSD) continues to move within a strong bullish structure, defined by a clear Ascending Channel. The market has shown steady buyer strength, forming consistent higher highs and higher lows. Along this uptrend, price has broken resistance level — most notably around 3950, turning him into new support zone. After reaching the upper part of the channel near the Supply Zone (around 4250), the price entered a corrective phase, retesting the midline of the ascending channel.
This correction appears healthy within the broader bullish context, as it aligns with previous pivot points and areas where demand has repeatedly returned.
Currently, the market is trading between the Support Zone (around 3950) and the Supply Zone (around 4100–4250). Buyers have recently defended the lower boundary of the channel, suggesting potential continuation to the upside if momentum sustains.
My main scenario anticipates a bullish continuation from the current pivot zone.
If the price successfully holds above the Demand Line and breaks through 4100, I expect a further move toward the 4180–4250 resistance area — which aligns with the top of the channel and prior supply zone.In my opinion, this structure still favors the bulls, and any correction toward 3950 would likely offer a buying opportunity within the prevailing uptrend.Therefore, my target (TP) is set at 4180, aiming for a retest of the channel’s upper resistance line. Manage your risk!

( Gold Protocol ) Bearish Reversal Detected
Status: Active Reversal Protocol
🆚Symbol: Gold
Session: London–New York Overlap (Smart Exit Window)
Bearish Reversal 4062
☄️ Volume Surge Confirmed — Sellers dominate exhausted highs
☄️ Session Aligned — Smart money exit window open
☄️ Cluster Shield Active — Supply imbalance verified
☄️ Delta Shift Negative — Buyers trapped above
☄️ POC Retest Completed — Liquidity absorbed at resistance
☄️ Structure Break Pending — Bearish bias confirmed
🚀 Logic: This is engineered reversal, not prediction.
🚀 Objective: Controlled execution with minimal drawdown.
Goal: Controlled Both Sides with minimal drawdown
★★★★★ (Smart Money Aligned)
GOLD → A psychologically important level of $4,000 lies aheadFX:XAUUSD continues to correct, unable to consolidate above $4,100, with the 4K mark ahead. Pressure is intensifying due to hopes for a trade deal between the US and China, as well as profit-taking ahead of the Fed's decision on interest rates...
Key factors:
Progress in trade negotiations: the US has withdrawn the threat of 100% tariffs, and China may support the situation. Thursday's meeting between Trump and Xi Jinping increases the chances of a deal.
Bets on two rate cuts in 2024 are almost fully priced in. US inflation (3% y/y) was lower than forecast (3.1%), but did not change expectations.
The correction may continue if the positive backdrop for the trade deal remains. The Fed's decision on Wednesday will be a key catalyst.
Technically, the 4K zone is ahead, and it is too early to talk about a break of this support, as we do not know how the market will react. However, at the moment, the price is in the range of 4000-4163, and from a technical analysis point of view, it is logical to consider a false breakdown and a pullback.
Support levels: 4000, 3975, 3944
Resistance levels: 4060, 4090, 4163
As part of the decline, the market may test one of the specified zones: 4000, 3975, 3944. However, since a liquidity pool has formed below 4K, the reaction to the psychological support level may be aggressive. It is important to monitor the situation, as closing below 4K and consolidating below a strong level could trigger a further decline. Otherwise, if the bulls manage to hold their ground above 4K and bring the price back above 4050, the market may have a chance to grow.
Best regards, R. Linda!

Gold Might Have Taken a Hit from the US–China DealGold started the week on a bearish note following reports that the US and China reached a new trade agreement. The pennant formation is currently being tested to the downside. If it breaks, the first target will be the 4000 support level, with the potential for further declines.
Key support levels to watch are 4045, 4000, 3930, and 3775. Traders should be ready for a volatile week filled with central bank meetings, the Trump–Xi summit, and developments related to the US government shutdown.

GOLD Massive Long! BUY!
My dear friends,
Please, find my technical outlook for GOLD below:
The price is coiling around a solid key level - 4068.0
Bias - Bullish
Technical Indicators: Pivot Points Low anticipates a potential price reversal.
Super trend shows a clear buy, giving a perfect indicators' convergence.
Goal - 4087.0
Safe Stop Loss - 4058.5
About Used Indicators:
The pivot point itself is simply the average of the high, low and closing prices from the previous trading day.
Disclosure: I am part of Trade Nation's Influencer program and receive a monthly fee for using their TradingView charts in my analysis.
———————————
WISH YOU ALL LUCK

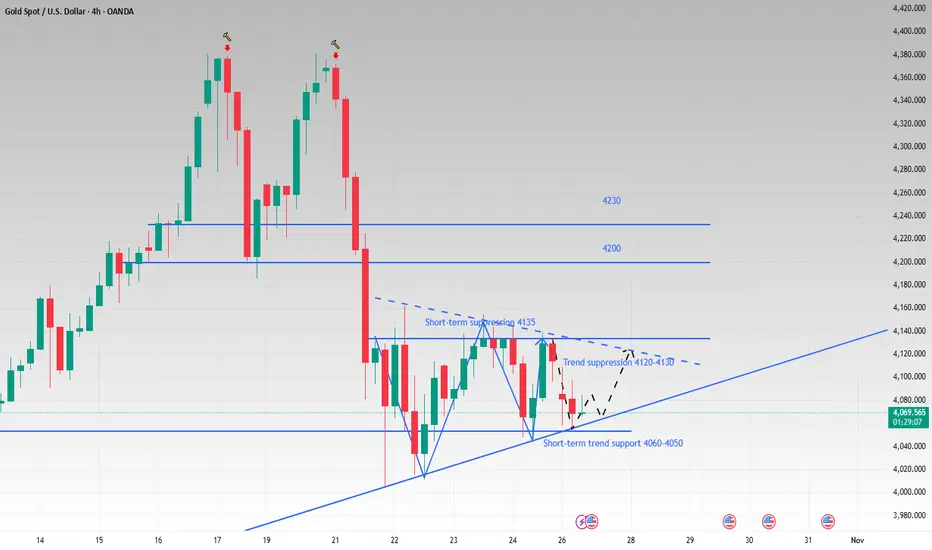
The triangle pattern breaks and looks at the directionLast week we repeatedly emphasized the importance of paying attention to the rising trend line of the 4H cycle. Until the price falls below this trend line, we will maintain our bullish stance. Although news of easing trade tensions between China and the United States over the weekend has brought a slight cooling to the market's tense mood, this has only temporarily suspended the bullish counterattack. Whether a real and effective consensus can be reached still requires attention to the APEC summit at the end of the month.
At the same time, the Federal Reserve's interest rate cut this week is almost a foregone conclusion, which has provided some support for the rise in gold prices. This has also contributed to the current relatively flat trend in gold prices, without as much fluctuation as last week. In addition to the rising trend line that we have been paying attention to, there is also a small downward trend line in the 4H chart, which makes the current trend fall into a triangle consolidation range.
The short-term support below is 4060-4050, and the trend suppression above is 4120-4130. Before the triangle pattern breaks to determine the future trading direction, we can sell high and buy low around this range.
The current hourly moving average is arranged downward, and it is expected to test the lower support again. If it falls back to the lower support and does not break, we can consider going long on gold.
GOLD Will Move Lower! Short!
Here is our detailed technical review for GOLD.
Time Frame: 1D
Current Trend: Bearish
Sentiment: Overbought (based on 7-period RSI)
Forecast: Bearish
The market is testing a major horizontal structure 4,076.79.
Taking into consideration the structure & trend analysis, I believe that the market will reach 3,724.27 level soon.
P.S
Please, note that an oversold/overbought condition can last for a long time, and therefore being oversold/overbought doesn't mean a price rally will come soon, or at all.
Like and subscribe and comment my ideas if you enjoy them!

GOLD (XAUUSD) – Liquidity Grab Setup | Buy-Side Sweep ScenarioGold is currently consolidating between $4,044 (PDL) and $4,113 (Buy-Side Liquidity Zone).
Price recently reacted from the demand zone near $4,044–$4,058, showing signs of bullish absorption.
The plan: a short-term liquidity sweep below $4,078, followed by a potential push toward $4,097–$4,113.
Key observations:
Buy-side liquidity resting above $4,097 and $4,113.
PDL ($4,044) and discount zone acting as a strong accumulation base.
Ideal scenario: Sweep of minor lows → structure shift → long entries targeting $4,113.
Watch for reaction near $4,068–$4,078 for confirmation.
Break below $4,044 invalidates the bullish setup.
📊 Bias: Short-Term Bullish (Intraday)

XAUUSD: A strong rebound toward 4,235 looks highly likelyHey everyone, it’s Erik here.
I’m closely watching a potential reversal zone on XAUUSD, which I’ve highlighted on my chart. Based on the current market structure, I expect price to face some rejection before continuing its move upward toward the 4,235 level.
This area could be a key decision point for the market. If buyers manage to hold the support, we could see a strong rebound and a continuation of the bullish momentum. But if price breaks below this zone, it could open the door for a deeper move down as liquidity builds beneath.
Should we get a clear bullish impulse, the next area I’ll be watching is T2. From there, we might see a period of accumulation or another sharp reaction, depending on the broader market sentiment at that time.
I’m simply sharing my personal view of the chart — this isn’t financial advice. Always confirm your own setups and manage your risk with patience and discipline.

GOLD → Technical analysis of the current situation FX:XAUUSD is consolidating, and the daily market behavior pattern is not particularly positive, but it does have bullish implications. Market sentiment largely depends on the fundamental background
This week, the Fed is expected to hold a meeting on interest rates, where it will most likely decide to lower them, which could generally support the dollar (but this news is most likely already priced in). Accordingly, the rest depends on decisions regarding the shutdown, trade war, and inflation. The resolution of the first two issues may weaken the price.
As for the technical side, since the price is currently within the trading range, it is worth considering trading within these limits first. However, a breakout and closing above/below one of the key levels: 4060 - 4150 could trigger further movement in the direction of the breakout, which in turn could push the price into another (bearish or bullish) trading range. Below, there is the 4000 zone, and there is a possibility of a retest of this area, with a potentially aggressive reaction.
Resistance levels: 4150, 4218, 4275
Support levels: 4060, 4015, 3944
While uncertainty remains, the market may continue to hold the price between 4060 and 4150. Another retest of the range boundary and the reaction to this retest will show the market's intentions for further movement.
Best regards, R. Linda!

Stop!Loss|Market View: NZDUSD🙌 Stop!Loss team welcomes you❗️
In this post, we're going to talk about the near-term outlook for the USDCAD currency pair☝️
Potential trade setup:
🔔Entry level: 0.57463
💰TP: 0.56839
⛔️SL: 0.57955
"Market View" - a brief analysis of trading instruments, covering the most important aspects of the FOREX market.
👇 In the comments 👇 you can type the trading instrument you'd like to analyze, and we'll talk about it in our next posts.
💬 Description: The New Zealand dollar continues to trade in a mid-term downtrend. Currently, this currency pair, as a commodity currency, is one of the most promising buying instruments for the USD, with further strengthening expected in the near future. Current prices are favorable for potential selling, but a false breakout near 0.57550 is possible, which would provide an even more reliable sell signal.
Thanks for your support 🚀
Profits for all ✅
❗️ Updates on this idea can be found below 👇

Technical Analysis – Aluminium FuturesTechnical Analysis – Aluminium Futures
Date: October 27, 2025 | Timeframe: Weekly | Exchange: Pepperstone CFD (LME Reference)
1. Trend Overview and Price Structure
Aluminium futures closed the week at USD 2,882/ton, up +0.9% from the previous week, confirming a breakout above the medium-term resistance zone of USD 2,700/ton.
The technical structure shows an 18-month accumulation base (from March 2023 to September 2025), now evolving into a new medium-to-long-term bullish cycle, targeting USD 3,075 → 3,304 → 4,061/ton.
Overall trend: Medium-term bullish, with solid support at USD 2,700.
2. Key Technical Price Levels
Resistance: 3,075 – 3,304 – 4,061
Support: 2,707 – 2,550 – 2,320
3. Detailed Technical Analysis
(1) Short-Term Trend
A decisive breakout above 2,707 confirms that a new medium-term impulse wave has begun.
If prices hold above this level for two consecutive weeks, aluminium may enter an accelerated rally toward 3,075.
(2) Volume and Open Interest
Open interest (OI) on LME and SHFE rose 7–9% over the past two weeks, signaling fresh speculative inflows and increased hedging activity by Asian producers.
(3) Elliott Wave Structure
Wave 1 (cycle bottom): 2,320 → 2,707
Wave 2: Minor correction
Wave 3 (in progress): Expansion phase targeting 3.30–3.40 (Fibonacci 161.8%)
Waves 4 & 5: Expected completion near 4.00–4.10
(4) Trend Confirmation Signals
Weekly close above 2,880 confirms a full breakout.
EMA-50 crossed above EMA-200 on the weekly chart — a clear long-term trend reversal signal.
4. VNC Intelligence View – Strategic Outlook
Macro and Structural Drivers
Aluminium’s rally is underpinned by strong fundamental catalysts:
Output Cuts in China: Power shortages in Guizhou and Yunnan have forced 6–8% production cuts among smelters.
(CNIA, Oct 24)
Rising Demand from the Green Energy Sector: Global aluminium demand from solar, EV, and power grid infrastructure rose 12% YoY, led by India and China.
(Bloomberg, Oct 21): Sharp Inventory Decline on LME. LME-registered aluminium stocks fell to 385,000 tons, the lowest since Feb 2022.
(LME, Oct 25)
Europe’s Secondary Production Cuts: High energy costs continue to limit capacity in Germany and France, tightening global supply.
(Reuters, Oct 23)
Higher Industrial Power Costs in China: Average industrial electricity prices up 5% since September, lifting production costs and supporting price recovery. (Shanghai Metals Market, Oct 18)
VNC Intelligence Assessment (BI View):
Short-Term (2–3 weeks): Range-bound consolidation 2,850–2,950 before the next leg higher.
Medium-Term (4–6 weeks): Upside targets 3,075–3,304 on robust macro and supply-side tailwinds.
Long-Term (Q1 2026): High probability of USD 4,000/ton if China maintains current power-use restrictions.
5. Suggested Technical Strategies
Preferred Long Setup (Primary Scenario):
Entry: 2,850 – 2,880 (retest of breakout zone)
Targets: TP1 3,075 | TP2 3,304 | TP3 4,061
Stop-Loss: 2,700
Probability: 75%
Rationale: Long-term base breakout confirmed by volume and macro fundamentals.
Counter-Trend Short Setup (Profit-Taking):
Entry: 3,300 – 3,320
Target: 2,900
Stop-Loss: 3,380
Probability: 25%
Rationale: Tactical pullback trade at Fibonacci 161.8% resistance.
6. Corporate Hedging Strategies
Asian Aluminium Producers: Consider short-hedging 30–40% of Q2-2026 output near 3,300–3,400, securing margins amid rising energy costs.
Aluminium Consumers (EV, Construction, Packaging): Initiate long hedges below 3,000, as Q1-2026 projections point toward 3,800–4,000/ton.
Medium-Term Investors: Maintain long exposure from 2,800–2,850 with a 3-month return potential of 15–20%.
VNC Intelligence Summary:
Aluminium has entered a confirmed structural uptrend, driven by tightening Chinese supply and accelerating green-energy demand.
With inventories at multi-year lows and macro conditions supportive, prices are likely to retest USD 3,300–3,400 in the near term and could approach USD 4,000 by early 2026 if energy constraints persist.

Gold: Balance of power between buyers and sellersKey levels 4004 and 3944 remain areas of interest for buyers, while sellers aim for 4011
Daily Timeframe
On the daily chart, the buyer initiative remains active.
The price has corrected below the 50% level of the initiative, and accumulation is currently taking place in this zone.
Key levels from the buyers’ perspective are 4004 and 3944,
while from the sellers’ side, the main resistance level is 4185, where we may see their reaction.
1-Hour Timeframe
On the hourly chart, the price has formed a sideways range, and the seller initiative is now active with a target at 4011.
It makes sense to look for long setups from a false breakout of the lower boundary of the range, around 4004.
If buyers defend the 4004 level, potential targets are 4160 and 4185, where seller reactions should be watched.
If buyers fail to hold 4004, then attention should shift to 3944, where another buyer response may appear.
Wishing you profitable trades!

Gold Price Analysis (XAU/USD) – October 27, 2025Gold Price Analysis (XAU/USD) – October 27, 2025 | Key Support at 4070, Eyeing Rebound Toward 4180
Gold continues to consolidate within a wide range between 4,000 – 4,180 USD/oz, after several days of sideways movement. On the 15-minute timeframe, the price recently completed a short-term descending channel and is now showing early signs of reversal from the 4,070 support area.
Technical Overview
Trend: Neutral-to-Bullish bias within the range
Support levels: 4,070 – 4,030 – 4,000
Resistance levels: 4,120 – 4,150 – 4,180
Indicators: RSI near oversold zone, potential for short-term recovery
Pattern: Breakout from falling channel suggests momentum shift toward the upper boundary of the range
Trading Strategy
Buy setup: Consider long entries near 4,070–4,050, targeting 4,150–4,180, with stop-loss below 4,030.
Sell setup: If price fails to break above 4,180, look for short opportunities targeting back toward 4,070.
Market Context
Gold remains supported by expectations of future Fed rate cuts and mild USD weakness. However, lack of clear catalysts keeps it trapped in consolidation. A clean breakout above 4,180 could open the way toward 4,240–4,280, while a breakdown below 4,000 would shift control back to sellers.
Summary
Today’s bias is mildly bullish as long as 4,070 holds. A bounce from this level could retest 4,150–4,180 in the short term.

Gold XAUUSD Macro map for 27 to 31 Oct 2025Macro map for 27 to 31 Oct 2025
Concentration of policy and inflation prints means policy expectations and real yields will drive the United States dollar, global equities, bitcoin, and gold. The hinge events are Wednesday FOMC, Thursday US GDP advance and German data, Friday US Core PCE and Chicago PMI. Secondary drivers are BoJ policy guidance and ECB tone, plus BoC.
Watch list
Real ten year yield and the DXY dollar index after FOMC and PCE
EUR front end versus USD front end after ECB and FOMC
VIX around the FOMC window and into PCE
US liquidity windows around 14:00 Eastern on Wednesday and 08:30 Eastern on Thursday and Friday
Gold outlook for next week
Set up
Gold trades the sign and size of moves in real yields and the dollar. Policy guidance and inflation prints are therefore the core drivers. A patient or cautious Fed, softer Core PCE, and any rise in macro uncertainty support gold through lower real yields and safe haven demand. A hawkish tilt and firmer PCE pressure it by lifting the opportunity cost of holding a non yielding asset.
Baseline view
The tape prefers a slow glide toward price stability without a growth accident. That backdrop keeps real yields contained or drifting lower and supports gold on dips. The opposite mix lifts real yields and weighs on the metal. Flows often scale in after the first spike around FOMC and PCE once spreads and liquidity stabilize.
Scenarios and probabilities
Upside continuation or breakout. Probability forty. Triggers are a patient FOMC and cooler PCE that push real yields down. A softer dollar would reinforce the move.
Balanced consolidation inside the recent weekly band. Probability thirty. Triggers are mixed signals across events and no major shift in real yields.
Pullback to prior support. Probability thirty. Triggers are firmer PCE or hawkish communication that lifts real yields. Dollar strength would confirm.
Key confirms and risks
Track the ten year real yield and the DXY. If real yields fall while the dollar is flat the setup still favors gold. If both rise, risk control becomes priority. Liquidity can thin quickly in the first minutes after data and during press events. Use predefined risk units and avoid adding into fast markets.
