GOLD Trading Opportunity! BUY!
My dear followers,
I analysed this chart on GOLD and concluded the following:
The market is trading on 4062.9 pivot level.
Bias - Bullish
Technical Indicators: Both Super Trend & Pivot HL indicate a highly probable Bullish continuation.
Target - 4083.0
Safe Stop Loss - 4050.2
About Used Indicators:
A super-trend indicator is plotted on either above or below the closing price to signal a buy or sell. The indicator changes color, based on whether or not you should be buying. If the super-trend indicator moves below the closing price, the indicator turns green, and it signals an entry point or points to buy.
Disclosure: I am part of Trade Nation's Influencer program and receive a monthly fee for using their TradingView charts in my analysis.
———————————
WISH YOU ALL LUCK
Metals

POssible 1:5 R2R on XAUUSDThis is a Follow up after the first entry from the previous post, Target 1 has been hit @ 4101 .
Still with Targets 2 and 3 in sight, we will b e anticipating a break and close above the 4089 price zone for a possible reentry as described in chart to target between 4172 - 4211 .
No Entry until this requirement
This is something to look out for upon the release of NFP today
Else, a possible Slide down to $3900
Patience is the way! Ieios

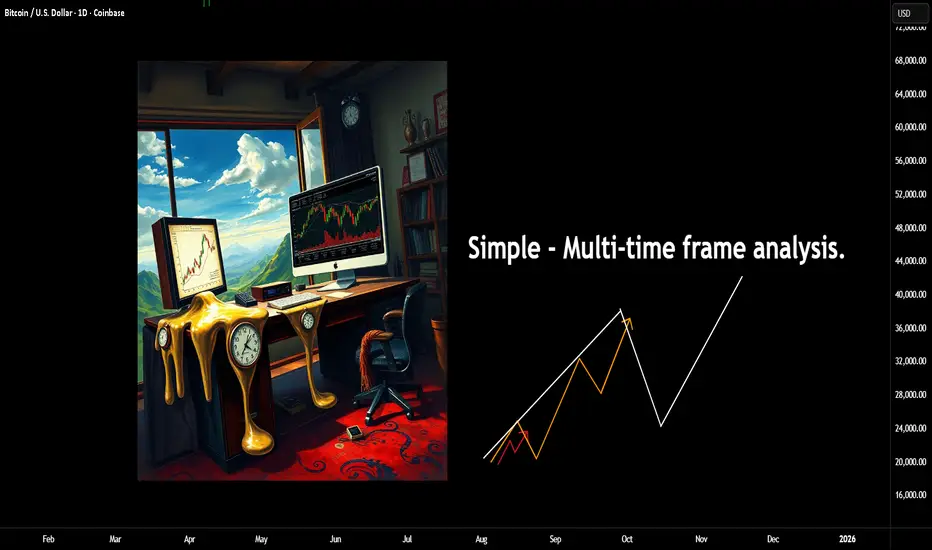
A simple way to view multi time-frame analysisHere's another area many traders struggle with. The real value in using multiple timeframes is to know what to look for and when to look for it!
As I have mentioned in a lot of my posts, all of this comes back to Dow theory; you don't need to make life hard on yourself. instead, simplify your approach and align a small number of timeframes and you will be surprised at the results.
Let me give you an example;
In this image above, you can see a clear push-up and a high, then a pullback.
Why not use this high? It had a clear change of character to the downside.
Well, the answer is - you would view these as separate timeframes. Although they are viewed on the exact same timeframe as my image. One you could call a primary trend and one a secondary.
For a bit more depth, see this post.
If you are already familiar with the idea, then the next thing you want to understand. What phase is the primary trend in?
This becomes important as you drill down to the entry timeframes, as what you are trying to do is to understand a general bias. Once you grasp this, you can even trade the counter-trend moves (if you like).
Ok, so with that being said. Let's add the second timeframe.
As you can see, the orange line represents the primary trend, whilst the internal white path now represents the secondary trend. Why this is key, is because at this stage, the larger trend also could be doing one of two things. Going UP or DOWN.
Up -
Down -
Once you understand the larger trend, the internal will work to facilitate the next leg of that higher degree. Of course, there will be reversals (but that's for another post).
Working with an uptrend for the sake of an example;
Price pushes up and then pulls back.
If we know the ranges, I have covered this in several posts recently (mechanical). We can quickly identify the higher timeframe range.
Once price breaks above this range, at some stage, you will expect to see a lower timeframe change of character, which is simply the start of a pullback on this higher timeframe. There are several ways to take advantage of this (again, another post).
But working with this example. The first move above the range happened overnight or when you were not at your desk. You now have the information to work with the next phase.
Assuming price is in a larger uptrend, you want to start to align these timeframes.
This will be the case regardless of where in the move you are.
These are only examples.
This image above shows the trigger trend in alignment with the higher timeframe. This image below shows the opposite.
Of course, there is more risk involved here as the bigger trend is going the other way, but as long as you acknowledge that, then opportunities will present themselves in both directions.
Here's a few examples on where or how to use this.
The second option is using the higher (secondary) not the trigger, but exactly the same concept.
Finally, the third option is using all three of the timeframes.
Firstly, you know the larger move is up. The second has started to align. Finally, the trigger trend (the minor) has it's change of character and you expect now the move to continue to the upside.
This gives a higher risk-to-reward ratio and often it's a higher probability in terms of the outcome. For the simple reason, the two higher timeframes now agree.
Some of the other posts connected to this one.
Anyways!
Take it easy.
Disclaimer
This idea does not constitute as financial advice. It is for educational purposes only, our principal trader has over 25 years' experience in stocks, ETF's, and Forex. Hence each trade setup might have different hold times, entry or exit conditions, and will vary from the post/idea shared here. You can use the information from this post to make your own trading plan for the instrument discussed. Trading carries a risk; a high percentage of retail traders lose money. Please keep this in mind when entering any trade. Stay safe.
Gold Resistance Rejection: Is the Next Leg Down Starting?Gold ( OANDA:XAUUSD ) has touched its upside targets as I expected in my previous idea .
Gold is currently trading near the Resistance zone($4,192 – $4,133) .
In terms of Elliott Wave theory, it appears that Gold is completing a Double Three Correction(WXY) .
I expect Gold to drop to at least $4,049 after breaking the Support lines .
First Target: $4,049
Second Target: $4,009
Stop Loss(SL): $4,192
Points may shift as the market evolves
Please respect each other's ideas and express them politely if you agree or disagree.
Gold Analyze (XAUUSD), 1-hour time frame.
Be sure to follow the updated ideas.
Do not forget to put a Stop loss for your positions (For every position you want to open).
Please follow your strategy; this is just my idea, and I will gladly see your ideas in this post.
Please do not forget the ✅ ' like ' ✅ button 🙏😊 & Share it with your friends; thanks, and Trade safe.

Analysis Update and Gold Entry Points
Hi Traders
Update on the one-hour gold chart (the analysis link is below) As expected and the chart path, three legs of the analysis have been completed so far, and exactly to the chart areas, the reaction is first an upward move from support and then a very good reaction from resistance, 4124. To continue the path and complete the fourth leg, we have a one-hour candlestick bet, which, if it stabilizes below this number, will give a pullback to the two levels of 4055 and 4068, a sell position and continue the path to the seller's target, which is 3980. I hope you have used this detailed analysis.
Analysis chart link:

GOLD BULLISH BIAS RIGHT NOW| LONG
GOLD SIGNAL
Trade Direction: long
Entry Level: 4,023.35
Target Level: 4,101.64
Stop Loss: 3,971.15
RISK PROFILE
Risk level: medium
Suggested risk: 1%
Timeframe: 6h
Disclosure: I am part of Trade Nation's Influencer program and receive a monthly fee for using their TradingView charts in my analysis.
✅LIKE AND COMMENT MY IDEAS✅

DeGRAM | GOLD will test the $4000 level📊 Technical Analysis
● The XAU/USD hourly chart shows price failing to break above the descending resistance line, reinforcing a bearish structure.
● Price is now approaching the longterm rising support line near ~4,000; a break below this trendline would open downside toward ~3,930.
💡 Fundamental Analysis
● Gold faces pressure as U.S. Treasury yields climb and real U.S. rates remain elevated, reducing the appeal of zero-yielding bullion.
✨ Summary
Resistance: ~4,110. Support: ~4,000 → ~3,930. Short-term bias: bearish while below resistance and at risk of breakdown below trendline.
-------------------
Share your opinion in the comments and support the idea with a like. Thanks for your support!

XAU/USD Intraday Plan – NFP Will Decide the Next MoveGold failed to clear the 4115 resistance yesterday, which led to a retest of the 4053 level — now acting as intraday support. Price is currently trapped between the MA200 and MA50, reflecting indecision ahead of the NFP release.
We need to see a clean break above the immediate resistance at 4078.
A sustained move above 4115 would confirm a momentum shift and open the door toward
4170 → 4232.
If price fails to clear 4078, we may see continued consolidation or another pullback into the Support Zone.
A break below 3,996 would expose the HTF Support Zone (3968–3921).
📌Key Levels to Watch:
Resistance:
4078
4115
4170
4232
Support:
4053
4027
3996
3968
3921
🔎Fundamental Focus:
Today is all about NFP, one of the most market-moving releases for gold. With job creation, wages, and unemployment all being published together, we can expect sharp volatility in both directions.

The Arena of XAUUSD-GOLD: New Round BeginsMy friends, Good Morning,
I have prepared a gold analysis for you in a swing trading structure.
The timeframe of this analysis is 4 hours.
In my XAUUSD-GOLD analysis, I will open sell positions between 4124.0 and 4176.0.
My targets are: TP1 - 3995.0 and TP2 - 3969.0.📊
This analysis is purely for your information.
To my friends who support each of my analyses with their likes,
I share these analyses thanks to your likes, because every single like from you is my greatest source of motivation to keep posting.
I sincerely thank all my friends who leave a like. 🙏
With respect and love.❤️

Brian here with the gold outlook for November 20th Good morning everyone, Brian here with the gold outlook for November 20th. The ABC correction phase of gold is nearly complete, and the market is preparing to enter a new wave phase amidst a flurry of USD data today.
Fundamental Analysis
Today's focus remains on the US labor data: NFP (or revisions), Unemployment Rate, and Initial Jobless Claims.
If the data shows a cooling labor market, expectations for the Fed to soon pivot to a rate-cutting cycle will rise, weakening real yields, putting pressure on the USD, and supporting gold prices.
Conversely, "too good" data will strengthen the dollar, allowing for a short-term repricing move, potentially dragging gold down to lower liquidity zones before recovering.
US session liquidity may be thin before the news release, making it prone to spikes due to algorithms and large flows simultaneously adjusting positions.
Overall, the macro backdrop still favors "buying the dip" for gold, but you must accept strong volatility around news time.
Technical Analysis
On the chart, gold has completed an ABC corrective wave within a descending channel, part of a larger uptrend.
The current descending channel only serves as a corrective leg after the previous upward wave; prices are trading above the "mean" area of the bullish structure, indicating the larger market structure remains bullish.
Below is the liquidity zone / demand zone 4013–4015, coinciding with the previous low and the lower channel boundary – if there's another stop-hunt to this area, it is still considered an opportunity to join the upward move, as long as 4008 is not breached.
Above, the 4086–4100 cluster is the decision zone: breaking and holding above here will confirm exiting the corrective channel, triggering an impulsive leg towards resistances 4132–4146 and further to 4187.
In summary, the main bias remains bullish, prioritizing buy strategies at support zones or after breakout confirmation.
Key Price Levels
Resistance: 4086 – 4100 – 4110 – 4132 – 4146
Support: 4040 – 4030 – 4015
Trading Scenarios
Buy Scenario 1 – Continuation Breakout
Entry: 4086
SL: 4078
TP: 4100 – 4120 – 4140
Prioritize when price breaks up and retests 4086–4100 as a new support zone, confirming exit from the descending channel.
Buy Scenario 2 – Deep Liquidity Sweep
Entry: 4015–4013
SL: 4008
TP: 4030 – 4045 – 4070
Watch for strong price reactions at the demand zone, with pin bars or engulfing candles signaling order flow returning to buyers.
Sell Scenario – Sell Reaction at Strong Resistance
Entry: 4144–4146
SL: 4151
TP: 4132 – 4120 – 4100
Short-term sell strategy, leveraging the high supply zone if price rises straight up without sufficient accumulation.
The medium-term upside target if the bullish wave develops as expected remains the 4187 area.
What do you think of this scenario? Remember to follow Brian for daily gold insights and comment your views below to join the discussion.

Gold H1 – Sideway or Preparing for a Bigger Break?🟡 XAUUSD – Intraday Smart Money Plan | by Ryan_TitanTrader (20/11)
📈 Market Context
Gold continues to move inside a tight consolidation as markets digest fresh headlines:
Treasury markets just erased hopes for a December rate cut and now even a January cut is doubtful, following hawkish tones revealed in the latest Fed minutes.
This shift reinforces USD strength in the short term and pressures gold’s bullish momentum, keeping price trapped between well-defined liquidity zones.
Key implications from the news:
• The 6-month Treasury yield jumped back to 3.83%, aligning with hawkish expectations.
• Rate-cut bets evaporating → USD stays firm, limiting gold’s upside.
• Institutions are engineering both-side liquidity sweeps ahead of upcoming Fed speakers.
• Gold is currently hovering around ~$4,070 inside a neutral zone where no clean premium/discount imbalance exists.
Until the market receives fresh macro catalysts, price is likely to sweep liquidity at the edges of the range before choosing direction.
🔎 Technical Analysis (1H / SMC Structure)
• Structure: Price remains inside a short-term sideways distribution after the recent CHoCH + BOS sequence.
• Premium Sell Zone: 4145–4147, aligning with unmitigated supply + buy-side liquidity resting above recent highs.
• Discount Buy Zone: 4004–4002, sitting inside last clean demand with previous sell-side sweep.
• Liquidity Map:
→ Buy-side liquidity: above 4145–4150 (equal-high cluster).
→ Sell-side liquidity: below 4004–3997, where earlier long positions were cleared.
🔴 Sell Setup (Premium Reaction Zone)
• Entry: 4145 – 4147
• Stop-Loss: 4155
• Take-Profit:
→ 4085 (minor imbalance)
→ 4045 (range midpoint)
→ 4004 – 4002 (discount demand)
📌 Execution rule: Wait for liquidity sweep into zone + bearish CHoCH M5–M15 before entering.
🟢 Buy Setup (Discount Reaction Zone)
• Entry: 4004 – 4002
• Stop-Loss: 3997
• Take-Profit:
→ 4040 (short-term range high)
→ 4075 (inefficiency fill)
→ 4140 (premium retest)
📌 Valid only if price sweeps the 4000–3997 liquidity pocket and shows strong bullish displacement.
⚠️ Risk Management Notes
• Expect increased volatility as markets reposition after the sharp decline in rate-cut expectations.
• Avoid trading inside the 4030–4080 chop zone unless a clear structure break occurs.
• Reduce risk size during sudden USD spikes caused by Treasury-yield moves.
• Trail stops progressively as each liquidity level is taken.
📝 Summary
Gold is currently stuck in a clean intraday range as hawkish Fed minutes remove hopes for early rate cuts, pushing USD up and holding gold below premium supply.
SMC structure favors liquidity-sweep setups at both edges:
• Sell Zone: 4145–4147 (premium supply)
• Buy Zone: 4004–4002 (discount accumulation)
Expect classic manipulation → reaction → continuation patterns until the market resolves the new macro pressure.
📍 Follow @Ryan_TitanTrader for more Smart Money updates.

Gold's price movement is unclear. Focus on today's NY market NFThe gold market is in a tug-of-war between bulls and bears, with focus on today's US NFP employment data.
Gold rebounded after hitting a low on Tuesday, with bulls launching a counterattack at the 4000 level. The upward trend continued on Wednesday, but it wasn't very strong; instead, it was a step-like, oscillating rise, indicating that the market remains in a wide-range consolidation phase. It needs time to build a new upward trend. Currently, bulls and bears are still locked in a tug-of-war, and short-term intraday traders should pay attention to the shifts in the bullish and bearish rhythms.
After opening higher in the Asian session today, gold then encountered resistance around 4110 and fell, reaching a low of 4040 before rebounding. This precisely tested the 4040 support level from Tuesday's pullback. Since the 4040 support is currently effective, we should continue to monitor the strength of the rebound, using 4040 as a stop-loss level. We should watch whether it can break above 4110. If it fails to do so, it presents a shorting opportunity. If it breaks above, it could reach 4130. However, a break below 4040 could trigger a short-term accelerated decline.
Key Levels:
First Support: 4040, Second Support: 4030, Third Support: 4000
First Resistance: 4085, Second Resistance: 4110, Third Resistance: 4130
Gold Intraday Trading Strategy:
Buy: 4045-4050, Stop Loss: 4040, Take Profit: 4070-4080;
Sell: 4095-4100, Stop Loss: 4110, Take Profit: 4080-4070;
More Analysis →

Stop!Loss|Market View: AUDUSD🙌 Stop!Loss team welcomes you❗️
In this post, we're going to talk about the near-term outlook for the AUDUSD currency pair☝️
Potential trade setup:
🔔Entry level: 0.64407
💰TP: 0.63705
⛔️SL: 0.64755
"Market View" - a brief analysis of trading instruments, covering the most important aspects of the FOREX market.
👇 In the comments 👇 you can type the trading instrument you'd like to analyze, and we'll talk about it in our next posts.
💬 Description: The Australian dollar continues to move lower, as sellers outlined a week ago. Selling remains a priority, and for today there are two scenarios (see chart). In both cases, the downside target is the lower boundary of the downtrend channel, with 0.63500 as a potential target.
Thanks for your support 🚀
Profits for all ✅

GOLD $GC Levels and Patterns AnalysisTraders and Investors,
Gold (XAUUSD) has been consolidating mostly but still has been giving a lot of great short term and swing trade opportunities.
I have updated the important levels and zones which can act as support and resistance. They should guide us a bit for the best possible trade opportunities.
There as possible W pattern forming. It has not formed or completed yet. It must first break the trend line and confirm the break. BTW, that trend line can also give us a good opportunities around it. Next, the price has to break the mid point of potential W pattern. Once it has done that, it can complete the W pattern.
Trade what you see, wait for the confirmations and manage the risk as always.
Follow for more. Please support this analysis by liking, commenting, and sharing with friends, colleagues, traders, and trading communities. Thanks👍🙂

Gold. Can we run from bull trap? 20/Nov/25Xauusd probably having pullback toward 4185 +/- before a "big surprise " for bull...

Bullish bounce off?Gold (XAU/USD) has bounced off the pivot which aligns nicely with the 61.8% Fibonacci retracement and could potentially rise to the 1st resistance.
Pivot: 4,043.08
1st Support: 3,973.06
1st Resistance: 4,149.32
Disclaimer:
The opinions given above constitute general market commentary and do not constitute the opinion or advice of IC Markets or any form of personal or investment advice.
Any opinions, news, research, analyses, prices, other information, or links to third-party sites contained on this website are provided on an "as-is" basis, are intended to be informative only, and are not advice, a recommendation, research, a record of our trading prices, an offer of, or solicitation for, a transaction in any financial instrument and thus should not be treated as such. The information provided does not involve any specific investment objectives, financial situation, or needs of any specific person who may receive it. Please be aware that past performance is not a reliable indicator of future performance and/or results. Past performance or forward-looking scenarios based upon the reasonable beliefs of the third-party provider are not a guarantee of future performance. Actual results may differ materially from those anticipated in forward-looking or past performance statements. IC Markets makes no representation or warranty and assumes no liability as to the accuracy or completeness of the information provided, nor any loss arising from any investment based on a recommendation, forecast, or any information supplied by any third party.

GBPCHF outcome.GBPCHF making higher highs and higher lows consistently. Now in the consolidation zone. Let's see if it will continue to climb going into London session.

GOLD LOSES MOMENTUM AFTER FOMC – BUY OR SELL OPPORTUNITY TODAY?1. Market Context
Yesterday, the market showed a clear risk-averse sentiment, leading safe-haven flows into gold. This pushed the price back up to retest the 4130–4133 resistance zone — an area where gold has repeatedly failed to break through.
During the US session, the FOMC minutes were released with a notably hawkish tone:
The Fed is not ready to cut interest rates yet.
They want more data before the December meeting.
Some members even want to maintain a tighter stance.
This message weakened gold’s bullish momentum, causing the price to correct down from the highs.
2. BUY Zones for the Day
🎯 Ideal BUY (highest priority):
4010
3998
🎯 Extended BUY:
4010 – 4015
4035 – 4040
→ These are solid support areas, suitable for traders looking to catch intraday rebounds.
3. SELL Zones
🔥 Strong SELL (major resistance):
4130 – 4133
🔥 Extended SELL:
4148 – 4150
→ Both zones align with multi-tested resistance levels that have shown strong reactions.
4. Special Zone to Watch – Trend Decision Point
📌 4080 – 4085 (Fibo 0.5 – 0.618)
If price breaks above 4085 clearly, gold may shift to an intraday bullish trend → prioritize breakout BUY, avoid SELL setups.
If 4085 holds, the market remains in range → continue BUY at support & SELL at resistance.
5. Suggested Trading Strategy
Style: SL 10 points – TP 10 points
Priority: BUY at clear support and SELL at strong resistance
Avoid trading in the mid-range (high noise, easy to get stopped out).
Enter positions only when price touches key zones — avoid chasing moves.

GOLD FALTERS POST-FOMC – BUY OR SELL NOW?1. Market Context
Yesterday, the market had a risk-averse sentiment, so safe-haven flows poured into gold, pushing the price to test the resistance area of 4130–4133 – where gold had previously failed multiple times.
During the US session, the FOMC minutes were released with a rather "hawkish" tone:
The Fed is not yet ready to cut interest rates.
Wants to see more data before December.
Some members even want to maintain a tighter stance.
This news weakened gold's upward momentum, and the price adjusted down from the peak.
2. BUY Zones for the Day
🎯 Ideal BUY (highest priority):
4010
3998
🎯 Extended BUY:
4010 – 4015
4035 – 4040
→ These are reliable support zones, suitable for a trading style that catches the rebound.
3. SELL Zones
🔥 Strong SELL (hard resistance):
4130 – 4133
🔥 Extended SELL:
4148 – 4150
→ Both zones coincide with resistance that has reacted well multiple times before.
4. Special Zone to Watch – TREND DECISION
📌 4080 – 4085 (Fibo 0.5 – 0.618)
If the price clearly breaks 4085, gold may change trend for the day → prioritize BUY on breakout, limit SELL.
If 4085 holds, the market remains sideways within the range and continues the strategy of BUY support – SELL resistance.
5. Suggested Trading Strategy
Style: SL 10 points – TP 10 points
Priority: BUY at clear support – SELL at strong resistance
Avoid trading in the middle zone (noise – easy to hit SL).
Place orders only when the price hits the zone – don't fomo in between.

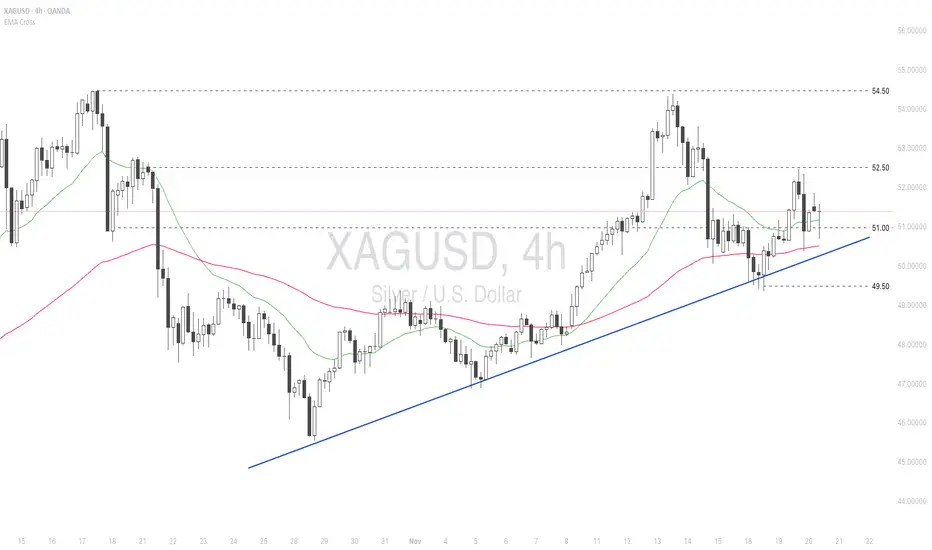
Silver holds steady amid soft labor data and a hawkish Fed
Silver prices are holding steady as markets weigh soft labor data against a hawkish Fed.
ADP reported that private-sector employment fell by an average of 2.5k jobs per week over the four weeks to Nov 1. Moreover, Cleveland Fed data also showed 39k workers received layoff notices in Oct, close to a 40k level that exceeded only during the global financial crisis and the pandemic.
Meanwhile, the Oct FOMC minutes were hawkish, with several participants indicating that an additional 0.25% cut would not be appropriate and stressing a risk-balanced approach to future policy decisions.
XAGUSD remains range-bound between 51.00-52.50, awaiting additional price triggers for a clear breakout.
If XAGUSD closes above 51.00, the price may retest the next resistance at 52.50.
Conversely, if XAGUSD breaks below EMA21 and 51.00, the price could retreat toward the subsequent support at 49.50.
Gold Surges as Investors Rotate Back to Safe HavensHello everyone, observing XAU/USD on the 1H chart today is genuinely impressive: from the 4,000 USD/oz low last night, gold has shot straight up to 4,074 USD/oz, gaining 74 USD within just a few hours. This is the kind of recovery that signals buyers never disappeared — they were simply waiting for the right moment to strike.
On the chart, the 4,000 USD/oz zone once again proved its role as a “steel defensive line,” where demand stepped in decisively, perfectly aligning with the green FVG that previously triggered a strong bullish leg. From that area, price climbed back into the Ichimoku cloud and is now approaching the 4,075–4,085 USD/oz resistance band. This will be the gateway for the next move: if gold breaks through, the market may push directly toward 4,100–4,120 USD/oz, and even as high as 4,150 USD/oz if momentum expands. Otherwise, rejection here could send price back to 4,040–4,030 USD/oz for a breather before continuing higher. The market tone right now is classic: accumulate – break – retest, with both sides fighting over narrow zones.
Importantly, today’s strong rebound isn’t purely technical. Safe-haven flows are returning as global equities drop sharply and US macro data — particularly labour indicators — show emerging weakness. Investors are pulling away from risk assets, especially overheated tech stocks inflated by the AI wave, and rotating back into gold — the traditional shelter whenever uncertainty grows. At the same time, expectations for a possible December rate cut remain alive, causing USD strength to stall and giving additional room for gold to recover. On top of that, Bloomberg and Goldman Sachs confirmed China bought another 15 tonnes of gold in September, reinforcing the idea that major players are still accumulating — and they usually move earlier than the crowd.
Based on the current signals, I believe this rebound still has room to extend. Gold may continue toward 4,075–4,085 USD/oz to fill the remaining FVG, and if that zone breaks with firm buying interest, the 4,100–4,120 USD/oz target is completely achievable today. A mild correction may still occur if profit-taking kicks in, pulling price back toward 4,040–4,030 USD/oz to build fresh equilibrium before resuming upward. Overall, gold feels like a drawn bow at the moment — ready for a further thrust if risk-off momentum persists.
This is a phase where gold truly returns to its core identity: a refuge when confidence fades. With capital rotating back into safe assets, a dovish signal from the Fed next month could turn this rebound into something much bigger heading into December. What about you — which scenario do you lean toward for gold today?

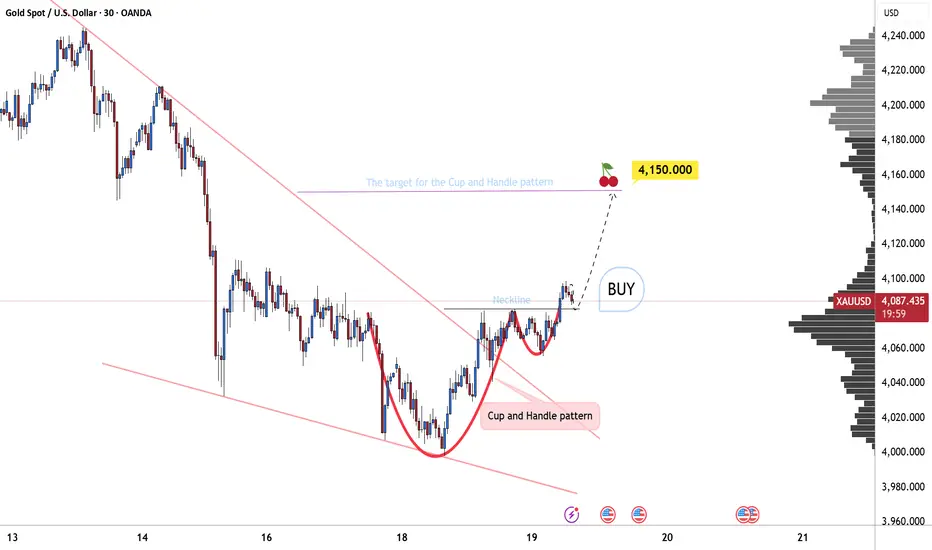
Cup and Handle: Bullish Outlook for GoldOANDA:XAUUSD is clearly forming a Cup and Handle pattern. The price previously dropped to the 4000 zone, then rebounded to 4080, completing the cup structure.
Afterward, the market is experiencing a slight pullback, forming a tight and well-controlled handle.
Finally, the price breaks through the neckline with strong momentum, and my next target is around 4150 , measured based on the height of the cup.
This is a classic bullish pattern, and market expectations are gradually being reinforced.
COPPER / GOLD & ISM PMI = Critical For AltseasonBeen seeing a lot of commentary on COPPER / GOLD.
This is a strong indication of industrial growth in the economy, as the demand for copper rises with build-outs.
The ISM PMI has a very strong correlation with C/G, also showing strength in the economy, as consumers buy more which gives businesses the ability to expand operations.
In a nutshell, these charts portray “Retail” ie “Main Street”.
There’s a very real possibility that we do not get our typical Alt Season at all this cycle if C/G & ISM PMI do not have a violent move up in the next few months. (more on this later)
The last time we saw such a divergence between these two was in January 2016 where it took C/G ~230 days to turn-up.
This would put Alt-Season Q4 ’26 - Q1 ’27, which makes sense theoretically based on Trump’s suspected stimulus plans which would come right before mid-terms.
This would give us our typical year-long bear market which has snuck up on us all because we lacked the retail euphoria phase due to very weak retail participation.
HOPIUM:
In 2016 When the ISM climbed above 50, COPPER soon found a bottom and Alts ripped.
Notice the bullish divergence on the RSI during that time, same as we are seeing now.
It looking like C/G may have found a bottom on this multi-decade parallel channel.
*Our livelihood depends on the ISM showing immense strength in the coming months so that C/G can follow.
