GOLD/ XAUUSD PREMIUM TRADE SETUP CHECK NOW📌 Trade Setup:
• Entry: 4335/4332
• Stop Loss: 4379
• Target: 4325
Price is showing signs of bearish pressure after rejecting a higher zone. The structure leans downward, suggesting sellers may remain active if the market continues to trade below the resistance area. Momentum currently favors a short move toward nearby support.
Disclaimer: This is not financial advice; it reflects only my personal market analysis
Metals

Silver uptrend continuation breakout support at 6288The Silver remains in a bullish trend, with recent price action showing signs of a corrective pullback within the broader uptrend.
Support Zone: 6288 – a key level from previous consolidation. Price is currently testing or approaching this level.
A bullish rebound from 6288 would confirm ongoing upside momentum, with potential targets at:
6500 – initial resistance
6600 – psychological and structural level
6700 – extended resistance on the longer-term chart
Bearish Scenario:
A confirmed break and daily close below 6288 would weaken the bullish outlook and suggest deeper downside risk toward:
6190 – minor support
6110 – stronger support and potential demand zone
Outlook:
Bullish bias remains intact while the Silver holds above 6288. A sustained break below this level could shift momentum to the downside in the short term.
This communication is for informational purposes only and should not be viewed as any form of recommendation as to a particular course of action or as investment advice. It is not intended as an offer or solicitation for the purchase or sale of any financial instrument or as an official confirmation of any transaction. Opinions, estimates and assumptions expressed herein are made as of the date of this communication and are subject to change without notice. This communication has been prepared based upon information, including market prices, data and other information, believed to be reliable; however, Trade Nation does not warrant its completeness or accuracy. All market prices and market data contained in or attached to this communication are indicative and subject to change without notice.

Multi Top - Multi Bottom. Go Next Your Golden Shift4300 to brace a bag (supply area). 4375 extension - to make it back.
GOLD: The Silent Takeover (Why Smart Money is Moving)The charts are speaking loud and clear. While the retail crowd is glued to the daily drama of Big Tech, Gold ( TVC:GOLD ) has entered a "pure trend" phase that is impossible to ignore.
Today we are breaking down why the yellow metal is currently the heavy hitter in the room.
1️⃣ THE DOMINANCE: Gold vs. The Giants 🥊
We always look for Relative Strength—assets that are moving UP when the rest of the market is struggling or moving sideways.
My latest scan shows TVC:GOLD is currently outperforming the market heavyweights. We are seeing Gold winning against:
The Tech Titans: Gaining ground against NASDAQ:AAPL , NASDAQ:MSFT , and $AMZN.
The Benchmarks: Showing stronger momentum than both the AMEX:SPY (S&P 500) and NASDAQ:QQQ (Nasdaq).
The Chip Leaders: While names like NASDAQ:NVDA are consolidating, the metals sector is expanding.
This isn't just a hedge anymore; it's an alpha generator.
2️⃣ THE TECHNICAL SETUP 📈
(Weekly Chart View) The price action on TVC:GOLD is textbook bullish.
The Breakout: We have smashed through the $4,300 level.
Trend Alignment: The Moving Averages are fanned out perfectly. There is no resistance overhead—just "Blue Sky" potential.
Momentum: The buying pressure is consistent. This isn't a spike; it's a ladder.
3️⃣ HOW TO TRADE THE RALLY? (The Watchlist) 📋
If you are looking to ride this wave, you need to know the vehicles available. Based on the current momentum, here are the tickers seeing the most action:
🔥 The "High Octane" (Leveraged Miners):
AMEX:GDXU : MicroSectors Gold Miners 3X – For those who want maximum aggressive exposure.
AMEX:JNUG : Direxion Daily Junior Gold Miners 2X – Junior miners often move faster (in both directions) than the majors.
AMEX:NUGT : Direxion Daily Gold Miners 2X – The standard for leveraged large-cap miner exposure.
🥈 The "Silver Sibling":
AMEX:AGQ : ProShares Ultra Silver – Silver often lags Gold, then catches up violently. Keep this on your radar.
🛡️ The "Steady" Hand:
AMEX:UGL : ProShares Ultra Gold – A 2x leveraged play on the metal spot price itself, avoiding miner-specific risks.
4️⃣ THE MACRO TAILWINDS 🌍
Why is this happening now?
The Fear Trade: Global uncertainty is funneling liquidity back into hard assets.
Fiat Hedges: With central banks worldwide continuing to print, Smart Money is treating Gold as the ultimate insurance policy.
Rate Expectations: As we look toward future rate cuts, non-yielding assets like Gold become mathematically more attractive.
💡 THE VERDICT
The trend is up, the momentum is real, and the relative strength is undeniable. Whether you are trading the spot price or the leveraged miners, the wind is at your back.
⚠️ RISK MANAGEMENT:
Leveraged ETFs like AMEX:GDXU and AMEX:JNUG are volatile instruments designed strictly for intraday or short-term trading.
CRITICAL WARNING: These are NOT for buy-and-hold strategies. Professional traders typically only use these for short swings and exit quickly.
If you are inexperienced, DO NOT TOUCH THESE. Leverage magnifies losses significantly. Most beginners lose money here. Educate yourself fully before trading.
👇 THE QUESTION:
Is this the run to $5,000? Or do you think Tech will reclaim the throne next week? Let me know in the comments!
🔥 Follow me AlgoatTV for more setups and professional analysis!
Disclaimer: This is not financial advice. Trading involves significant risk. Always do your own research.

GOLD | Short ideaGold tapped into the previous monthly high and since then been trending down.
Now it is at a key level where I expect Gold to reject and make a move down.
A reaction has been there already, it is very volatile so tread carefully.
Let me know what your analysis is!
Stay safe out there and do your own due diligence, this is not investment advise!

XAUUSD Daily Outlook: Breakout Confirmed by Volume & Volatility Technical Overview
In this analysis of Gold (XAUUSD) on the Daily timeframe, we are examining the convergence of trend structure, volume momentum, and volatility. The technical setup suggests a continuation of the current bullish sentiment, validated by multiple custom analytical tools.
1. Trend Structure & Targets
Indicator: Advanced Trend Break Targets (ATBT)
Price action has successfully breached a key resistance trendline. Following this breakout, the Advanced Trend Break Targets indicator has automatically projected the subsequent price objectives. As illustrated on the chart, the clean break above this structural level shifts the immediate bias to the upside, opening the path toward the projected high-probability zones.
2. Volume Momentum
Indicator: Bullish Volume Ratio
Underlying the price movement is a supportive volume structure. The Bullish Volume Ratio displays a clear upward trajectory and is sustaining a position above the central equilibrium level.
Interpretation: This positioning signifies robust buyer dominance. It confirms that the current rally is not hollow; rather, it is fueled by substantial accumulation and real trading volume, reducing the likelihood of a false breakout.
3. Volatility Context
Indicator: GARCH Volume Volatility
Volatility analysis is crucial for gauging the strength of a move. The GARCH Volume Volatility indicator is currently showing sharp fluctuations.
Interpretation: This spike in volatility metrics correlates with the breakout zone, indicating heightened trader interest and liquidity entering the market. Increased volatility during a breakout often acts as a catalyst for sustained directional movement.
Conclusion
Synthesizing the data from these three indicators, the outlook for Gold remains Strongly Bullish.
The Catalyst: A verified trendline breakout.
The Fuel: Strong buyer volume (Bullish Volume Ratio).
The Confirmation: Heightened market participation (GARCH Volatility).
Price is expected to maintain its upward trajectory as long as buyer control persists and volume supports the move.
Note: The custom indicators used in this analysis (Advanced Trend Break Targets, Bullish Volume Ratio, and GARCH Volume Volatility) are available on my profile for further study and application.

GOLD WILL GROW|LONG|
✅XAUUSD clears internal liquidity and breaks structure impulsively from the demand zone, opening a clean imbalance toward the premium target range above. Expansion likely continues as long as retracements stay within bullish order flow. Time Frame 4H.
LONG🚀
✅Like and subscribe to never miss a new idea!✅

XAGUSD SILVER GOING TO BLAST?✅ XAGUSD Trade Summary (Buy Setup)
Market Bias:
Bullish — price is holding above demand and building higher-low structure.
Entry Zone:
📍 63.70 – 63.80 (Demand zone + order block)
Reason for Buy:
Price respected demand zone multiple times.
Market is accumulating liquidity before moving higher.
Structure shifted bullish after recent pullback.
Clear target equal highs at Buy Side Liquidity Range.
Stop-Loss (SL):
📍 63.50
(Below demand zone & liquidity sweep)
Take-Profit (TP):
📍 64.30 – 64.32
(Targeting Buy Side Liquidity)
Risk-Reward Ratio:
Approx 1:3 RRR
Expectation:
Price should hold above the demand range, build bullish order flow, and sweep buy-side liquidity at 64.30+.

XAUUSD READY FOR FLY (READ CAPTION)Hi trader's
Gold is currently showing a bullish bias as long as the price holds above the major support zones.
🔹 Support Levels:
4209: The first strong support zone where buyers may step in to push the price higher.
4196: The second, deeper support level. If price dips here, strong demand is likely to build.
🔹 Resistance Levels:
4240: The first immediate resistance. A breakout above this level could trigger the next bullish move.
4260 (Supply Zone): A major supply area where sellers may attempt to push the price down. A clean break above this zone can lead to strong bullish continuation.
🔹 Bias:
The market structure continues to form higher lows, supporting the bullish sentiment. As long as price stays above the support levels, upside targets remain valid.
please like comment and follow thank you

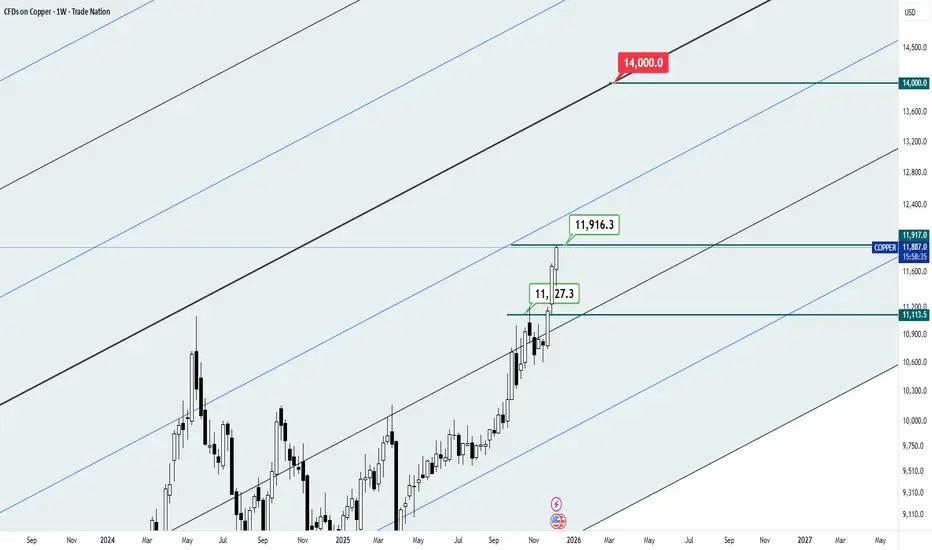
What is the rate of 14K displayed for?According to the past analysis that you can see in the link below and the speed of its realization:
What the chart on Friday morning can do is keep the copper market active awake. The predictable rates for this metal are colorful and to hedge the risk, you should keep an eye on the future rates in copper!!
Good luck...
NZDUSD: bearish reversal🛠 Technical Analysis: On the 4-hour timeframe, NZDUSD is showing signs of exhaustion after a sustained rally. The price is now trading near a strong resistance zone around 0.5850 and is expected to execute a short-term jump towards 0.5850-0.5880 for a final liquidity grab (liquidating late buyers) before a major reversal. The chart shows a potential downside move back to the key support level at 0.5690.
———————————————
❗️ Trade Parameters (SELL)
———————————————
➡️ Entry Point: Sell at Resistance (approx. 0.5850 – 0.5880)
🎯 Take Profit: 0.5690 (Support)
🔴 Stop Loss: Above the resistance zone (approx. 0.5915)
⚠️ Disclaimer: This is a potential trade idea based on current analysis; market conditions and price direction are subject to change based on news factors and volatility.

Copper At A Crossroads: Rally Exhaustion Vs Macro RiskCopper just delivered a classic volatility sequence: a blow off into the 5.89 area, followed by a fast 27% flush in six days. Since printing the 4.29 low, price has been grinding higher and is now back into my short entry around 5.40, which is roughly a 26% retrace of the drop. What matters to me here is the structure: we retraced without a clean liquidity sweep above the prior extreme, which keeps the move looking corrective, not a fresh impulse leg.
On the macro side , the tape has been pricing a lot of bullish copper narratives at once. We have seen copper trade at record levels in global benchmarks, with the rally supported by supply risk headlines and policy driven optimism. That is exactly why I am interested in fading the retrace: when supply premium and bullish positioning get crowded, even small shifts in risk appetite can trigger sharp mean reversion. Recent reporting has highlighted how sensitive flows and inventory distribution can become when policy risk enters the picture, which tends to amplify volatility rather than smooth it.
Technically, I am treating 5.40 as the “decision zone” after the rebound. As long as price holds below the prior spike region near 5.89, my base case is a rotation back toward the mid range and ultimately a retest of the 4.29 low. If we reclaim the prior extreme and hold above it, that would invalidate the correction thesis and I would reassess.
Note: Please remember to adjust this trade idea according to your individual trading conditions, including position size, broker-specific price variations, and any relevant external factors. Every trader’s situation is unique, so it’s crucial to tailor your approach to your own risk tolerance and market environment.

XAGUSD 4h
Finally after couple days attempting Gold could break the important resistance.
Upon checking daily candles, close of daily candle on Dec 11 was with a strong body that covered all the candle's shadows of previous days attempts on breaking resistance line.
First target is previous high and next would be around channel top line.
Stay tuned for our next update.

New Name, New Year, New War: Venezuelan invasion coming soon? The Trump administration has made its intentions toward Nicolás Maduro clear. Removing the Venezuelan president is a stated goal, but the path the administration is willing to take remains uncertain.
A former U.S. ambassador to Venezuela has described the deployment of American ground troops as a “last option”, but anything is possible with Trump and his newly named Department of War.
Washington has already seized a tanker carrying Venezuelan crude and is preparing to intercept additional shipments. Also, the U.S. has carried out more than twenty strikes on vessels it claims were involved in drug-smuggling operations. Each step raises the risk of a broader confrontation.
Metal markets might rally on escalation. Silver remains in a strong vertical trend. The move above 63 pushed price into fresh record territory before a modest pullback. Gold has broken through the recent range and printed a new swing high near $4,285 before pulling back.
Any significant development in Venezuela, such as a new seizure or a military operation, could trigger a higher open in metals when markets resume.

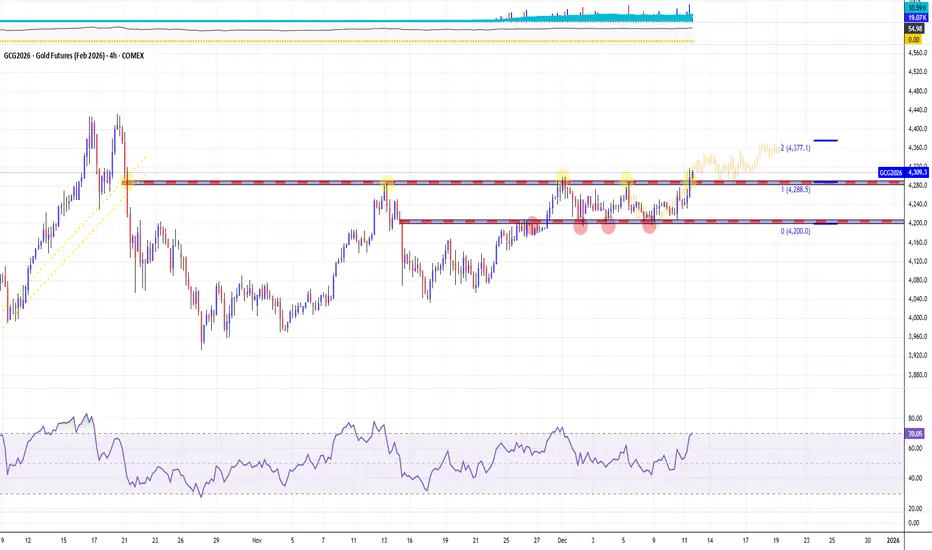
Gold Extends Its Advance as Price Re-Approaches Major ResistanceThe chart shows Gold continuing to build on its broader uptrend, with price pressing back toward the well-defined resistance zone near 4,379 after several weeks of steady consolidation. Recent candles reflect renewed momentum, supported by both trend structure and indicator behavior.
Price remains firmly above the 50-day SMA, which has acted as dynamic support throughout the advance. The 200-day SMA is also trending higher and well below current price, reinforcing the longer-term bullish structure. A rising short-term trendline has guided the market from the November lows, and price is currently respecting this structure as it approaches the upper boundary of the range.
Momentum indicators show improving participation. The MACD has crossed back above its signal line, suggesting strengthening upside momentum after a cooldown phase. Meanwhile, the RSI is hovering near the upper portion of its range but remains below overbought territory, reflecting constructive momentum without immediate signs of exhaustion.
Overall, the technical landscape leans constructively bullish, with price retesting resistance while supported by rising averages and improving momentum. How price behaves around the 4,379 zone may determine whether consolidation continues or the prevailing trend resumes.
-MW

Silver looks like it may finally b ready 2 confirm the c&h breakI feel like at the very least price action s ready to continue up to the dotted red emasured move lines target from a pattern we broke up from some time ago. SO next stop should be around $71 dollars. What it does after that is anyones guess but it does seem like probability is high that it will be validating the cup and handle breakout the neckline of which is shown here in green. You cant grasp from this picture just how high the dotted green measured move line goes for the cup and handle breakout but even after it reaches the dotted red measured move target here to reach the dotted green one it would still have to 10x or so. So obviously validating the cup and handle breakout here would be massively bullish. *not financial advice*

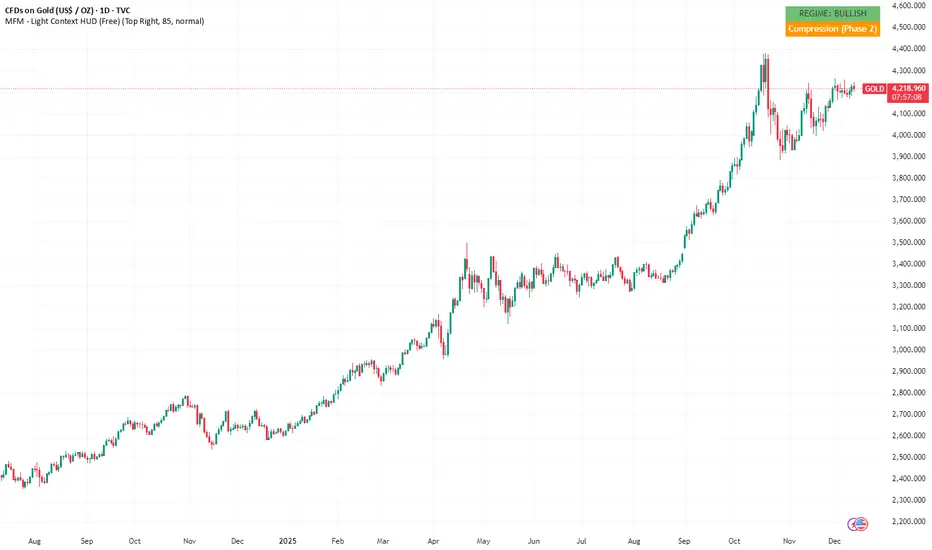
Gold: Compression Phase Inside a Bullish Regime (MFM HUD)Educational context only. Not financial advice.
What the HUD shows
Regime : Bullish (higher-timeframe momentum supportive)
Phase : Phase 2: Compression
No signals or forecasts
Gold has pushed higher in recent months. The HUD now shows a shift into compression,
meaning momentum has cooled and the internal rhythm has leveled off. You often see this first in the phase structure before it shows up in price.
What phase 2 usually tells you
Phase 2 is a neutral, reorganizing state. Typical behavior includes:
tighter ranges
slowing momentum
less directional pressure
reorganizing momentum rather than accelerating or reversing
It doesn’t lean bullish or bearish. It just reflects a market that’s taking a breather.
Regime vs. Phase
A bullish regime sets the broader environment. Phase 2 shows that short-term momentum isn’t pushing strongly right now.
Together, this often results in slower, less expressive movement even if the larger trend remains intact.
Why this matters
Structural shifts tend to appear earlier in regime/phase behavior than in candles alone.
The HUD simply makes that visible: no signals, no predictions, just context.
What this chart illustrates
A strong trend behind us
A shift into structural compression
A neutral internal state inside a supportive macro backdrop
This is purely contextual information and does not imply future direction.
Disclaimer
This post is for educational and analytical purposes only.
It does not provide trading signals, financial advice, or predictions.
All observations describe structural market conditions only.
© 2025 Inratios. Market Framework Model (MFM) protected via BOIP i-Depot #155670.
Gold :)Based on the price structure observed in the higher timeframes, the market is expected to enter a corrective phase in the short term. Signs of weakening buying pressure and the pattern formed around recent highs have increased the likelihood of a temporary decline. Therefore, it is anticipated that the price could drop toward the **4170** level. If the price stabilizes below this area, a continuation of the downward move toward lower support zones is also possible. However, if a strong bullish reaction is seen around 4170, it could indicate the end of the correction and the beginning of the next upward wave.

Is the World Sleepwalking Into a Platinum Catastrophe?The global economy is currently entering a precarious era defined by resource nationalism, where the BRICS+ alliance has effectively consolidated control over critical minerals, including the vast majority of primary platinum production. As geopolitical fragmentation deepens, the West faces a severe strategic vulnerability, as it relies heavily on adversaries like Russia and China for the metals essential to its green transition. This dependency is compounded by the weaponization of trade, with export controls on other strategic minerals already signaling that platinum—a metal critical for hydrogen fuel cells and electrolysis—could be the next target in a looming "commodities cartel" strategy.
Simultaneously, the market is grappling with a severe and structural supply deficit, projected to reach a critical 850,000 ounces by 2025. This shortfall is driven by the collapse of primary production in South Africa, where a crumbling energy infrastructure, labor instability, and logistical failures are strangling output. The situation is exacerbated by a "recycling cliff," as economic pressures reduce the scrapping of old vehicles, drying up secondary supply lines just as above-ground inventories are being rapidly depleted.
Despite these supply shocks, demand is poised for a tsunami driven by the hydrogen economy, where platinum is the indispensable catalyst for Proton Exchange Membrane (PEM) electrolyzers and heavy-duty fuel cell vehicles. While investors historically viewed platinum through the narrowing lens of internal combustion engines, resilient demand from hybrid vehicles and strict Euro 7 emissions regulations ensures that automotive usage remains robust. Furthermore, the hydrogen sector is projected to grow at a staggering 32% CAGR through 2030, creating entirely new structural demand that the current supply chain cannot meet.
Ultimately, the article argues that platinum is drastically mispriced, trading at a deep discount despite its strategic imperative and monetary value as a hard asset. The convergence of supply destruction, geopolitical leverage, and exponential green demand signals the arrival of a "Platinum Supercycle". With cyber warfare posing an additional invisible risk to mining infrastructure and China aggressively securing patent dominance in hydrogen technology, the window to acquire this undervalued asset is closing, positioning platinum as the potential "apex trade" of the coming decade.

DeGRAM | GOLD will correct to the $4150 level📊 Technical Analysis
● XAU/USD is compressing inside a large symmetrical structure, repeatedly rejecting the descending resistance line near 4,238, showing persistent seller control. A breakdown toward 4,192 and potentially the rising support line near 4,160 becomes likely if price fails to reclaim mid-range support.
● Momentum weakens with lower highs and fading bullish follow-through, increasing probability of a medium-term bearish continuation.
💡 Fundamental Analysis
● Recent data shows steady U.S. labor strength and firm Treasury yields, limiting gold’s ability to rally as markets price slower Fed easing.
✨ Summary
● Short bias: rejection at 4,238 → targets 4,192 and 4,160; key resistance 4,238–4,277.
-------------------
Share your opinion in the comments and support the idea with a like. Thanks for your support!

XAU/USD Daily OutlookXAU/USD Daily Outlook – Key Levels 4219 and 4220 Remain the Market’s Pivot Zone
The current price action on XAU/USD continues to compress inside a wide-ranging consolidation box, with the 1H structure repeatedly reacting around the major resistance band at 4219–4220. This level has been tested multiple times, forming a clear horizontal ceiling where buyers consistently fail to maintain momentum.
Despite the rejection wicks, bullish pressure remains visible after price tapped the intraday support near 4208 and created a short-term higher low. This suggests that buyers may attempt another push toward the top of the range if 4219 is reclaimed.
Key Technical Structure
1. Major resistance zone
4219 – 4220 is acting as a multi-touch rejection level. Three previous highs (4220.828, 4220.286, 4220.015) confirm strong supply. Only a clear breakout with candle body close above 4220 would signal bullish continuation toward 4235–4250.
2. Support zone inside the range
4206 – 4208 is the nearest intraday support where buyers recently absorbed selling pressure. The market formed a reaction at 4219.473, indicating that bulls are not fully exhausted.
3. Trendline and Fibonacci reaction
Based on the most recent downswing, price is attempting to recover above the short-term trendline. The projected bullish path remains valid as long as price holds above the 4208–4210 zone. A Fibonacci retracement from the latest impulse aligns the 0.382–0.5 cluster near 4207, reinforcing this as a defensive area for buyers.
4. Market behavior
The repeated chop inside the range shows accumulation, and the dotted projection on the chart highlights a possible bullish staircase structure if price maintains a sequence of higher lows.
Important Levels to Watch
Resistance:
4220 – Key breakout level
4235 – First upside target
4250 – Upper extension of the range
Support:
4208 – Intraday reaction point
4198 – Mid-range support
4185 – Deeper liquidity zone
Trading Strategy Idea
Bullish Scenario (preferred if 4208 holds)
Wait for a clean retest of 4208–4210.
Potential upside targets: 4219 → 4235 → 4250.
A breakout above 4220 with strong volume would confirm continuation toward the top of the projection zone.
Bearish Scenario
If price fails to hold above 4208, downside liquidity may pull the market toward 4198 or even 4185. Only look for sells if the candle closes below the short-term trendline and structure breaks down

Gold 30-Min — Volume Buy Reversal Triggered⚡Base : Hanzo Trading Alpha Algorithm
The algorithm calculates volatility displacement vs liquidity recovery, identifying where probability meets imbalance.
It trades only where precision, volume, and manipulation intersect —only logic.
✈️ Technical Reasons
/ Direction — LONG / Reversal 4185 Area
☄️Bullish momentum confirmed through strong candle body.
☄️Structure shifted with higher-low near key demand base.
☄️Volume expanding confirms order-flow alignment upward.
☄️Buyers reclaimed imbalance with sustained clean break.
☄️Algorithm detects rising momentum under low liquidity.
⚙️ Hanzo Alpha Trading Protocol
The Alpha Candle defines the day’s real control zone — the first battle of momentum.
From this origin, the Volume Window reveals where the next precision strike begins.
⚙️ Hanzo Volume Window / Map
Window tracked from 10:30 — mapping true market behavior.
POC alignment exposes institutional bias and breakout potential zones.
⚙️ Hanzo Delta Window / Pulse
Delta window monitors real buying vs. selling power behind each move.
Tracks volume aggression to expose who controls the candle — buyers or sellers.
When Delta aligns with Volume Map, momentum becomes undeniable.

Could we see a bounce from here?Gold (XAU/USD) is falling towards the pivot and could bounce to he 1st resistance which acts as a multi swing high resistance.
Pivot: 4,200.44
1st Support: 4,167.93
1st Resistance: 4241.96
Disclaimer:
The opinions given above constitute general market commentary and do not constitute the opinion or advice of IC Markets or any form of personal or investment advice.
Any opinions, news, research, analyses, prices, other information, or links to third-party sites contained on this website are provided on an "as-is" basis, are intended to be informative only, and are not advice, a recommendation, research, a record of our trading prices, an offer of, or solicitation for, a transaction in any financial instrument and thus should not be treated as such. The information provided does not involve any specific investment objectives, financial situation, or needs of any specific person who may receive it. Please be aware that past performance is not a reliable indicator of future performance and/or results. Past performance or forward-looking scenarios based upon the reasonable beliefs of the third-party provider are not a guarantee of future performance. Actual results may differ materially from those anticipated in forward-looking or past performance statements. IC Markets makes no representation or warranty and assumes no liability as to the accuracy or completeness of the information provided, nor any loss arising from any investment based on a recommendation, forecast, or any information supplied by any third party
